|
In a recent post, we reviewed the market for mortgages with down payment assistance features[1]. We noted that our loan-level data for FHA showed a rate that was about half of that reported by the FHA Portfolio Snapshot database. Since the agency disclosures are at the loan level, we use this dataset to do a deep dive into which servicers are most active with this product and what loan performance looks like across institutions. Unlike the previous note, which covered all deliveries, here we focus on the market for new purchase mortgages. Below find a table of the DPA usage for the top ten FHA purchase mortgage issuers in 2023, along with summary statistics for 2022 and 2021: 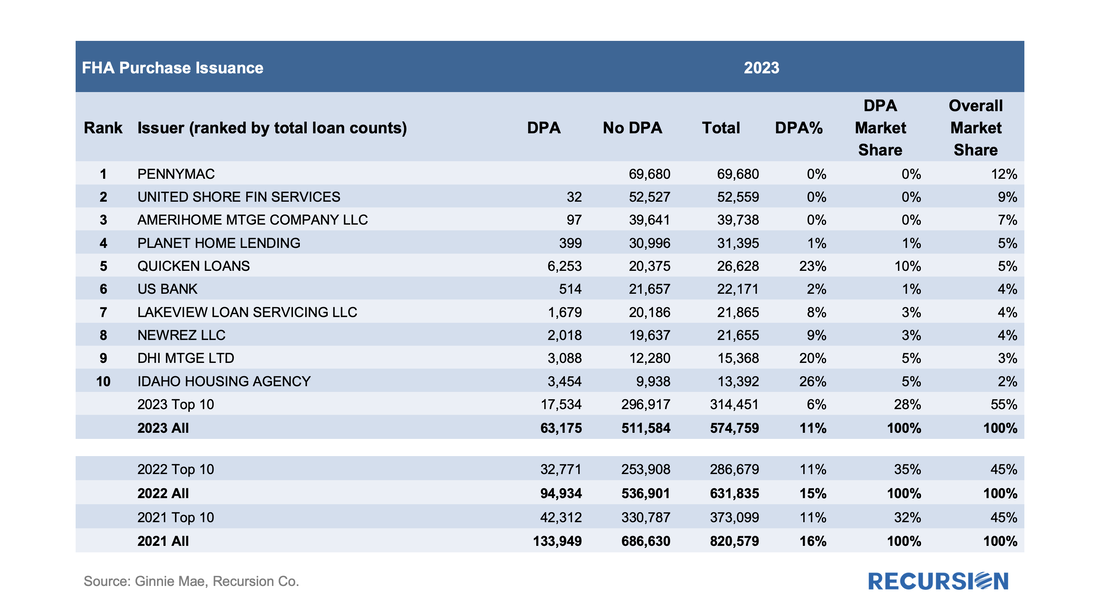 In a recent post, we noted that delinquency rates for two classes of FHA modified loans were rising faster than for the general population, namely reperforming (RG) and extended term (ET) loans[1]. In this post, we dig down into details to get a closer view of the behavior of lenders in these categories. We start with RG loans. As noted in the previous blog, the program was launched in January 2021, allowing borrowers who had outstanding unpaid balances from the Covid period but six consecutive months of payments to roll the balances into a “partial claim” due when the loan is extinguished. At that time, a new “RG” custom pool category was formed to issue these mortgages. Starting in February 2023, the seasoning period was reduced from six to three months and these loans became eligible to be issued in Ginnie Mae multi-issuer pools. The share of these loans in multi-issuer pools reached over 2/3 at the end of 2023. Delinquency rates are modestly higher for RG loans in multi-issuer pools relative to RG pools even though they are relatively new. One topic that comes up is which servicers are most involved in this loan type and how much variation in behavior can be seen across these institutions. Below find the list of the top 15 institutions issuing RG loans and the distribution of each by pool type 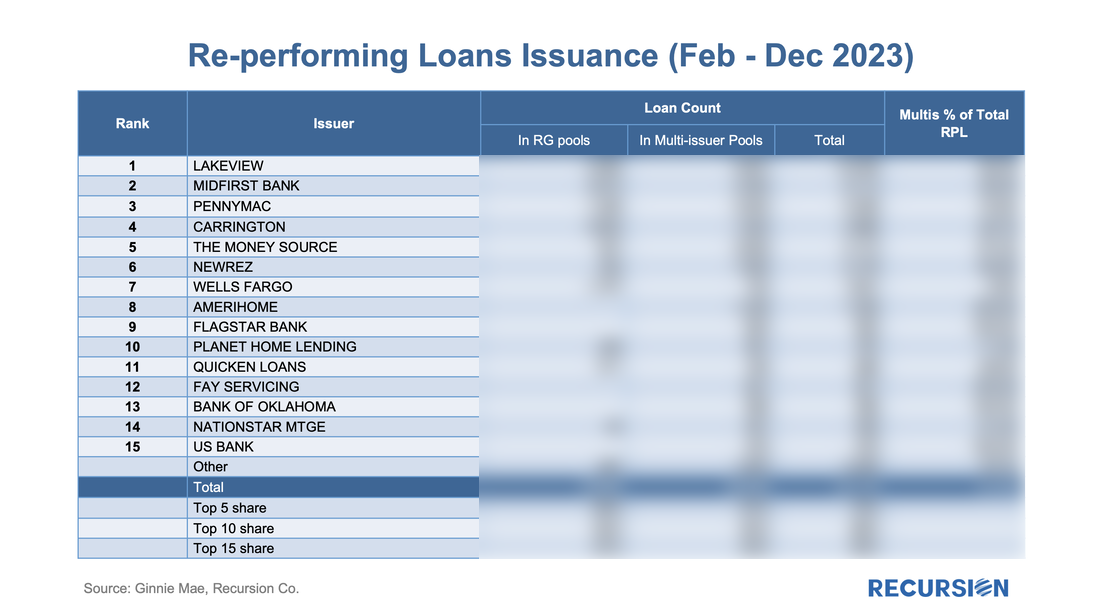 This is the third and (for now) final entry in our series of posts regarding appraisal modernization. The first describes the framework of data disclosures provided by the GSEs[1], while the second looks at differences in usage of the various programs between Fannie Mae and Freddie Mac and between banks and nonbanks[2]. In this note, we look at loan prepayment performance and the drivers behind it. Here we see 1-month CPRs and loan rates for purchase loans issued in 2023 with waivers and those eligible for waivers but did not obtain one: 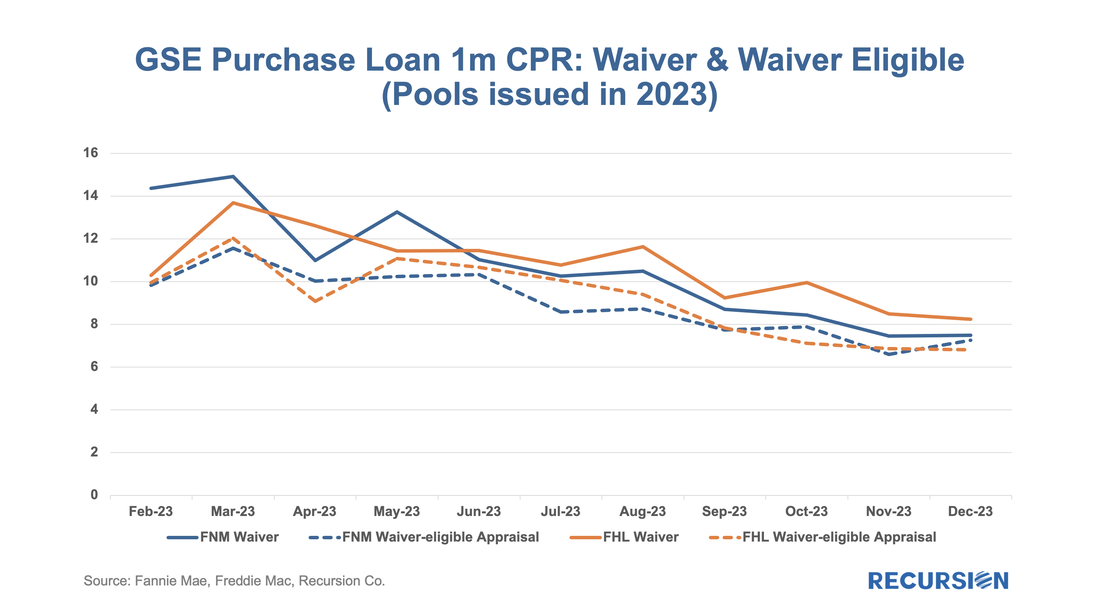 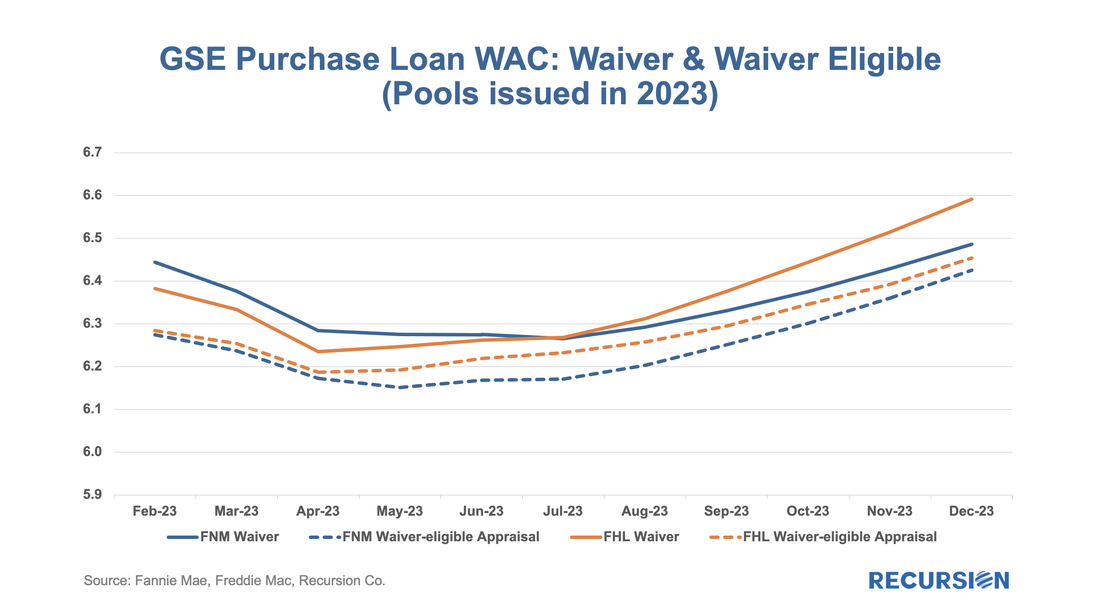 Those loans eligible for waivers but that obtain appraisals have lower loan rates and prepayment rates than loans with waivers, likely due to relatively reduced uncertainty surrounding valuation. Another key result that can be obtained from the chart is the more recent development whereby loans delivered to Freddie Mac with waivers have displayed persistently higher speeds than those delivered to Fannie Mae over the last six-month period. This corresponds with an increase in the pace of growth in FHL coupons compared to those of FNM over this period. It’s natural to ask if there are differences in loan characteristics that account for this gap. Below find the corresponding data for average credit scores across these categories: 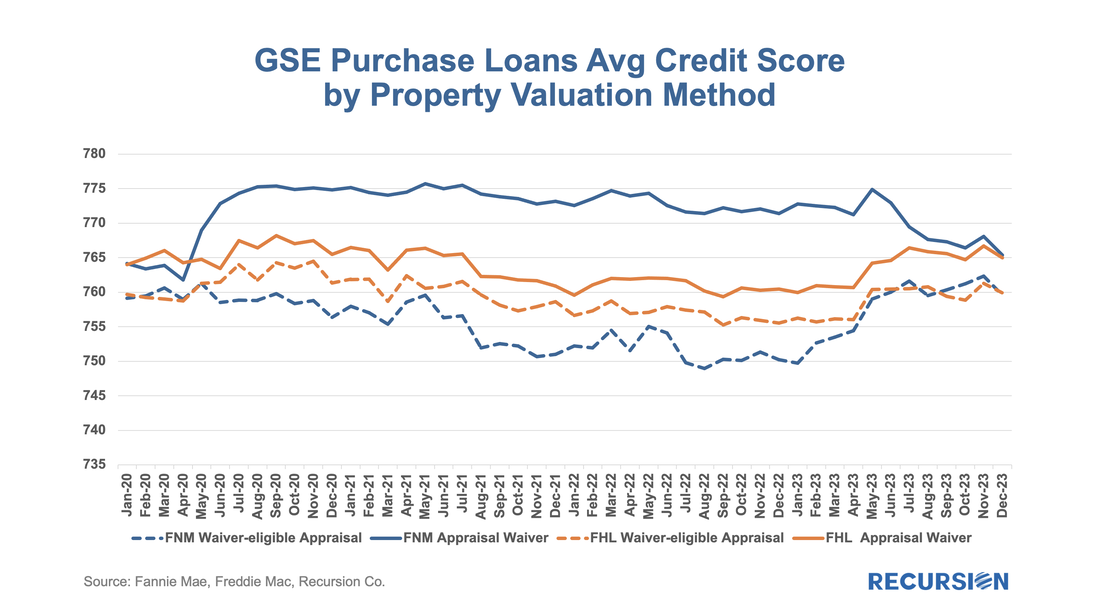 Over the past six months, FNM has loosened its credit standards for waivers as measured by credit scores relative to Freddie Mac. As this would tend to boost FNM coupons vs FHL, another explanation would seem to be required. We can speculate that FHL is discouraging waivers for its own risk-management purposes, but there is no verifiable support for this view. We can, however, see if this pattern persists in the newer appraisal types. 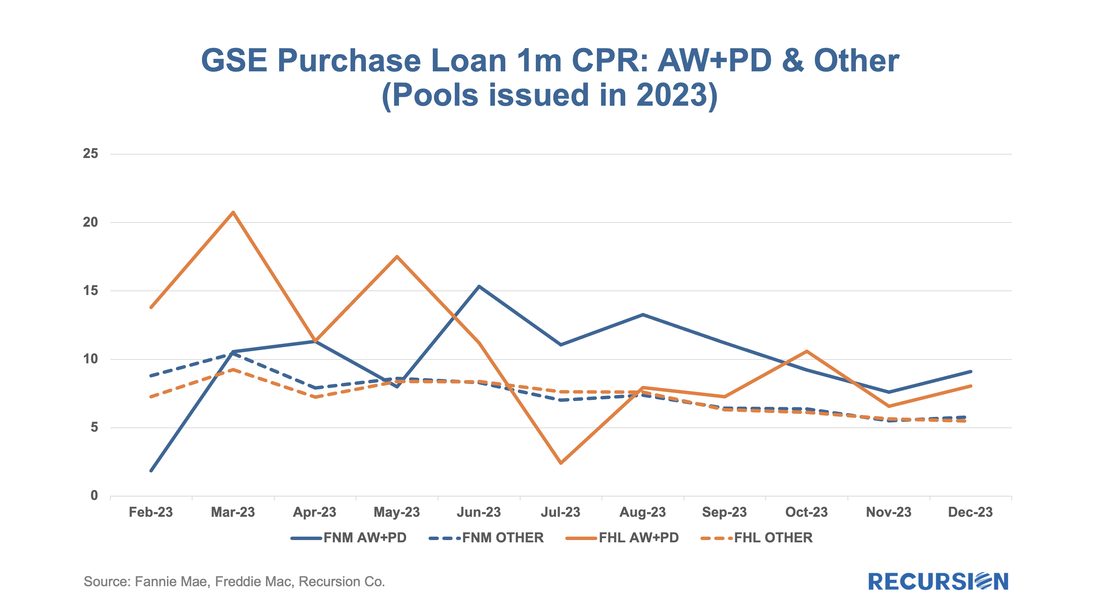 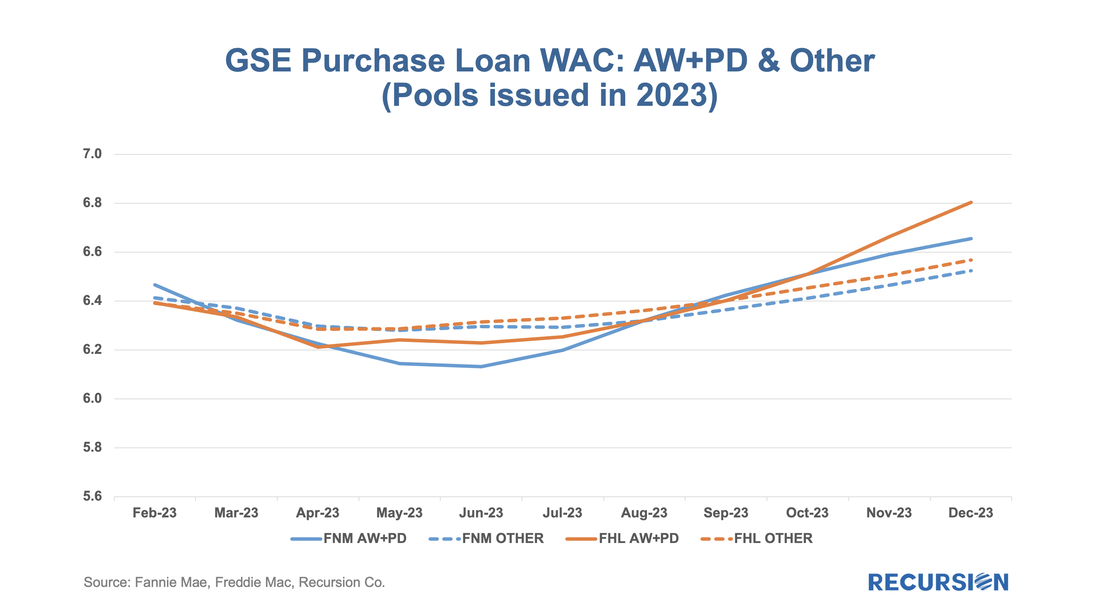 The loan counts here are quite small, so it is not surprising to see a noisy CPR chart for these categories. On the other hand, the trend increase in FHL AW+PD loans relative to those of Fannie Mae can be seen, although it is a more recent development in this case. Our conclusion is there is enough distinction here to say that modelers and traders ought to keep an eye on collateral risk as an independent factor in their decisions. Since the end of last year, the Government Sponsored Enterprises have released so-called “Social Score” Indexes that are made to appeal to ESG investors. Both Fannie Mae and Freddie Mac produce scores at the pool level based on a variety of social metrics. The following methodology summary comes from Fannie Mae[1] (Freddie Mac has adopted the same methodology as Fannie Mae’s):
With all eyes on the turmoil in the banking sector, it’s good to see that policymakers continue to innovate to help borrowers. Earlier this month, HUD published Mortgagee Letter 2023-06 “Establishment of the 40-Year Loan Modification Loss Mitigation Option”, which establishes the 40-year standalone Loan Modification into FHA’s COVID-19 Loss Mitigation policies[1]. The standalone 40-yr mod is scheduled to be implemented by May 8. This follows the establishment of a 40-yr modification with a partial claim in April 2022[2]. The introduction of standalone 40-yr mods reminded us that we haven’t focused on the progress of the 40-year mod with a partial claim identified by pool prefix “ET”. Below find a chart of issuance by program:
We’ve written before about curtailments, which are particularly interesting during times of rising interest rates when refinancings are at low levels[1]. We believe that investors and modelers would benefit from examining this aspect of borrower behavior. A good way to demonstrate this is to look at the home payment patterns of repeat homebuyers. In the recent environment of skyrocketing home prices, buyers of new homes have been confident about their ability to sell their current residence and have been more likely to purchase their new home before they pay off their old mortgage. If this story is true, we would expect to see significant curtailment activity within a few months of the purchase of a residence on the part of repeat buyers. In our previous note, we introduced the concept of a “Constant Curtailment Rate”, and implemented the calculation in Cohort Analyzer to quantify this effect: 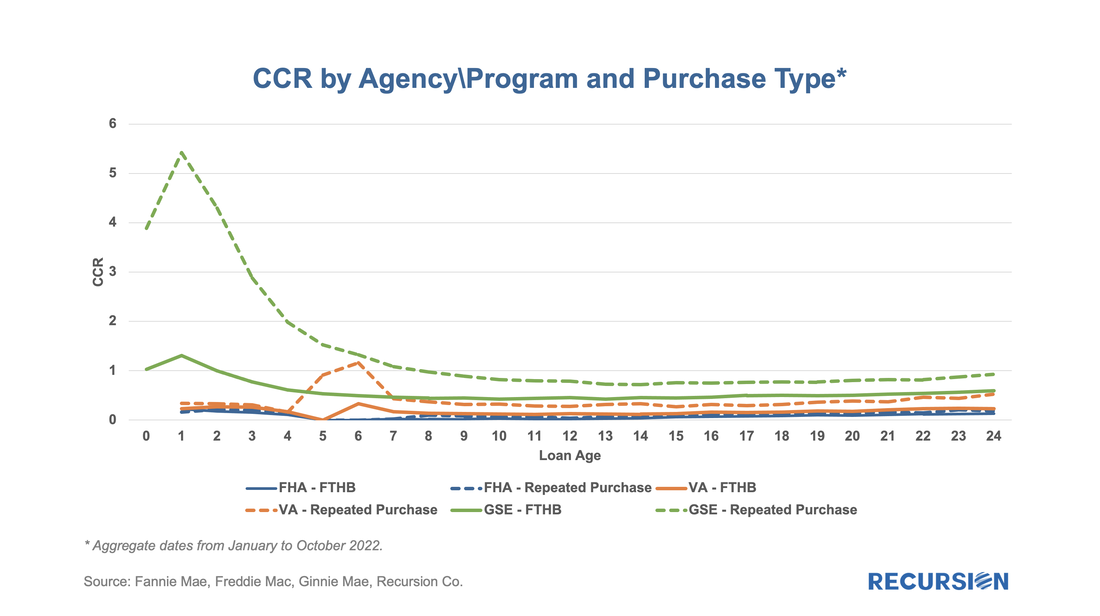 On May 5, 2022, Freddie Mac announced "that certain principal curtailments were previously not passed through on a timely basis to MBS securities holders[1]. The outstanding principal curtailments will be reflected in the May 2022 factors and passed through to the affected MBS securities with the May 2022 payment. The curtailments are associated with approximately 178,000 mortgages distributed across approximately 50,000 pools. As a result of this catch-up pass through of principal curtailments, the May 2022 factors will reflect an approximately 0.7% CPR increase in prepayment speeds for the related pools, in the aggregate." In addition, they attached a list of 1,102 pools where the curtailment amount was equal to or exceeded 5% of the UPB[2].
That's a remarkable statement for a variety of reasons, but at Recursion, our immediate response was to take this as an analytical challenge. Do we have the information and tools needed to reproduce Freddie Mac's estimate of a 0.7% CPR increase from this remediation? How to begin? As the payment was adjusted in May factors, it would have impacted April CPR. But how to back out curtailments? It's clear that this would have to be done at the loan level since there is not enough information at the pool level to compute a shortfall. Back in 2021, we wrote a comment on the properties of the GSE Special Eligibility Programs designed to provide lower income households with access to mortgages (HomeReady for Fannie Mae and Home Possible for Freddie Mac)[1]. Given the increasing policy focus on the provision of credit to these households[2], it is appropriate for investors to look at the investment opportunities in this area. In this note, we look at the performance of HomeReady/Home Possible Program loans (referred as Low-Income Program in the following) vs. non-special-eligibility program loans, as measured by one month CPR, controlling coupon and vintage. We focus on just two such cohorts, 1.5% and 2.0% coupon pools of 2021 vintage. By loan count, the share of Low-Income Program loans in these pools by agency for May 2022 is: 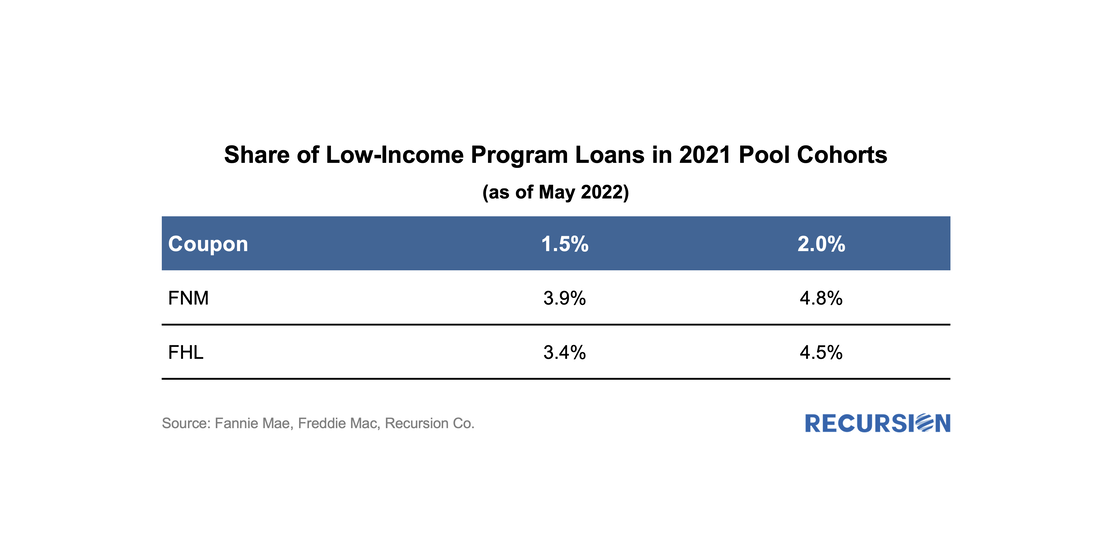 |
Archives
July 2024
Tags
All
|
 RSS Feed
RECURSION |
|

Copyright © 2022 Recursion, Co. All rights reserved.