|
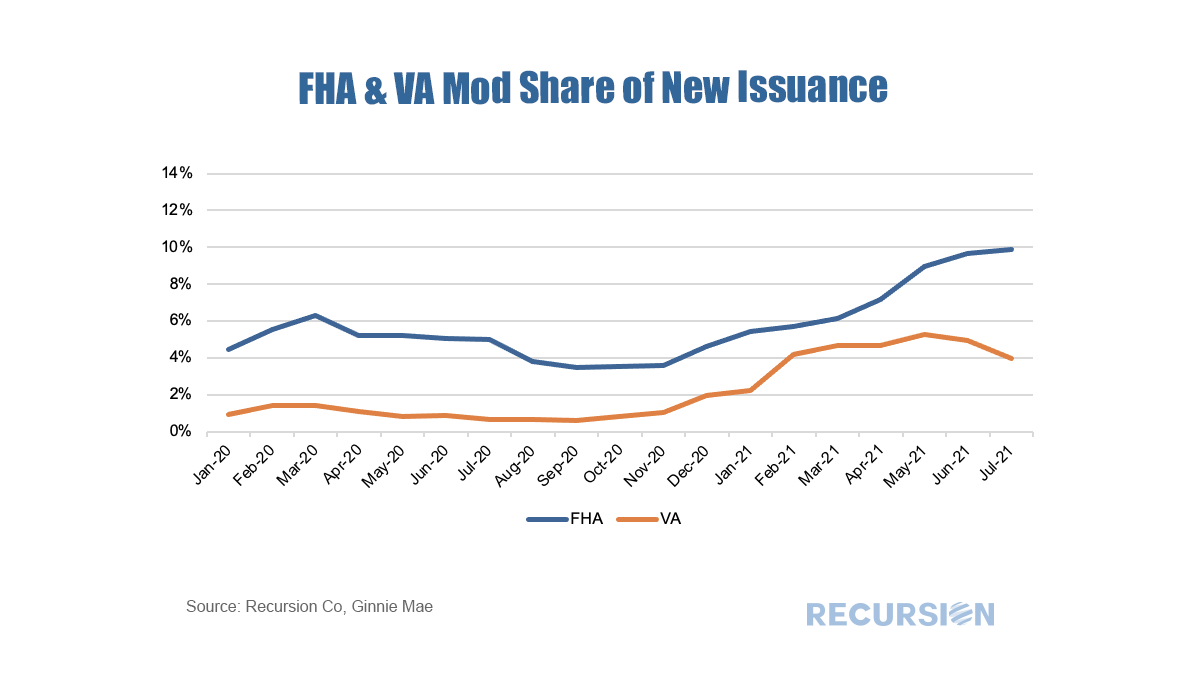
In an earlier post, we discussed the use of trial modifications as a leading indicator of buyouts, as loans in these programs must experience three months of successful payments prior to being eligible for a permanent mod[1]. On January 25, Fannie Mae announced that they had purchased certain loans out of pools prior to the completion of the necessary trial payments.[2] Then, on March 25, Fannie published a list of these securities, allowing us to quantify the impact of this event on the performance of their pools[3]. The spreadsheet attached to the March announcement contains over 17,800 entries dating back to February 2021 and states that the total unpaid balance bought out early amounted to over $4.5 billion. The point of this post is to assess the magnitude of this activity on Fannie Mae’s prepayment speeds. To address this question, we imported the data in the file released by Fannie Mae into our Recursion Pool Analyzer. As a first step, we look at the impact of these purchases on CDR’s as the activity was clearly involuntary. 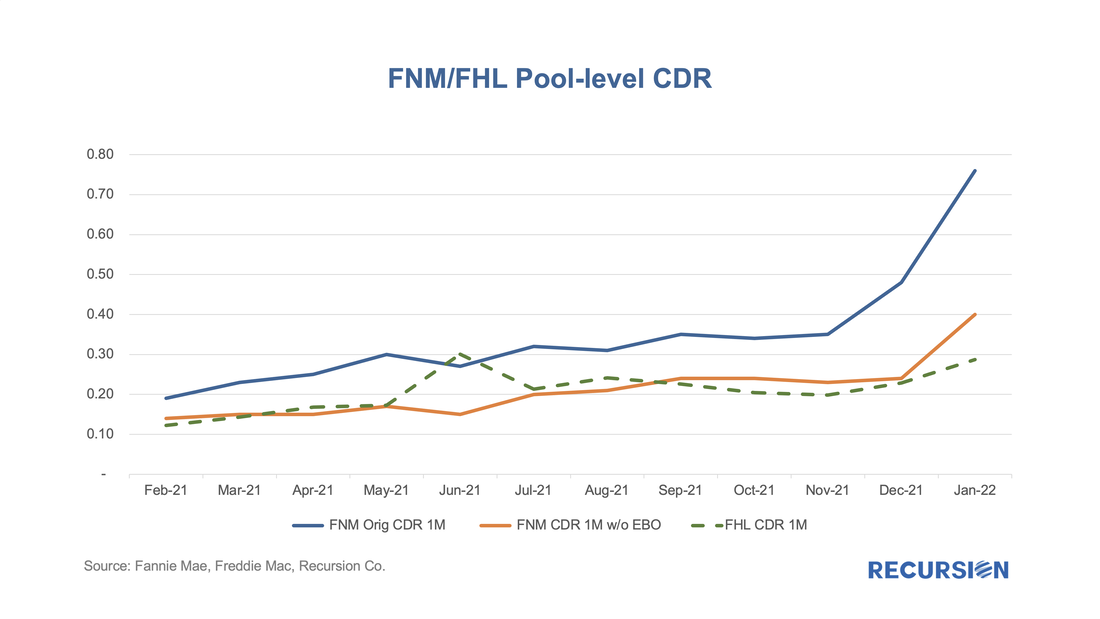 With the expiration of forbearance programs underway, there is an interesting question about how loans exiting these programs will perform once they are resecuritized. For Ginnie Mae programs, these are either loans that exit forbearance with a partial claim or receive a permanent mod under the various waterfall options in the FHA or VA programs. In our previous blogs[1], we have noted MOD and RG loans are becoming a significant portion of loans delivered to newly issued Ginnie Mae pools. 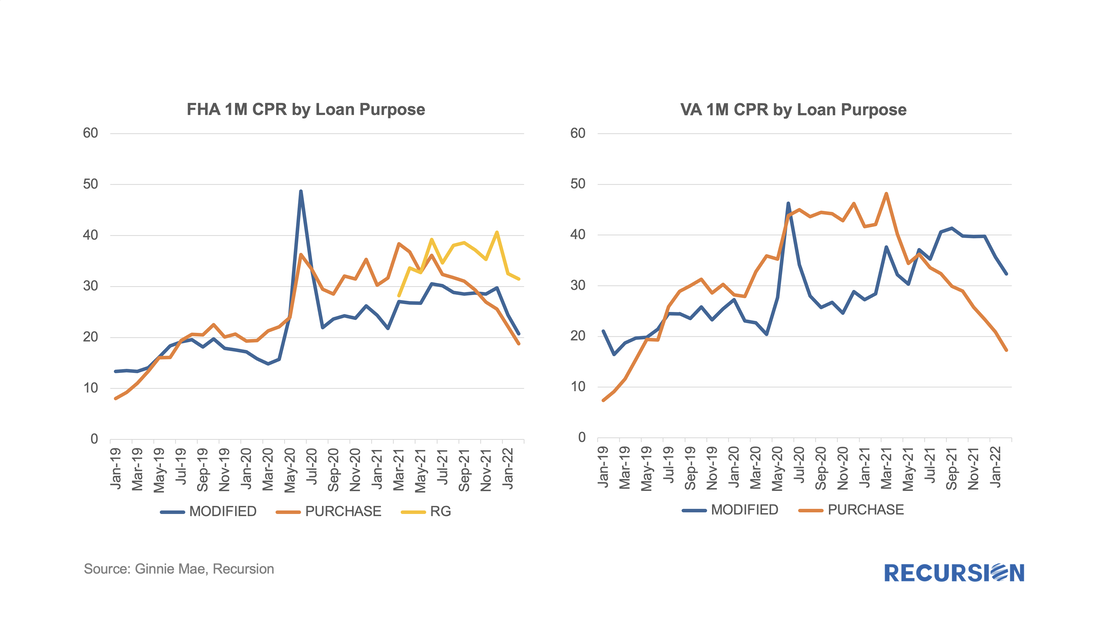 Over the past six months, prepayment speeds of Ginnie Mae securities have notably widened against those of the GSEs. 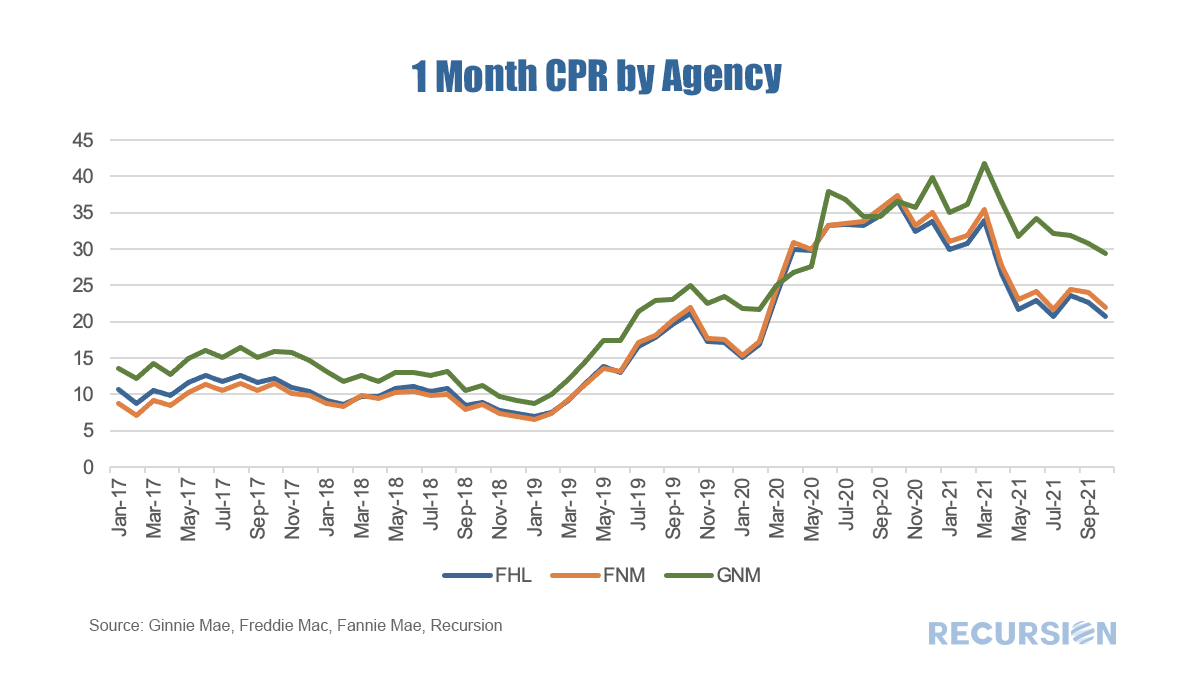 One of the many recurring themes of these posts is that the shock of the Covid-19 Pandemic and subsequent policy response has resulted in structural changes in behavior that cause loan performance metrics to shift compared to the pre-crisis world. An interesting example of this can be found in the performance of modified loans in Ginnie Mae programs. Modified loans in these programs are those that have been purchased out of pools by servicers that are past due that subsequently have features such as rate and term adjusted in order to bring households back to a current status. These are then often resecuritized into a new GNM pool.
 Our proprietary matching algorithm continues to chug along and our match rates between the Agency loan tapes and HMDA continue to improve. Here is an up-to-date summary table: 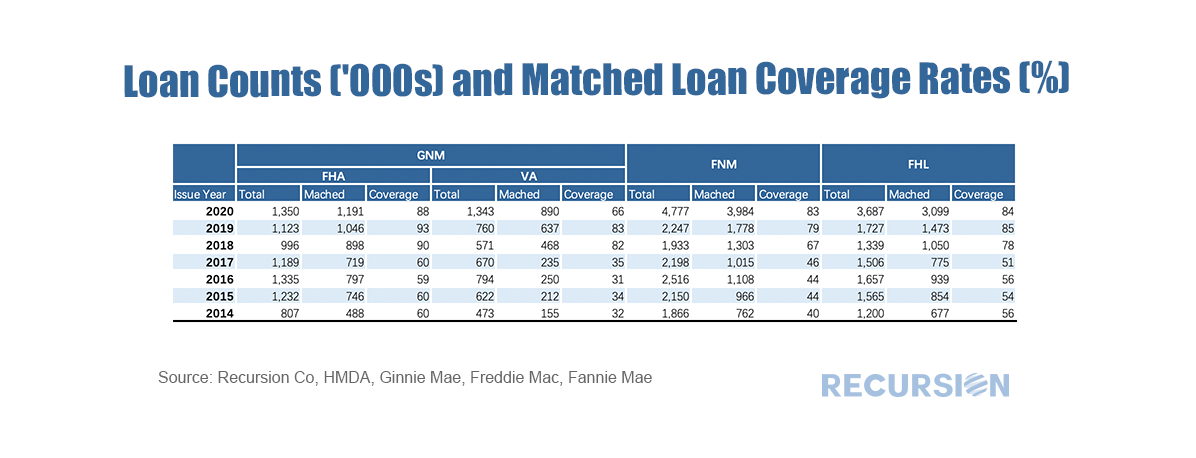 We received the monthly GSE data download for the June book of business over the weekend and prepayment speeds dropped for the second consecutive month, with the 1-month CPR printed 22.4, the low posted since 17.1% was reached in February 2020 just before the onset of the pandemic. 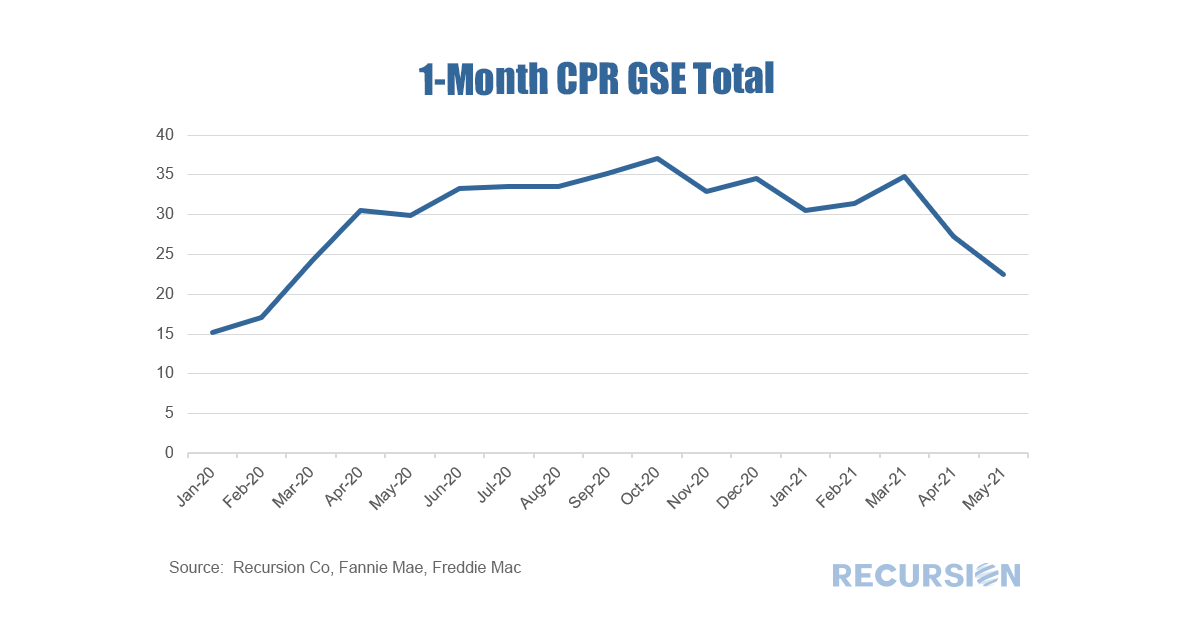 Mortgage rates are of course the key driver here, but other issues matter as well, notably lending capacity. With the onset of the pandemic and the associated loosening of monetary policy and spike in demand for housing away from dense locations, the mortgage industry became overwhelmed. Originators were busy hiring and increased their capacity over the past 18 month to deal with the long period of refinancing activity. However, as prepayment speeds slow down, it appears that the capacity building may be overshooting. In response, originators have started to lower their underwriting standards to create enough volume to fully utilize the capacity. 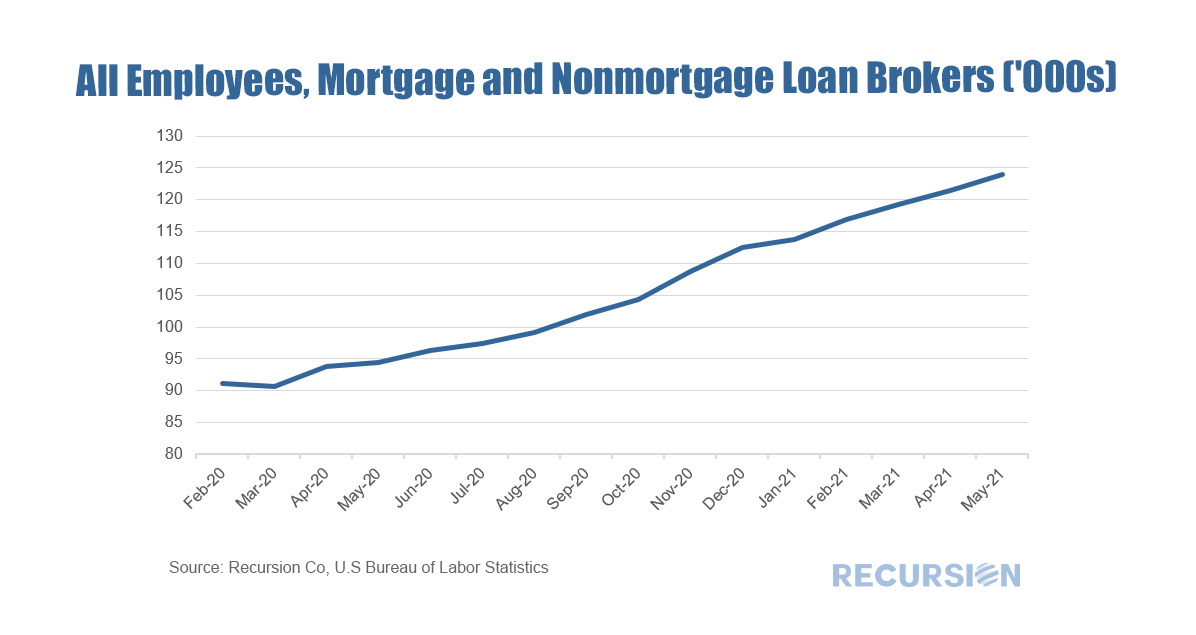 Traditionally, the industry fine-tunes its production through tweaking its credit standards to keep its pipeline as full as possible. This is occurring now notably for refinance mortgages: 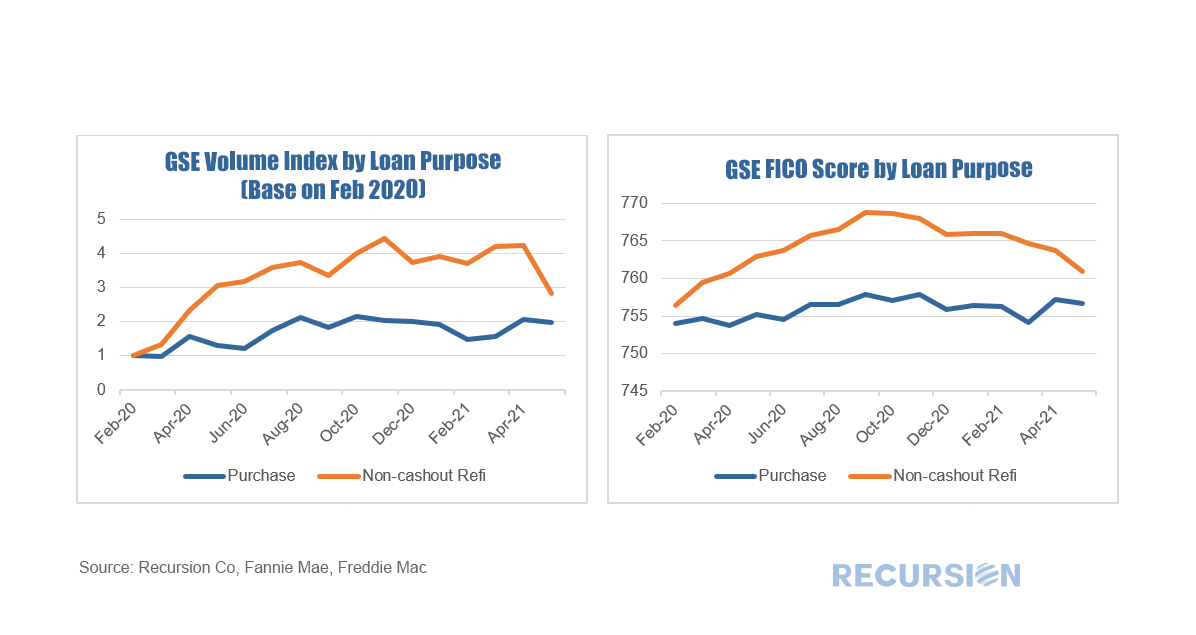 What we can see is that purchase demand remains strong, with the swing product being refinance mortgages. It is evident that lenders are trying to smooth out refinance production with countercyclical credit tightening and loosening. As credit scores are higher than was the case in the pre-pandemic period there is room to ease further, but the ultimate extent is highly uncertain.
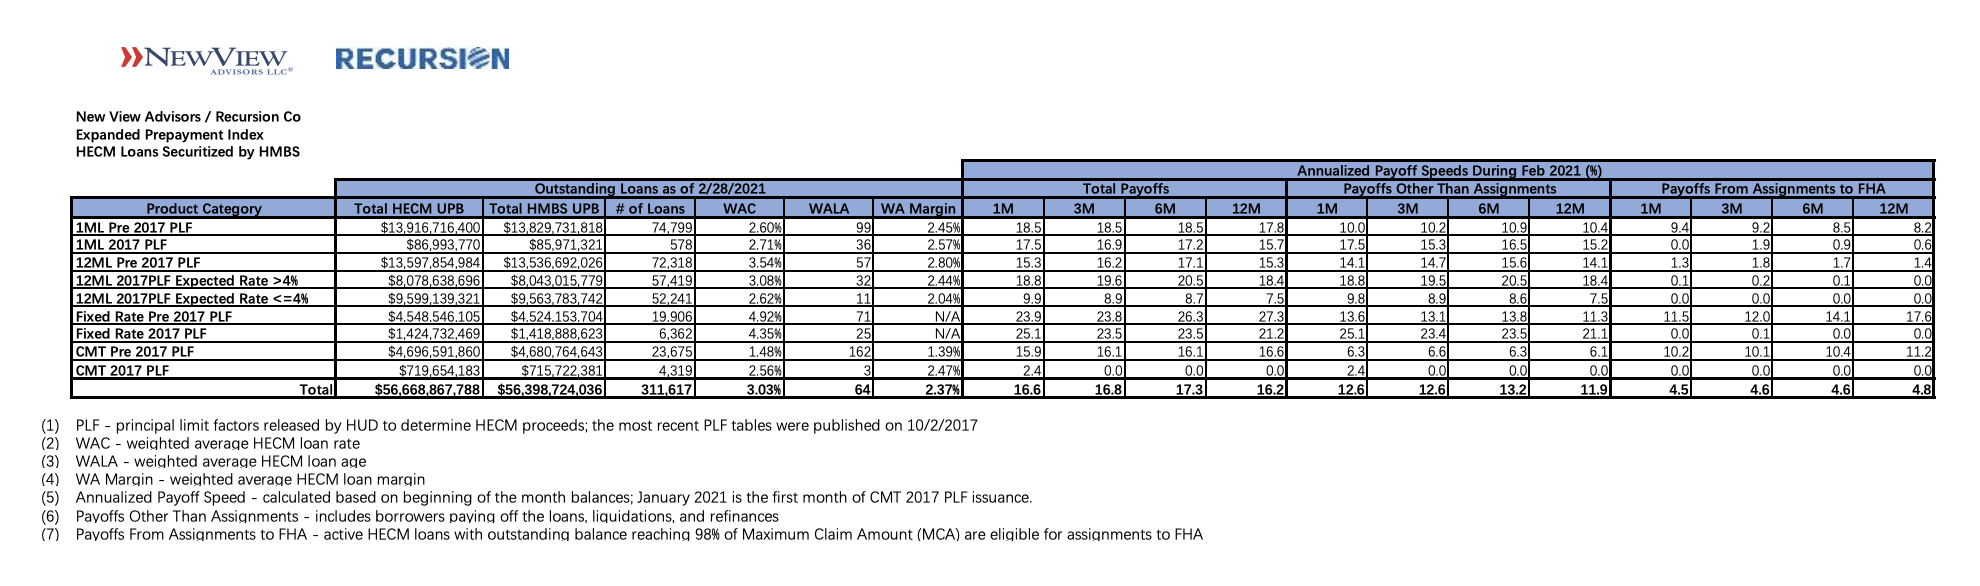 Recursion and New View Advisors February 2021 expanded HECM reverse mortgage prepayment indices can be found here: New View Advisors Recursion Cohort Speeds 02_2021. The indices are derived from underlying HECM data in HMBS made public by Ginnie Mae, as well as private sources. This new expanded set of prepayment data is calculated using dollar principal balance, not unit count.
The enhanced data set shows current trends in prepayment activity by product type and Principal Limit Factors (PLFs), and for current 12-month LIBOR PLFs by Expected Rate. HECM loans with higher Expected Rates originated in the year or so prior to the precipitous fall in interest rates brought on by the pandemic are experiencing higher prepayment rates. Therefore, we segregate indices for recent production 12-month LIBOR PLFs into Expected Rates greater than 4% and Expected Rates less than or equal to 4%. Prepayment speeds are expressed as annualized percentages in three categories: Total Payoffs, Payoffs Other Than Assignments, and Payoffs from Assignment. For each category, we calculate the 1-month, 3-month, 6-month and 12-month CPR, or annual rate of prepayment. For HMBS pools backed by adjustable rate HECMs using the Constant Maturity Treasury (CMT) index, prepayment speeds will begin to populate as more of these HMBS are issued. Just under $300 million of CMT HMBS are currently outstanding: other than some highly seasoned tail pools, none have been outstanding more than one month. Please contact us if you’re interested in customized stratification of HECM prepayment speeds by vintage, Expected Rate, Weighted Average Loan Age, or other tailored output. Debtwire cites Recursion Data within article on LoanDepot’s massive Ginnie Mae EBO activities3/17/2021
Debtwire quotes Recursion data showing a large uptick in LoanDepot’s Ginnie Mae portfolio over the month of February. In early reporting for March 2021, LoanDepot’s involuntary prepayment speed, or 1-month CDR, reached 20.6 percent. 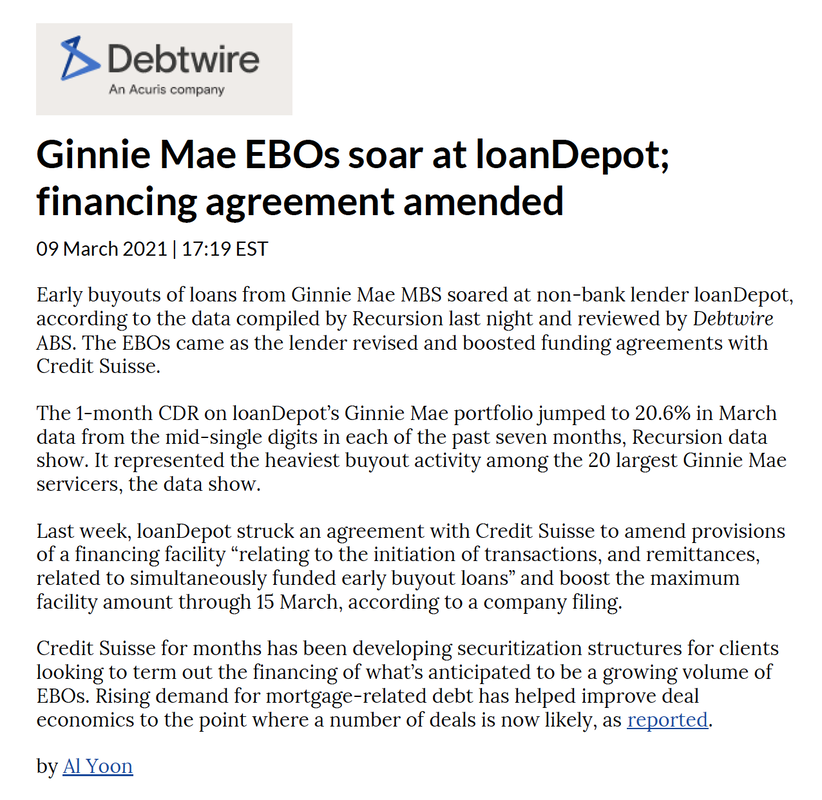 |
Archives
February 2024
Tags
All
|
 RSS Feed
RECURSION |
|

Copyright © 2022 Recursion, Co. All rights reserved.