|
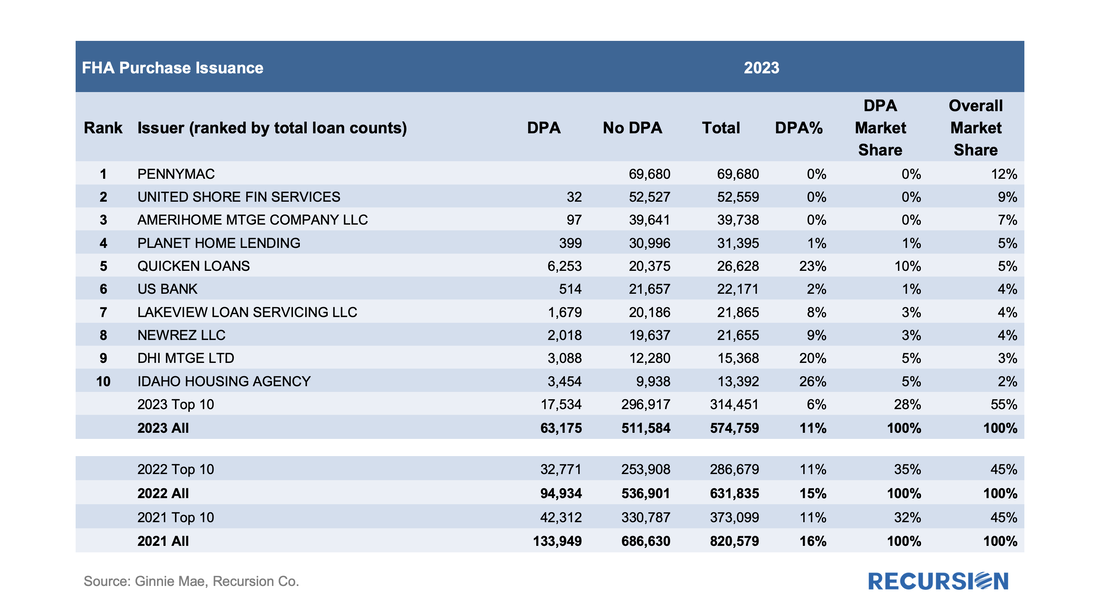
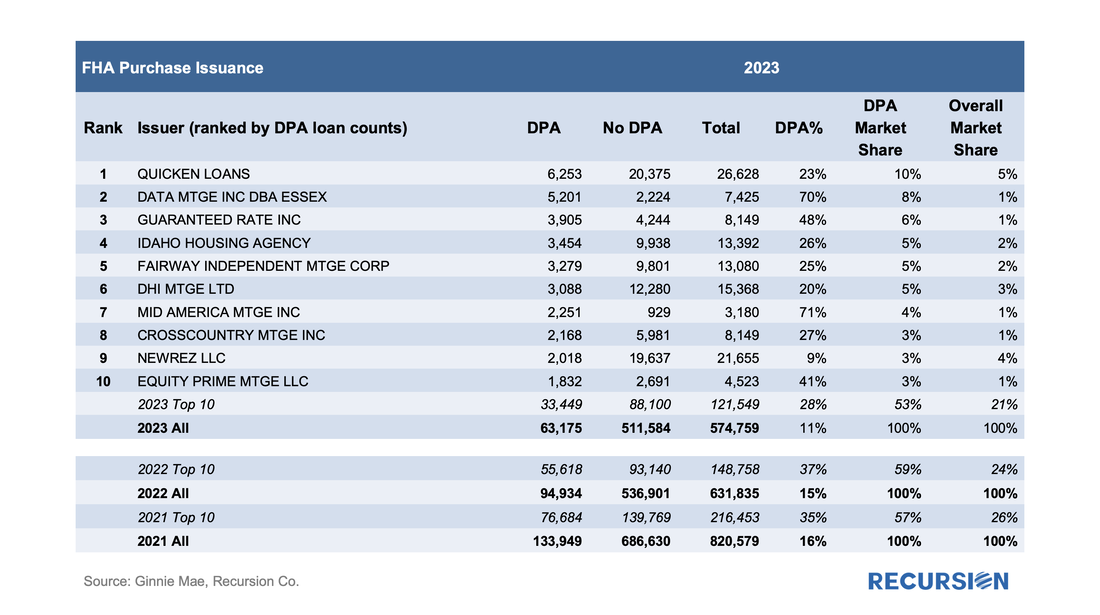
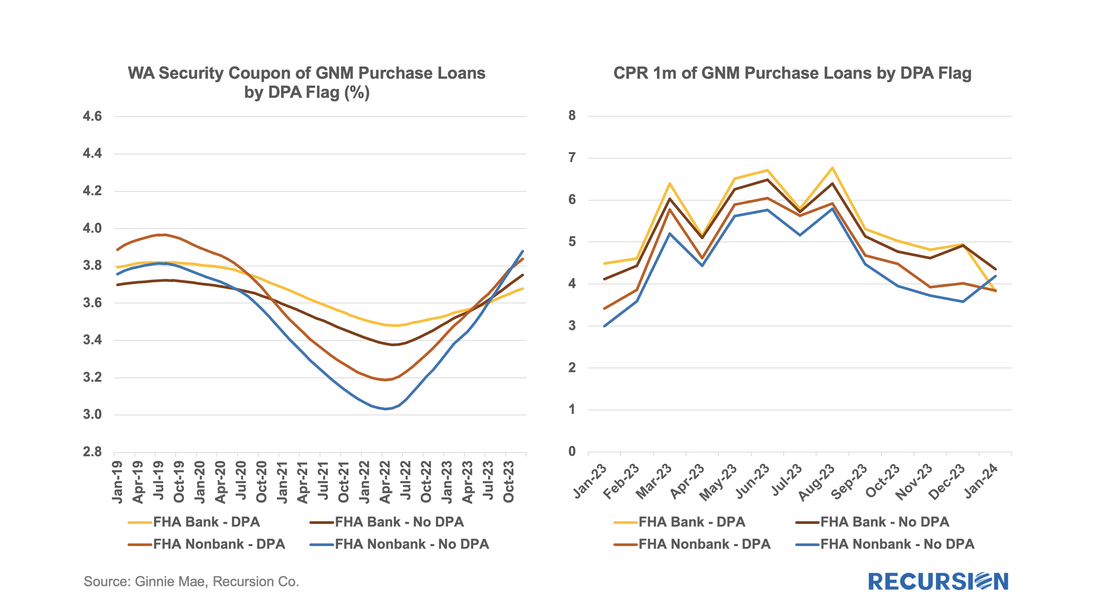
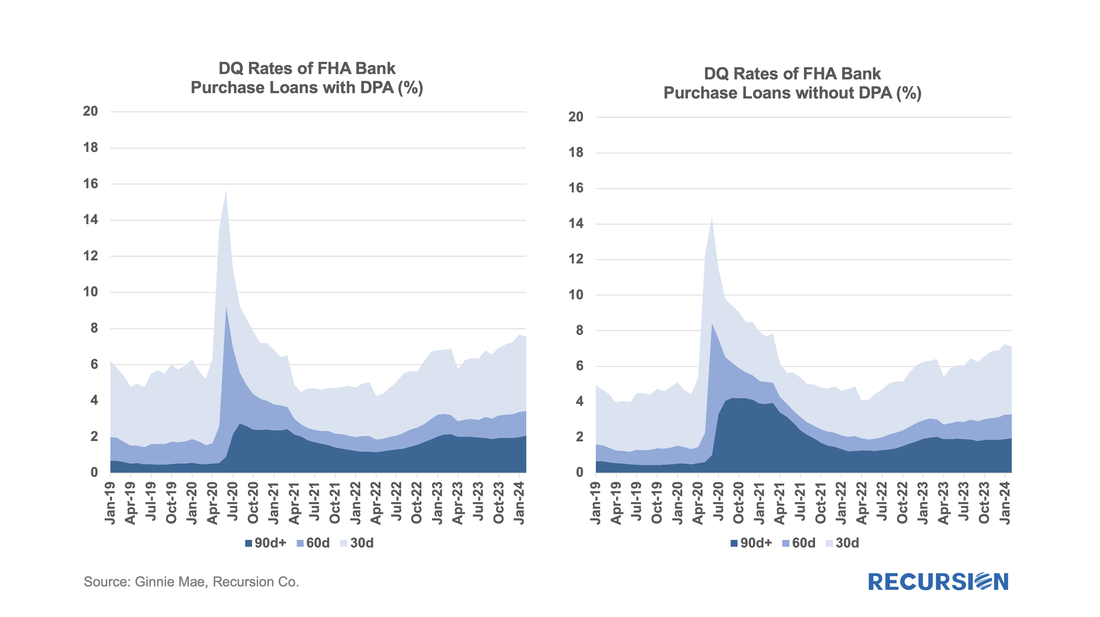
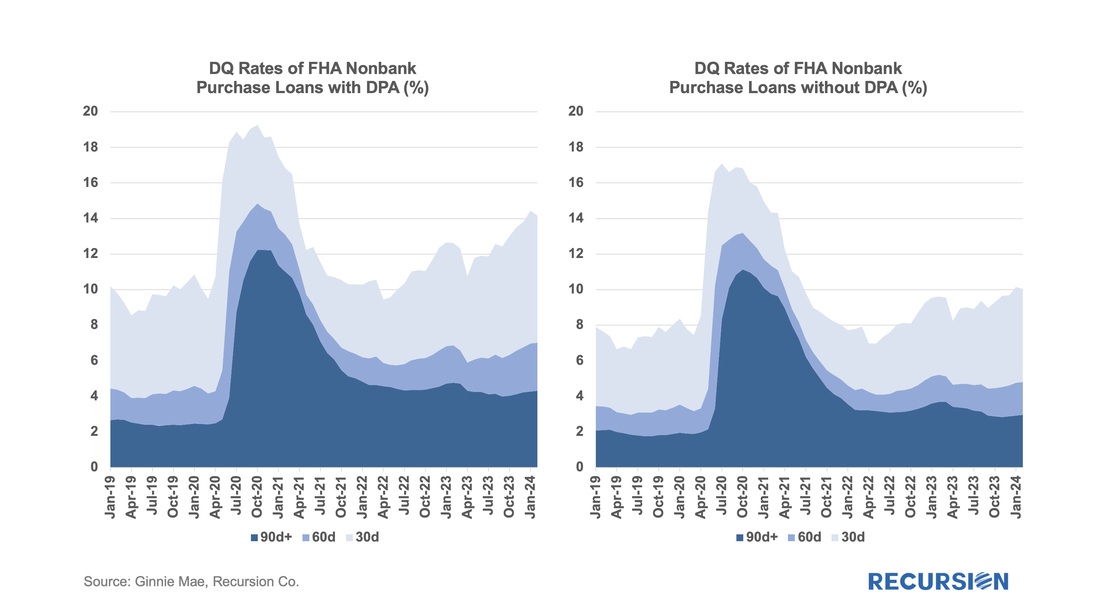
In a recent post, we reviewed the market for mortgages with down payment assistance features[1]. We noted that our loan-level data for FHA showed a rate that was about half of that reported by the FHA Portfolio Snapshot database. Since the agency disclosures are at the loan level, we use this dataset to do a deep dive into which servicers are most active with this product and what loan performance looks like across institutions. Unlike the previous note, which covered all deliveries, here we focus on the market for new purchase mortgages. Below find a table of the DPA usage for the top ten FHA purchase mortgage issuers in 2023, along with summary statistics for 2022 and 2021: The biggest issuers in total constituted a smaller share of DPA usage in 2023 compared to the prior two years, implying more diversified use of DPAs recently. Here is the same table but ranked by purchase loans with DPAs: Similar to the prior table, the concentration of FHA purchase loans with DPAs declined in 2023 (28%) vs 2022 (37%) and 2021 (35%). It seems a shrinking market incentivizes issuers to roll out new products to maintain volumes. Now we turn to loan performance, starting with prepayments. We break the market down between banks and nonbanks, and loans with DPAs and those without: During the market boom of 2021, nonbanks became hyper-competitive in purchase mortgage lending compared to banks, implying lower prepayment speeds. This behavior has receded during the recent market weakness, and speeds have aligned across categories. The period of booming transactions for nonbanks in 2021 and 2022 carries with it some consequences: DQs for FHA purchase loans by bank are very similar between loans with DPAs and those without, while for nonbanks, loans with DPAs are generally underperforming those without. It appears that underwriting standards for loans with DPAs by nonbanks deteriorated during the boom market. We will follow up DPA research for the GSE mortgages in the next article. |
Archives
July 2024
Tags
All
|
RECURSION |
|
Copyright © 2022 Recursion, Co. All rights reserved.

 RSS Feed
