|
We’ve noticed that the prevalence of appraisal waivers for purchase mortgages within the eligible population peaked in Q4 last year, and recently has gone into steep decline. Our working thesis as to what is behind this trend is that lenders are getting concerned about the rapid pace of home price increases and want the additional security associated with an on-site appraisal. If this is indeed the case, we should see a greater decline in this share for larger mortgages than for smaller ones. So we break up the universe by GSE, and by loans above and below 2021’s conforming loan limit of $548,250: 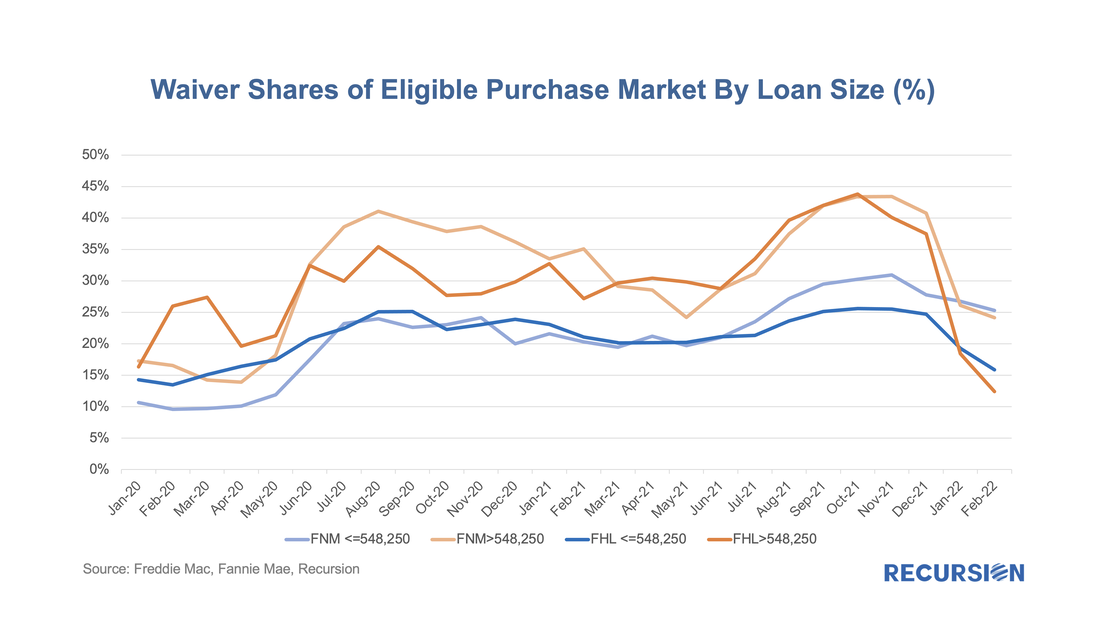 In a recent note, we pointed out how a measure of the success of the Unified Mortgage Backed Securities (UMBS) project was the narrowing in the CMO Lockup Rate between Freddie Mac and Fannie Mae[1]. For many years, Fannie Mae benefitted from the liquidity advantage its security maintained compared to that of Freddie Mac, based on its long-standing market leadership position. To compensate, Freddie Mac locked up more of its securities in CMO’s, in an effort to create a supply-constrained premium in its own securities. The degree of success achieved using this strategy could be measured in terms of changes in the “Traditional Share”. “Traditional Share” is a terminology widely used within Fannie and Freddie, that measures the market share held by Fannie Mae compared to its smaller rival. For example, the Traditional Share of 60, means loans guaranteed by Fannie Mae contribute to 60% of the GSE book, while those guaranteed by Freddie Mac contribute 40%. For the purposes of this note we will measure this in terms of loan count for purchase mortgages only. In 2014, FHFA announced the establishment of a new securitization infrastructure[2] for all mortgage loans backed by single family residences into a new common security. Historically, the Traditional Share had stood at about 60%, but at that time it had risen to over 70%, putting Freddie Mac into a dire situation. With that announcement, the share started to decline, and by the time the UMBS was launched in 2019 the share had eased back towards the 60% level. As a result, Freddie Mac faced reduced pressure to lock its securities up in CMOs, and the gap between this activity and that of Fannie Mae was about halved over the 2014-2019 time frame. Subsequently, the question was whether investors would maintain an indifferent posture between the delivery of Fannie Mae and Freddie Mac UMBS. Lingering fears about the possibility of so-called specified trades faded along with narrowing performance differences between the two agencies, and in recent months the Lockup Gap has almost disappeared. This was recently met with a significant plunge of 8.6% in the Traditional Share in Q3 2021 to a record-low 47.4%. 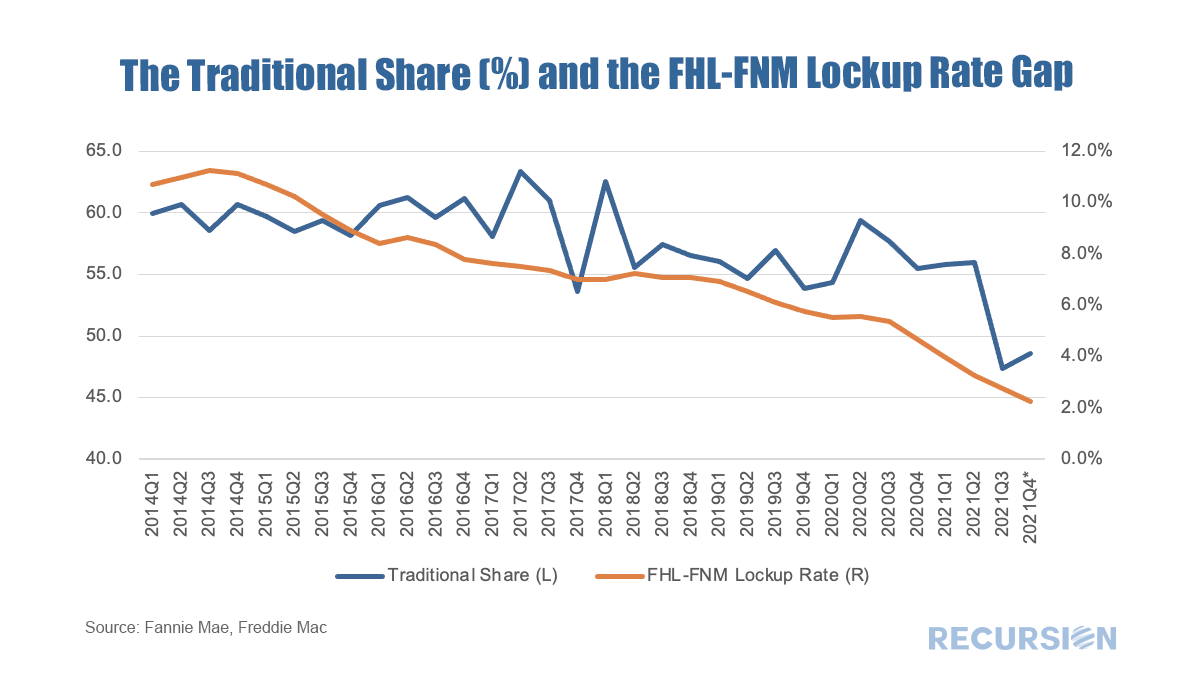 As we mentioned in our previous blogs, Recursion’s proprietary tools Cohort Analyzer, and Pool Level Analyzer can analyze FED and CMO portfolios recursively down to the “simple pool” level. There are a wide range of applications of these powerful tools. We previously demonstrated how to calculate FED portfolio and CMO lockup rates at the macro level. Another important application is to study the collateral of mortgage bonds directly at the loan level in order to support investor’s trading decisions.  To read the full article, please send an email to [email protected]
In a recent post[1], we discussed using Recursion’s proprietary tools to unravel the Federal Reserve’s MBS holdings of Fannie Mae and Freddie Mac loans. The Fed’s holdings, however, are part of a bigger picture issue regarding the notion of “float” in the MBS market, that is, the amount of securities outstanding that are available to trade. The holdings of the central bank serve to reduce the float as the Fed is a buy-and-hold investor. These loans are said to be “locked up”. Besides the Fed, loans can be locked up in structured products, notably Collateralized Mortgage Obligations (CMOs). The first CMOs were launched by Freddie Mac as Real Estate Mortgage Investment Conduits (REMICs) in 1988 and allow cash flows to be tranched to meet the needs of different investors[2]. Pools in CMOs’ collateral groups are also locked up. 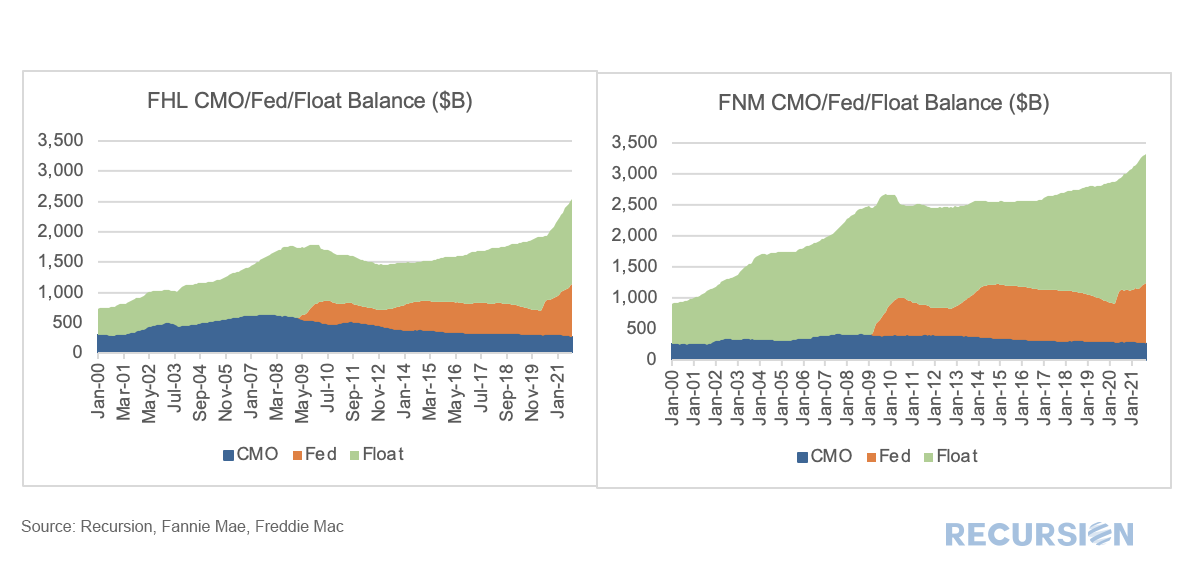 To read the full article, please send an email to [email protected] With talk of taper at the top of the monetary policy discussion, it is worthwhile to dig a bit into the role of the Federal Reserve in the functioning of the MBS market. As is well known, the onset of the Covid-19 pandemic resulted in a resurgence of central bank purchases of Agency mortgage-backed securities (MBS). Chart 1 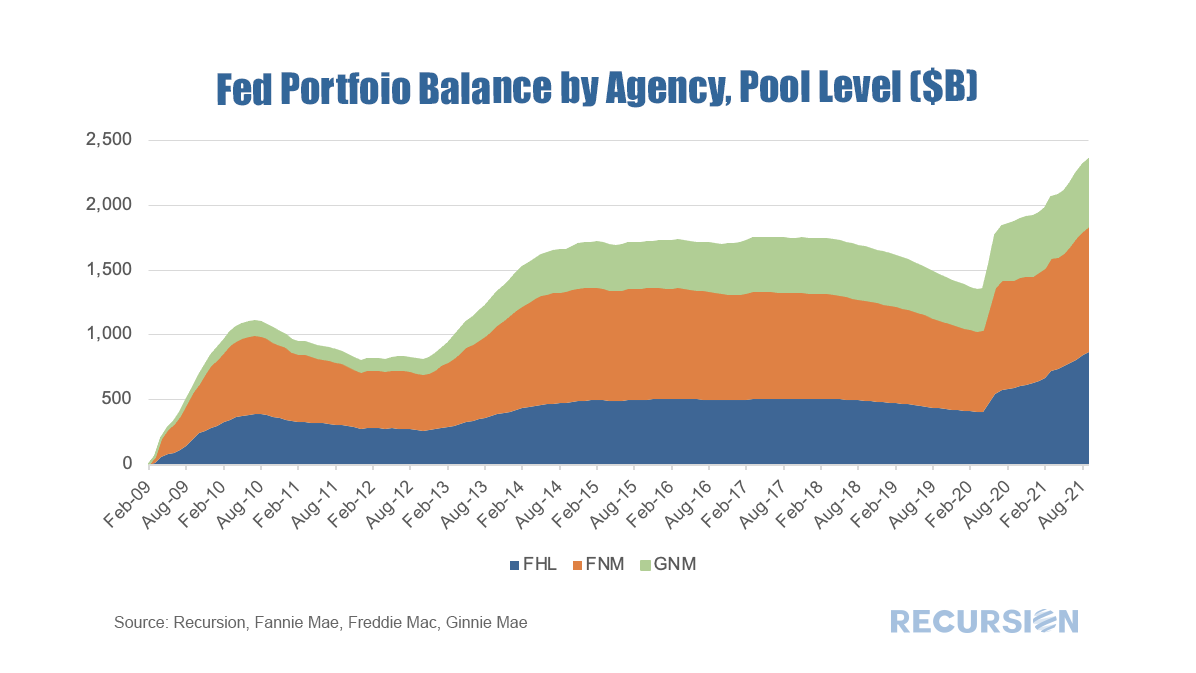 |
Archives
July 2024
Tags
All
|
 RSS Feed
RECURSION |
|

Copyright © 2022 Recursion, Co. All rights reserved.