|
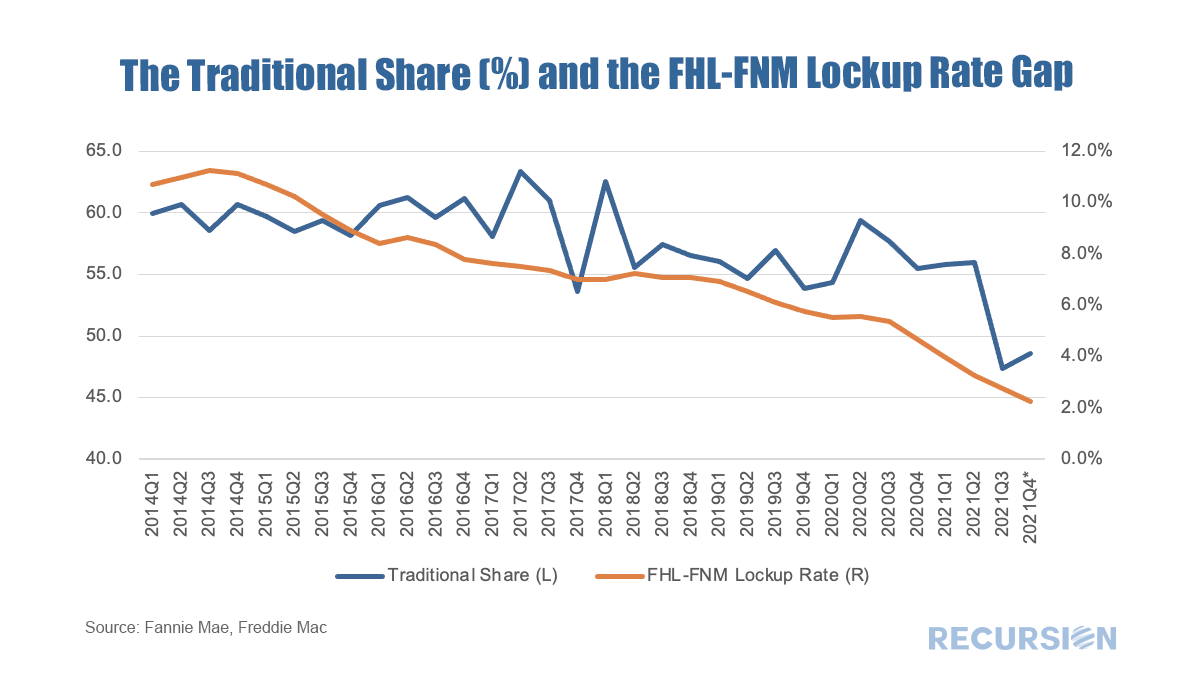
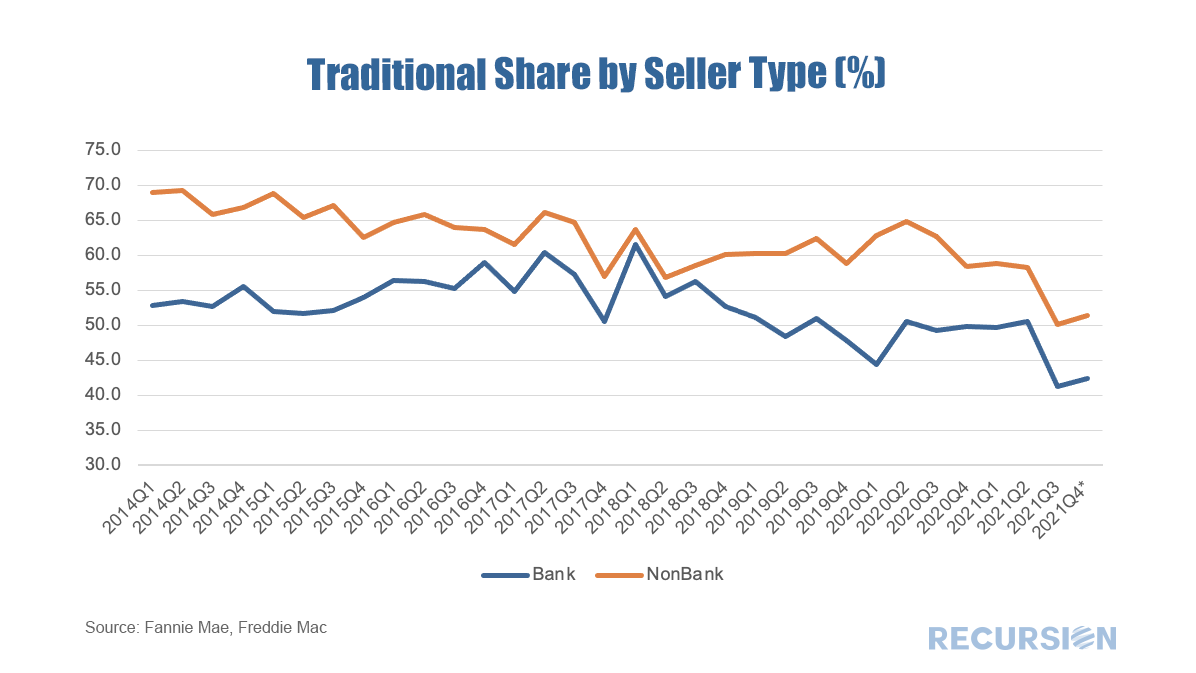
In a recent note, we pointed out how a measure of the success of the Unified Mortgage Backed Securities (UMBS) project was the narrowing in the CMO Lockup Rate between Freddie Mac and Fannie Mae[1]. For many years, Fannie Mae benefitted from the liquidity advantage its security maintained compared to that of Freddie Mac, based on its long-standing market leadership position. To compensate, Freddie Mac locked up more of its securities in CMO’s, in an effort to create a supply-constrained premium in its own securities. The degree of success achieved using this strategy could be measured in terms of changes in the “Traditional Share”. “Traditional Share” is a terminology widely used within Fannie and Freddie, that measures the market share held by Fannie Mae compared to its smaller rival. For example, the Traditional Share of 60, means loans guaranteed by Fannie Mae contribute to 60% of the GSE book, while those guaranteed by Freddie Mac contribute 40%. For the purposes of this note we will measure this in terms of loan count for purchase mortgages only. In 2014, FHFA announced the establishment of a new securitization infrastructure[2] for all mortgage loans backed by single family residences into a new common security. Historically, the Traditional Share had stood at about 60%, but at that time it had risen to over 70%, putting Freddie Mac into a dire situation. With that announcement, the share started to decline, and by the time the UMBS was launched in 2019 the share had eased back towards the 60% level. As a result, Freddie Mac faced reduced pressure to lock its securities up in CMOs, and the gap between this activity and that of Fannie Mae was about halved over the 2014-2019 time frame. Subsequently, the question was whether investors would maintain an indifferent posture between the delivery of Fannie Mae and Freddie Mac UMBS. Lingering fears about the possibility of so-called specified trades faded along with narrowing performance differences between the two agencies, and in recent months the Lockup Gap has almost disappeared. This was recently met with a significant plunge of 8.6% in the Traditional Share in Q3 2021 to a record-low 47.4%. Having a one-factor model of the Traditional Share runs the risk of seeming simplistic given the complex underlying dynamics of the relationship between the two GSE’s. Notably, on a micro level, the share could reflect changes in relationships between the Enterprises and their lending customers. A quick way to assess this is to break the share down between banks and nonbanks as the differing business models between the two groups offer a basis for a natural experiment in terms of analyzing the impact of the introduction of the UMBS. While there are certainly differences between the two lines, a common characteristic is a sharp decline between Q2 and Q3 for both banks and nonbanks of over 8%, suggesting a common factor rather than idiosyncratic individual firm behavior. The success of the UMBS program is one more factor that looks to persist in coming years. The new normal might well be characterized by a 50-50 Traditional Share. |
Archives
July 2024
Tags
All
|
RECURSION |
|
Copyright © 2022 Recursion, Co. All rights reserved.


 RSS Feed
