|
While the Fed has clearly been the dominant player in the MBS market for the last 13 ½ years, the consistent biggest holders of MBS have been the banks. When the Federal Reserve launched its QE program in late 2008, banks held about 16% of the outstanding balance at the time, and that share has more than doubled as of Q1 2022 to stand at about one-third of the total. In a recent blog, we dug into the details behind international investor behavior with an ancillary dataset[1], for the banks, we look for guidance from the Call Reports[2]. The Call Reports provide details on portfolio holdings of individual banks across financial asset categories (e.g., equities and bonds) for both loans and securities. For the purposes of this note, we just look at securities. What makes bank behavior so challenging to assess is that various types of policy actions have profound impacts on their investment decisions. To begin, we look at the share of residential agency MBS out of total bank assets, including both pass-through securities and CMOs: 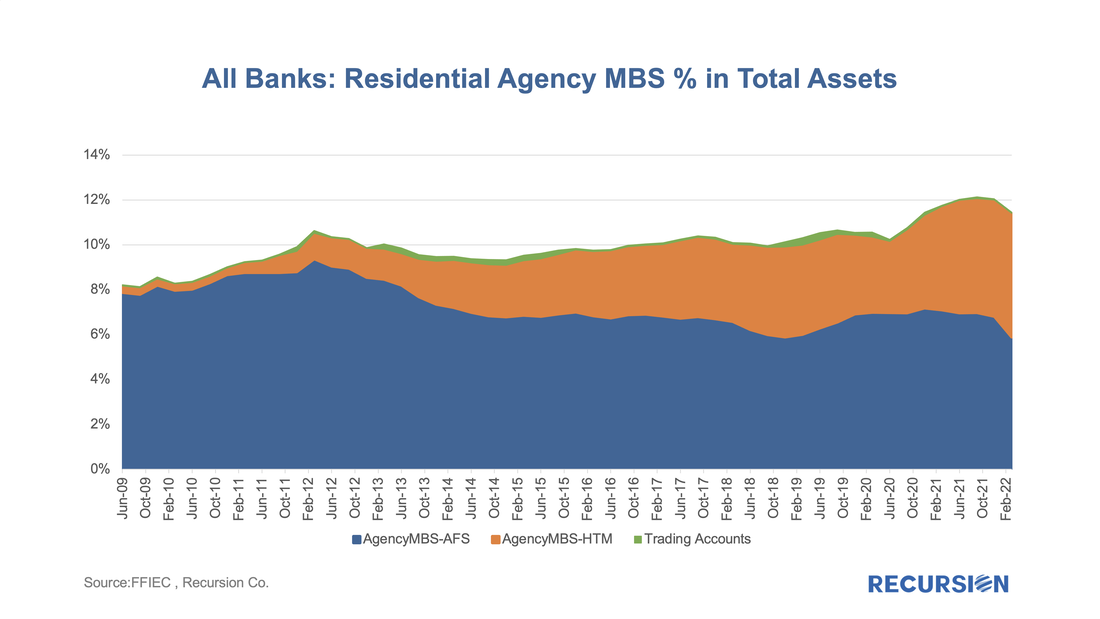 In a recent post, we discussed the utility of secondary market indicators to track the progression of loans that are coming out of forbearance in Government programs[1]. This short note looks at this progression in the conforming loan market. For the Ginnie Mae programs, issuers may buy loans out of pools after they are delinquent more than 90 days and begin a workout process that culminates in one of the options, including loan modification. The situation is quite a bit different for Fannie Mae and Freddie Mac. The main distinction is that on January 1, 2021, the GSEs extended their timeline for buying loans out of pools to 24 consecutive months of missed payments[2]. As the Covid-19 pandemic began in March 2020, we expect to see buyouts being extended as much as to April and May this year. However, we can obtain a view on future loan modifications through the trial mod flag in the borrower assistance plan field in the monthly disclosures the GSEs started to release in March, 2021. In order to obtain a permanent modification, borrowers must first successfully complete a three-month trial modification plan[3]. Below find the progression in the number of loans in such plans since March 2021: 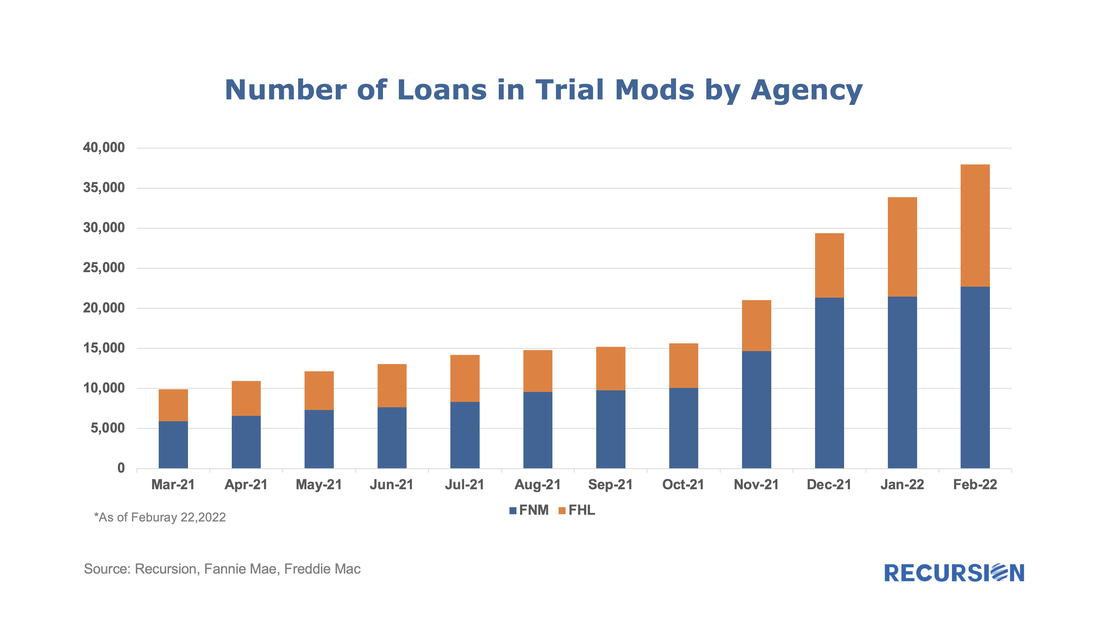 In a fine recent paper, the Federal Reserve Bank of Philadelphia “highlights the immediacy of the challenges facing mortgage servicers and policymakers” that arise from the resolution of mortgage forbearance and delinquencies[1]. As of the time of writing, the Philly Fed stated that “some 2.73 million mortgages are either in forbearance or past due; about 0.78 million of those are in Coronavirus Aid, Relief, and Economic Security (CARES) Act forbearance plans”. In addition, “about 47 percent of loans in forbearance will expire in the first quarter of 2022; another 42 percent will expire in the second quarter”. They go on to discuss recent trends and provide data on income and demographics of these borrowers.
The point of this brief article is to look at secondary market indicators to shed additional light on these issues. The note is broken into two parts, the first looks at Government programs, notably FHA and VA, while the second looks at the GSEs. An ongoing theme of these posts has been the way that the Covid-19 pandemic and the policy response it has engendered have served to upend traditional relationships in the system of housing and housing finance. During the Global Financial Crisis, the unemployment rate surged to 10%, and housing prices collapsed by 35% causing widespread devastation in global financial markets. Shortly after the onset of the health crisis, the unemployment rate shot up close to 10% again, but this time, house prices soared, rising over 25% from May 2020 to October 2021. 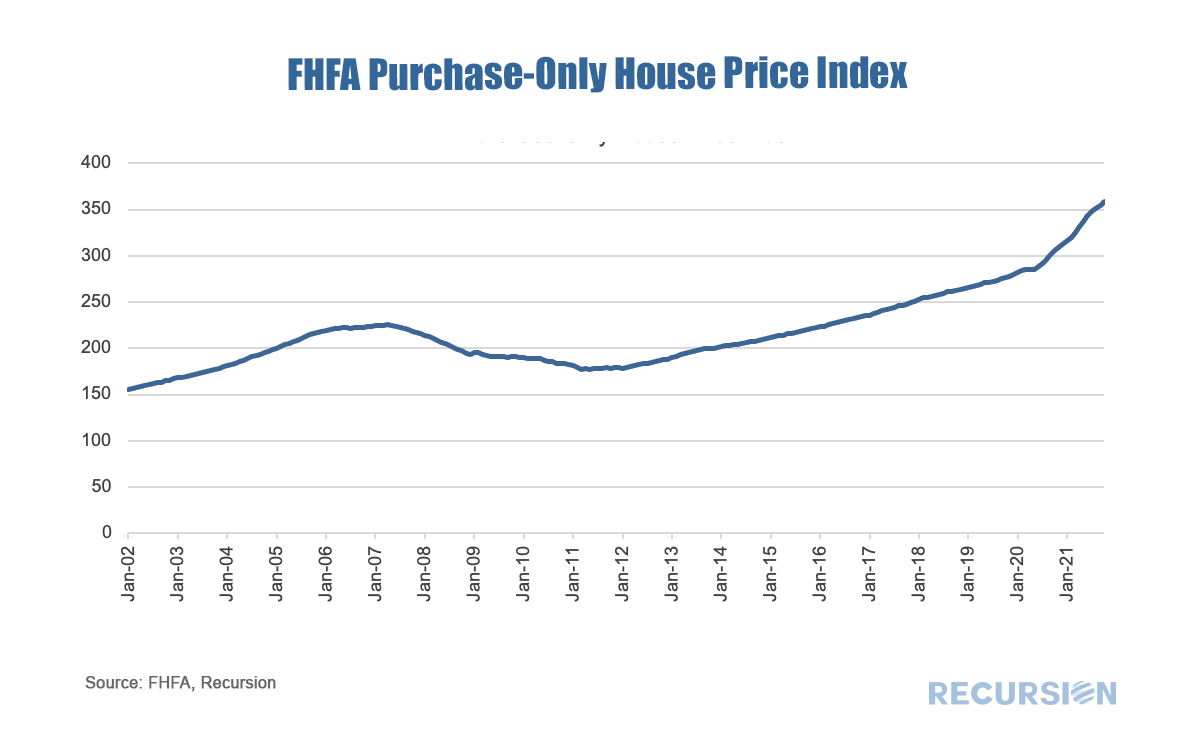 In a recent post, we discussed the market impact that arose from the imposition, and subsequent reversal, of limits on deliveries of NOO (non owner-occupied) residences, as well as on deliveries via the cash window, to the GSEs[1]. In summary, it discussed how the imposition of limits resulted in declines in the share of the NOO categories in the summer, with some rebound in evidence in Q3 when these were rescinded. In this exercise, we look at the change in the share of purchase mortgage deliveries to both Enterprises from the same quarter in the prior year. This is done to eliminate the seasonal pattern that is in evidence in these shares that derive from the fact that owner-occupied purchases tend to have a strong seasonal pattern (peak in the spring) while the NOO categories do not. If the suspension of the constraints in September 2021 were binding, we would expect to see a jump in the share in the NOO categories in Q4. This is certainly the case for investment properties: 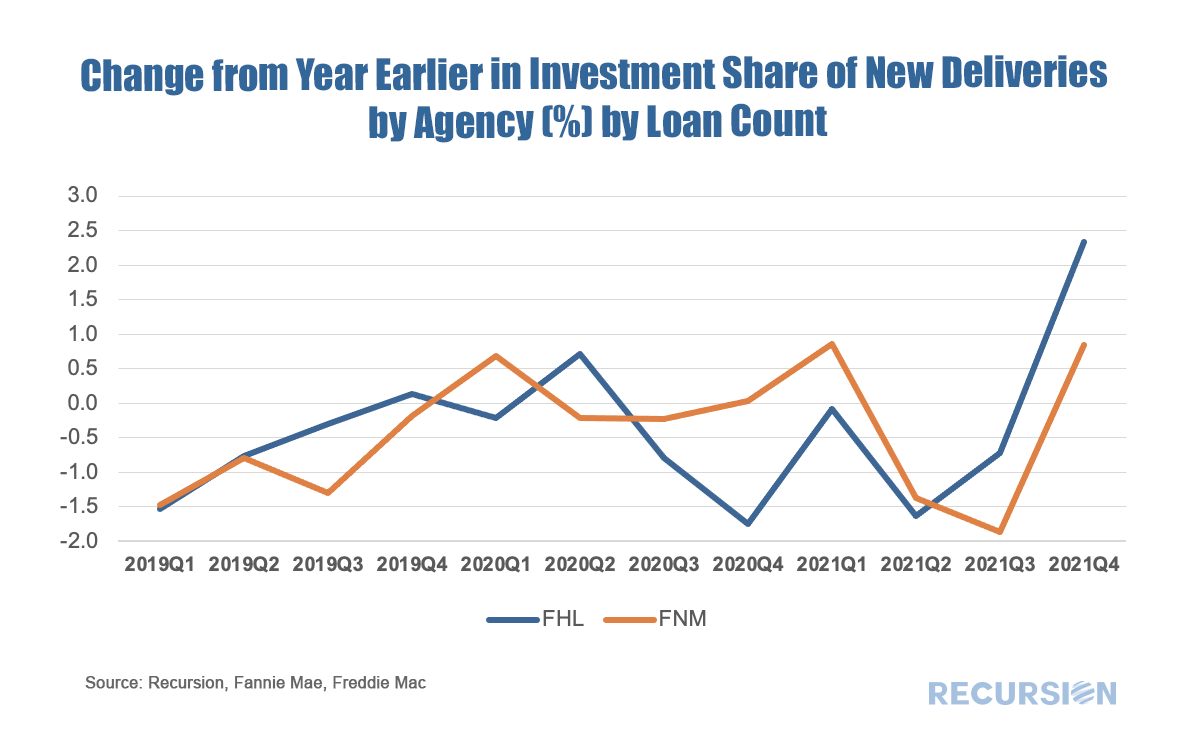 A curious policy development this year has been the stop-start approach towards the imposition of caps on the GSE’s regarding their purchases of loans backed by non-owner occupied (NOO) residences. In January the Treasury and FHFA amended the Enterprise’s Preferred Stock Purchase Agreements (PSPAs) to limit their acquisitions of single-family mortgage loans secured by second homes and investment properties to 7% of single-family acquisitions over the preceding 52-week period[1]. In September these caps were suspended[2]. Below find charts of the shares of second homes and investment properties out of all purchase mortgage deliveries to Fannie Mae and Freddie Mac, along with supporting fundamental factors. 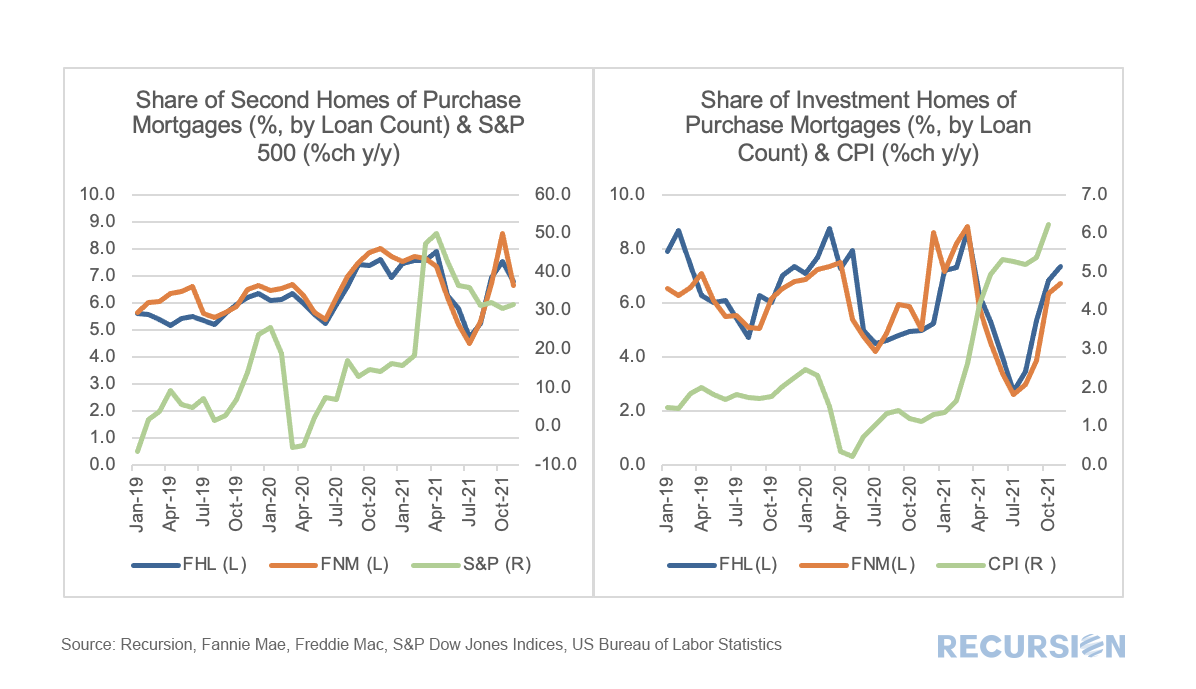 In both cases, there was a drop in the shares in the NOO categories after the initial policy announcement this year followed by a rebound in recent months. With regards to the fundamental factors, in the case of second homes, the share of purchase mortgages rose from about 6% to 8% following the onset of the pandemic as households sought refuge from densely populated areas. According to the National Association of Realtors, more than 50% of second homes are all-cash transactions, suggesting that the equity market is more important than earned income in driving these buying decisions[3]. Of course, the data used here come from loans in Agency pools, but the performance of the equity market likely has a significant influence on buyer sentiment in this market segment. The recent acceleration of consumer prices is likely supporting the sales of homes purchased for investment purposes, as real estate is widely seen as a hedge against inflation, in part because mortgage payments will not rise if the purchase is financed with a fixed-rate mortgage. Once again, we have a case where optimal investment decisions are driven by detailed knowledge of a combination of policy and fundamental factors. Loan-level digital tools are essential in drilling down to the level needed to formulate successful strategies. Received wisdom in the mortgage market holds that distress in the mortgage market eases as the labor market improves. While there is certainly some justification for this view, in fact there are many factors that drive performance so the direct correlation with the jobs market does not always hold. 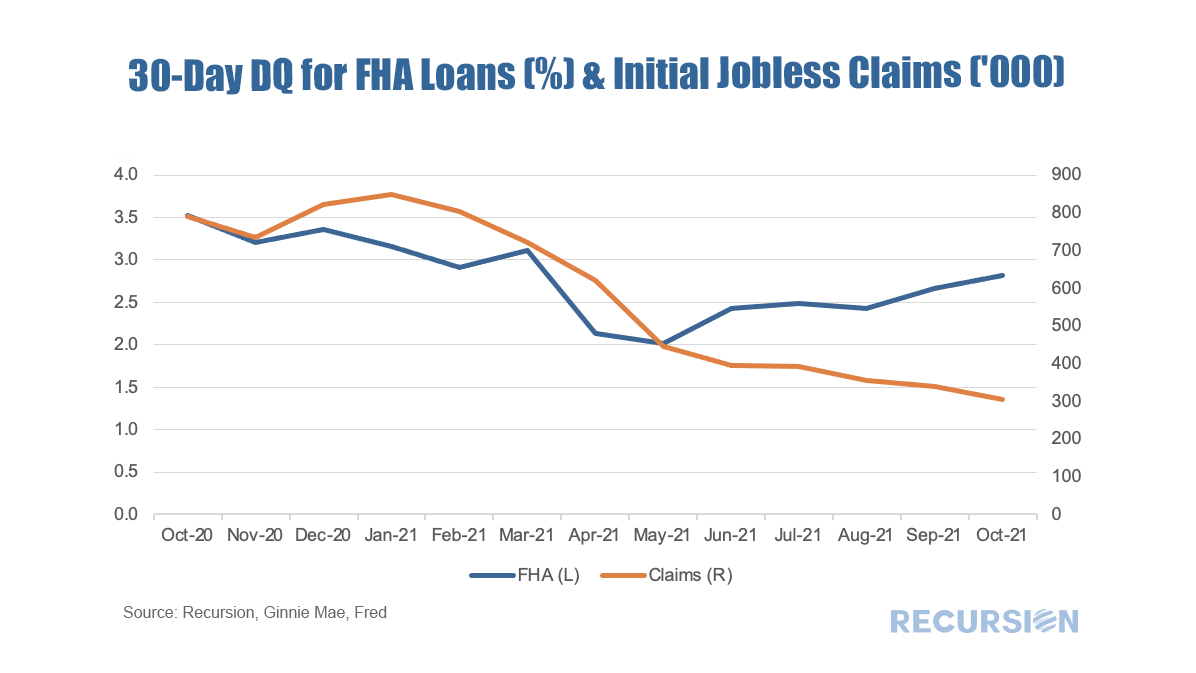 Our Chief Research Office Richard Koss gave a speech at the forum Food for Thought on Wednesday, September 22 at Columbia University about housing policy changes during the Covid-19 Pandemic. Food for Thought is a speaker series that focuses on the Covid-19 crisis and social justice reform. Richard will discuss his paper about the policy response to the unexpected arrival of the global pandemic. His speech paper The New Housing Policy is available to download.
|
Archives
July 2024
Tags
All
|
 RSS Feed
RECURSION |
|

Copyright © 2022 Recursion, Co. All rights reserved.