|
With affordable housing for Low-Moderate Income (LMI) households at the top of the policy agenda, we take a look at loan data for manufactured housing (MH). In a recent report, the CFPB provided a comprehensive survey of this market based on enhancements to the HMDA data first made available in 2018[1]. These include data on Secured property type:
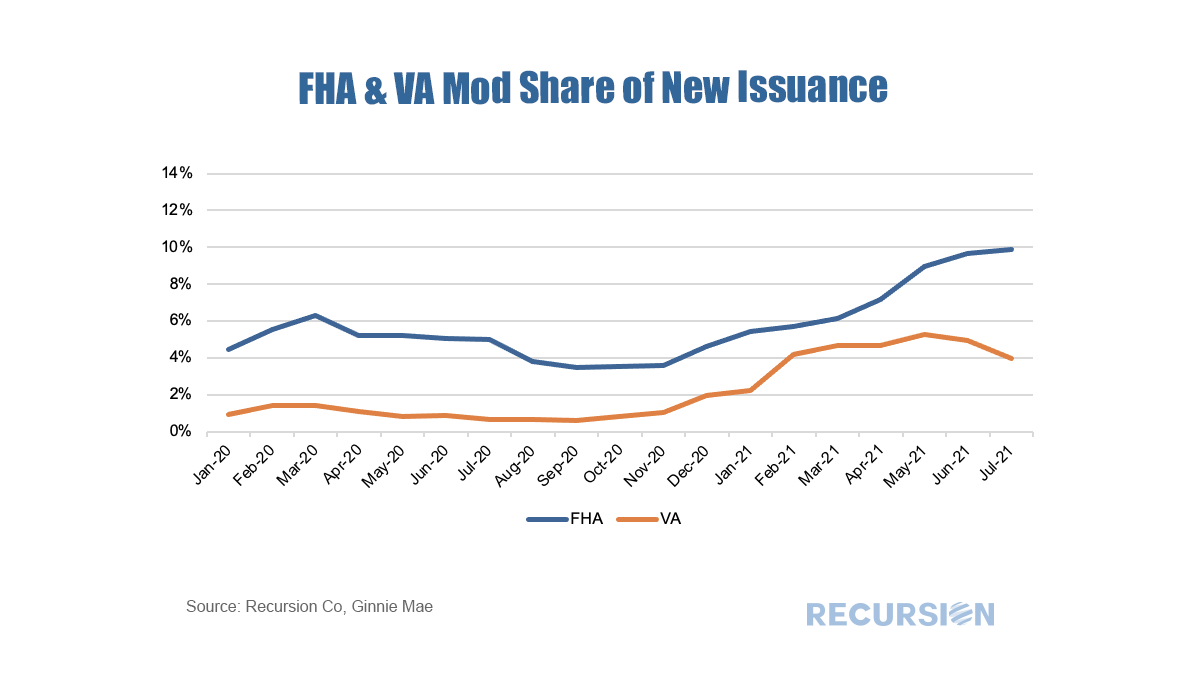
In their survey, the CFPB looked deeply into the data for 2019. In this note, we update some of their work with 2020 HMDA data. This is important because of the onset of Covid-19 that year. The site-built market performed strongly, but this cannot necessarily be presumed to carry over to MH as Covid is a supply shock, impacting labor markets and supply chains. Another innovation in this note is that rather than looking at this market by state the way the CFPB does, as a policy guide we look at it bifurcated between rural and nonrural MSAs. Below finds a chart of the progression of single-family manufactured housing origination volumes for personal loans (securitized by chattel) and mortgages (securitized by real property) from 2018-2020, along with the share of all single-family manufactured housing loans (personal loans plus mortgages) of the total single-family mortgages including those for site-built homes. 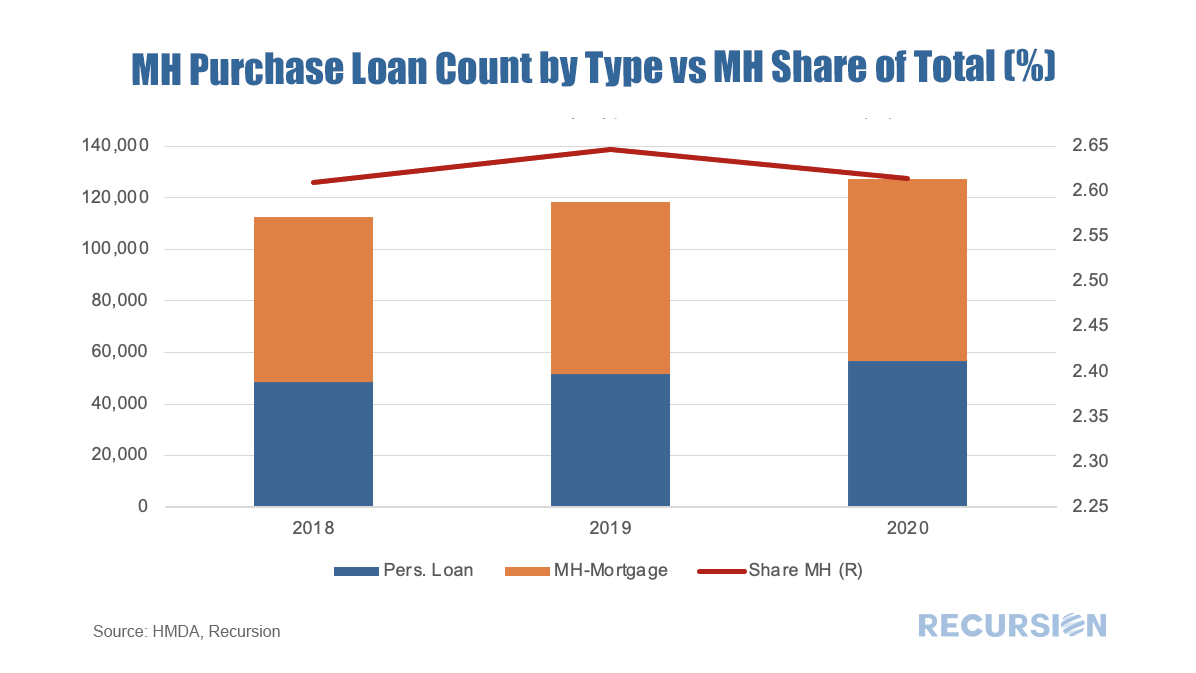 One of the many recurring themes of these posts is that the shock of the Covid-19 Pandemic and subsequent policy response has resulted in structural changes in behavior that cause loan performance metrics to shift compared to the pre-crisis world. An interesting example of this can be found in the performance of modified loans in Ginnie Mae programs. Modified loans in these programs are those that have been purchased out of pools by servicers that are past due that subsequently have features such as rate and term adjusted in order to bring households back to a current status. These are then often resecuritized into a new GNM pool.
 Recursion Co’s Chief Research Officer Gives the Food for Thought Lecture Series at Columbia SIPA8/19/2021
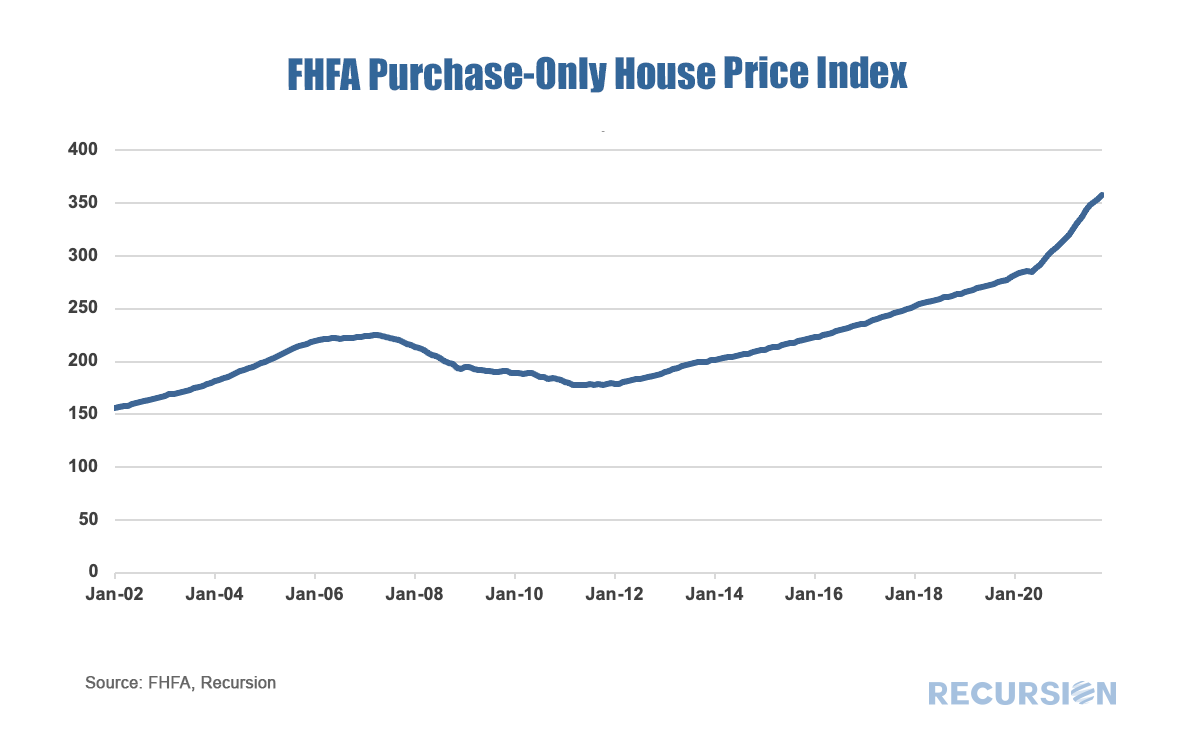
Food for Thought is a speaker series that discuss the Covid-19 crisis and social justice reform at the Columbia University School of International and Public Affairs (SIPA). Our Chief Research Office Richard Koss will give a talk at this forum on Wednesday, September 22 at 12PM EST about housing policy changes during the Covid-19 Pandemic. “The onset of the Covid-19 Pandemic represents a massive shock impacting all sectors of the global economy. It has been particularly felt in the real estate sector as households reconsider their work/living arrangements and adjust their lives accordingly. It has also greatly exacerbated the trend towards wealth inequality. The new Biden Administration and other government agencies, notably the Federal Reserve, are engaging in innovative policy making to improve the functioning of the economy, expand access to credit and provide affordable rental housing to low-income households. What are the barriers to success facing these programs and what more needs to be done?” Read More  The recent unprecedented surge in home prices to a record 18% jump on a year-year basis as measured by the FHFA purchase-only index brings affordability front and center to the current housing policy debates. In May 2021, indexed home prices stood 15.5% above indexed aggregate earned income, a bit less than half of the peak house price overvaluation of 29.0% reached in December 2005, just before the onset of the Global Financial Crisis. 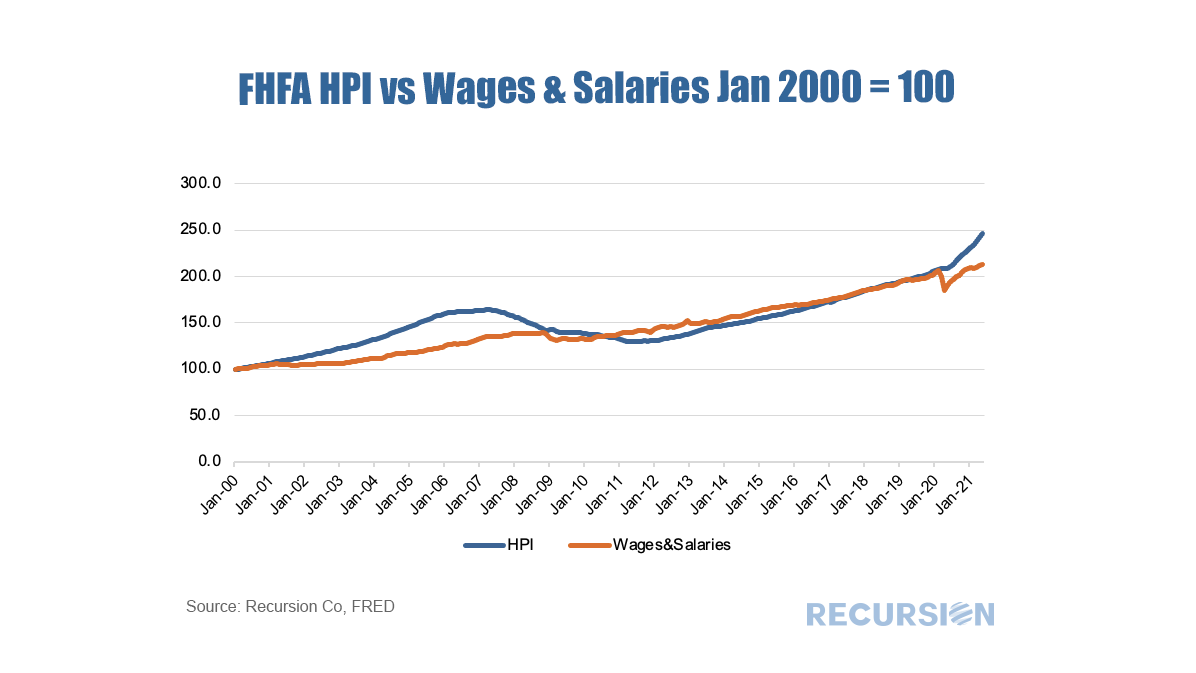 The topic of affordability is very broad, and will be the subject of much further commentary, but in this post we look briefly at this topic through the distribution of the purchase mortgage market across securitization agencies, notably FHA and the GSE’s. Looking at the distribution between the GSEs and FHA is informative in this issue because the FHA program is aimed at low-income borrowers. According to 2020 HMDA data, the weighted average household income for FHA borrowers of purchase mortgages was $85K while for those in conforming mortgages the figure was $228K. Since the onset of the Covid-19 pandemic in early 2020, the share of FHA purchase mortgages of the total[1] delivered to agency pools as been in general decline, on both a loan count and outstanding balance basis: 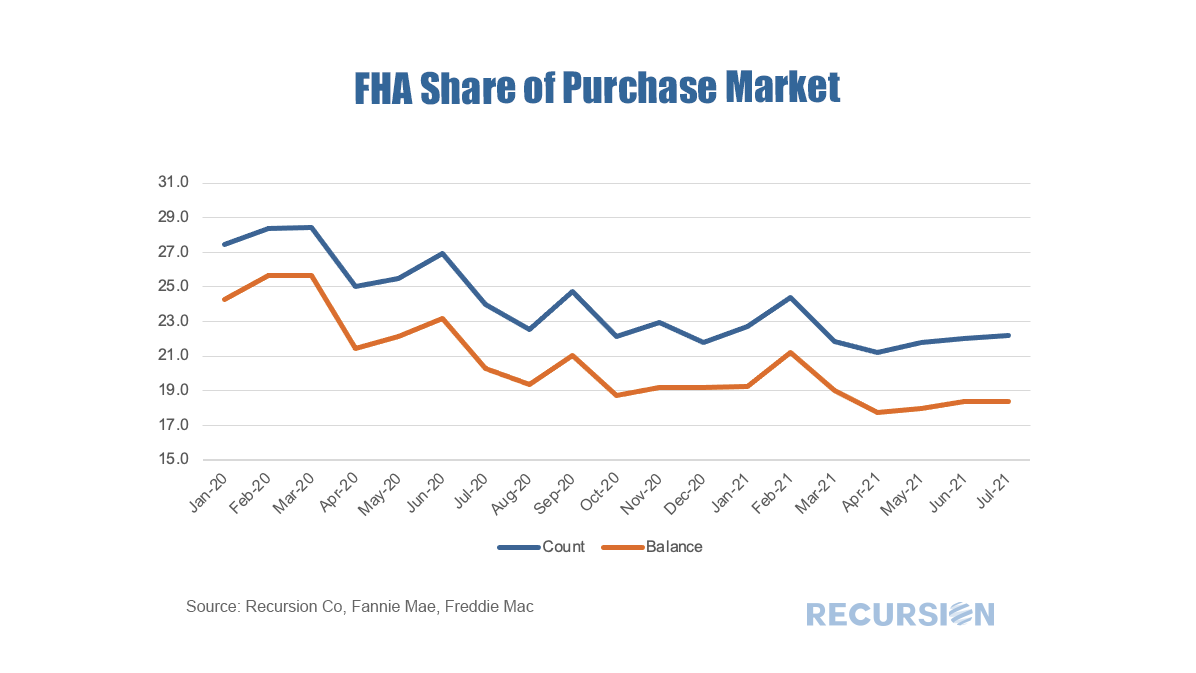 With a base consisting of relatively lower-income borrowers, it makes sense that the borrowers in this program are struggling to qualify for loans in a skyrocketing market. To check this out, we calculate the change in the distribution of loans between FHA and the GSE programs by original loan sizes: 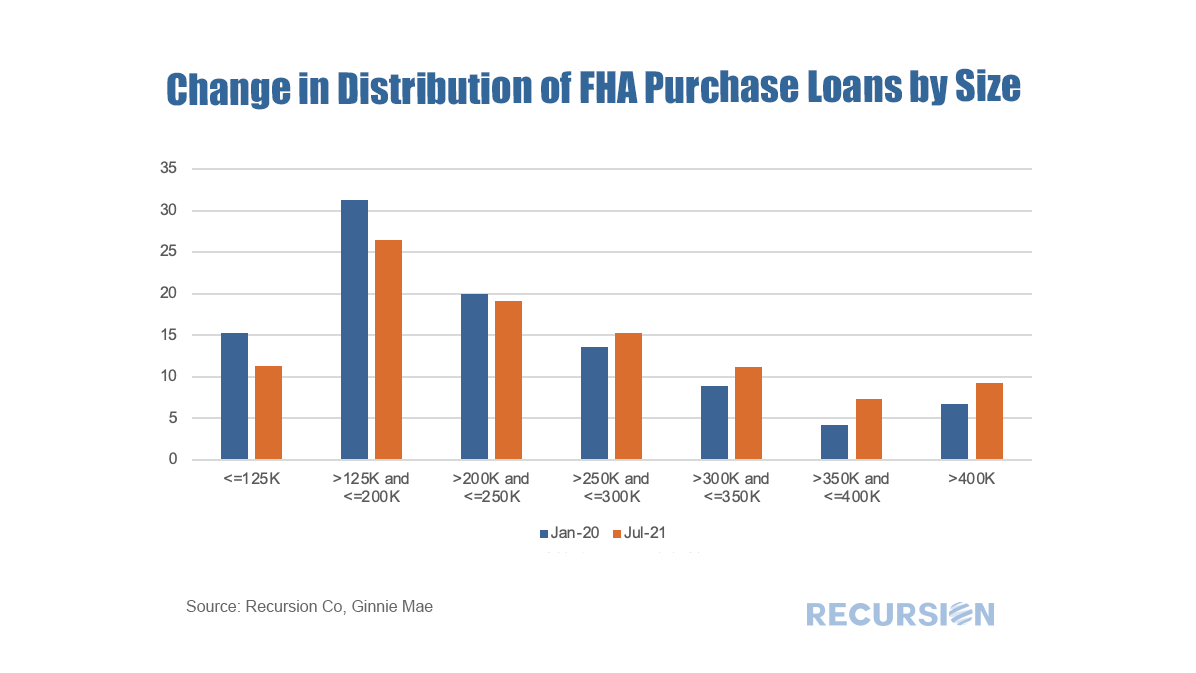 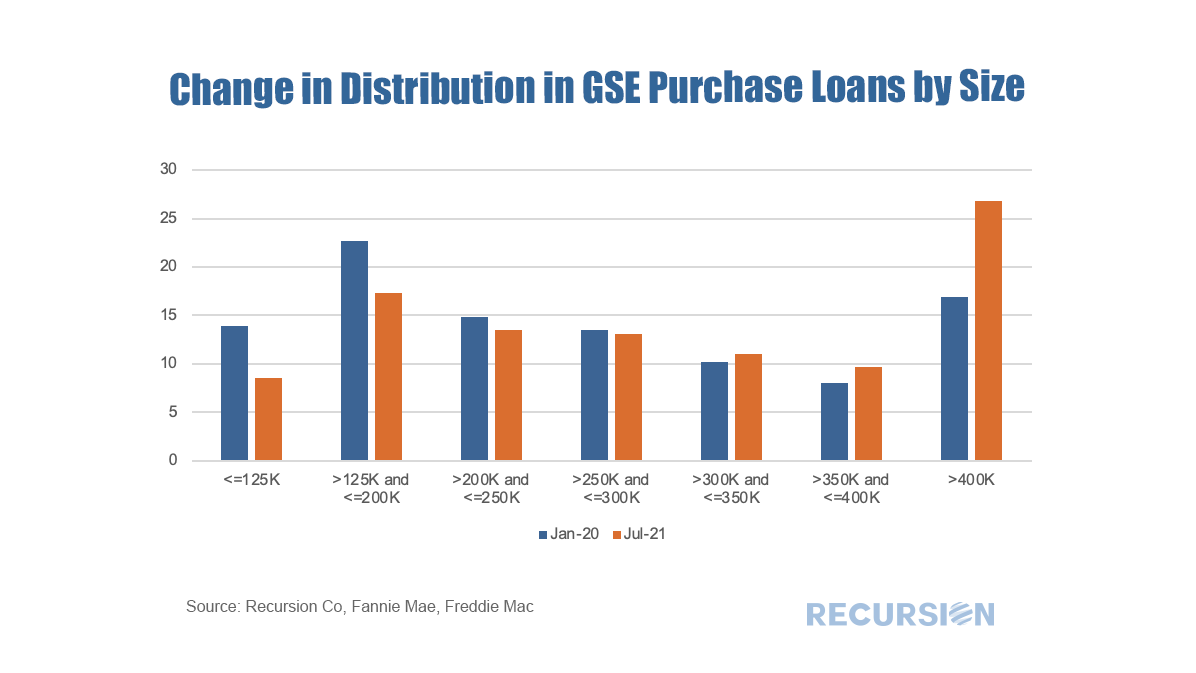 Intuitively, larger loans comprise a greater share of the distribution of purchase loans in both programs between January 2020 and July 2021. Over this period, FHA lost a bit over 5% in market share to the GSE’s in this category. The change in share by loan size bucket and the contribution of each of these to the total loss in share is given below:  In fact, it turns out that about three quarters of the loss in FHA’s purchase market share comes from losses in loan sizes less than $250,000. Further analysis is needed to look at the fundamental and structural factors that are behind this result. [1] In this case we view the total as FHA + GSE
In a recent Liberty Street Economics blog post, researchers at the New York Federal Reserve discussed the background and landscape of mortgages qualifying for Covid forbearance under the CARES Act[1]. 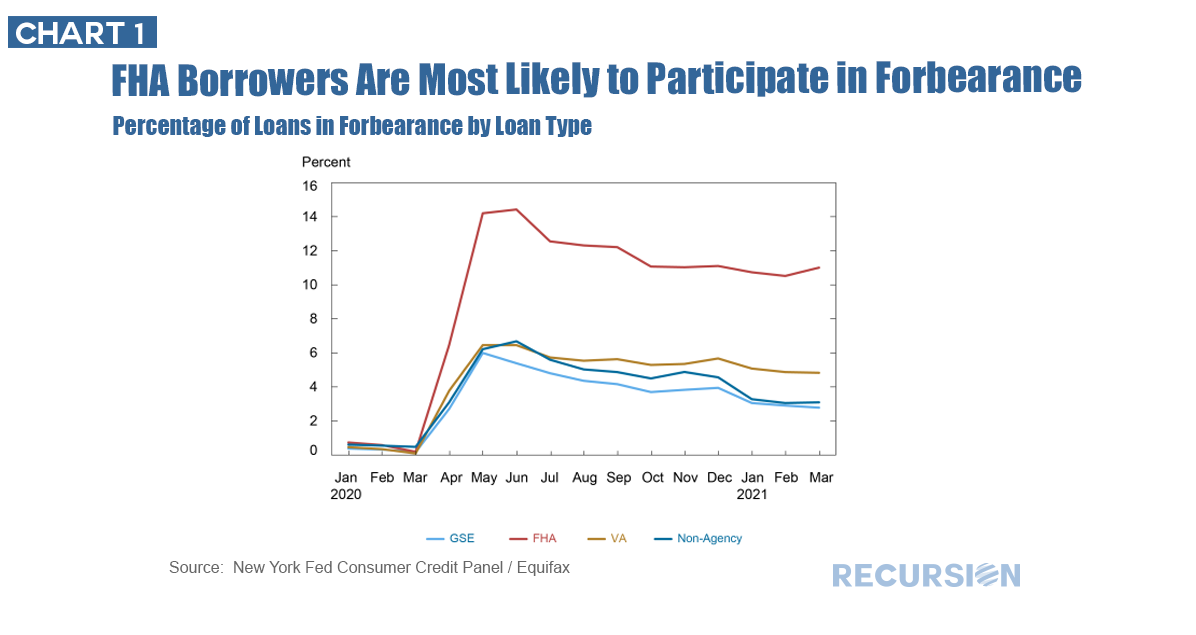 Recently, the Federal Reserve released its May 2021 Financial Stability Report[1], with a particular emphasis on asset valuations. Valuations are raised as a concern as “Prices of risky assets have generally increased since November with improving fundamentals, and, in some markets, prices are high compared with expected cash flows”. While not cited as a matter of high alarm the report commented that “House price growth continued to increase, and valuations appear high relative to history.” On May 25, FHFA released the purchase-only house price index for March, showing a record-high growth rate of 13.9%, far above the bubble-era peak of 10.7% attained in 2005[2]. Housing fundamentals are of course supportive with mortgage rates below 3% and economic activity rebounding as vaccine optimism spreads. The unique factor now in housing is the impact of the pandemic on preferences for housing away from density and towards suburban and smaller-urban centers. This new fundamental can easily be seen via booming housing demand during the pandemic as measured here by purchase mortgage deliveries to Freddie Mac[3]. 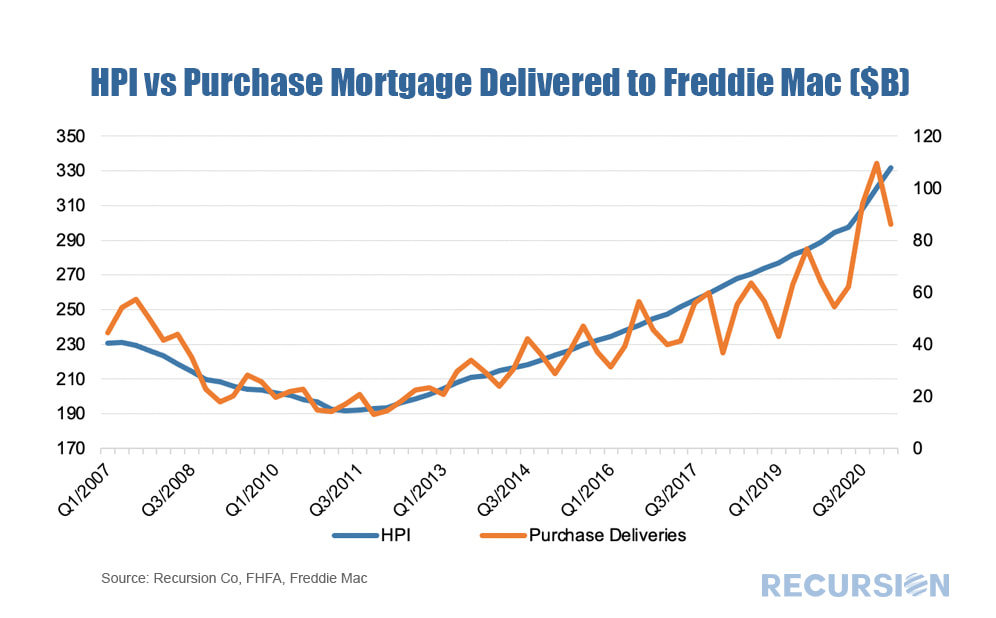 With house prices soaring to new highs on the back of pandemic-related household relocations and sub 3% mortgage rates, the natural question is how far these trends can continue. While we have no crystal ball for calling market tops and bottoms, we feel we can gain some insight into market dynamics by looking into the composition of demand. The GSE’s provide us with the ability to peer into this composition through the “Occupancy Type” flag, which consists of three types: owner-occupied, second homes and investor properties. Here we look at the share of all purchase mortgages from the last two types: 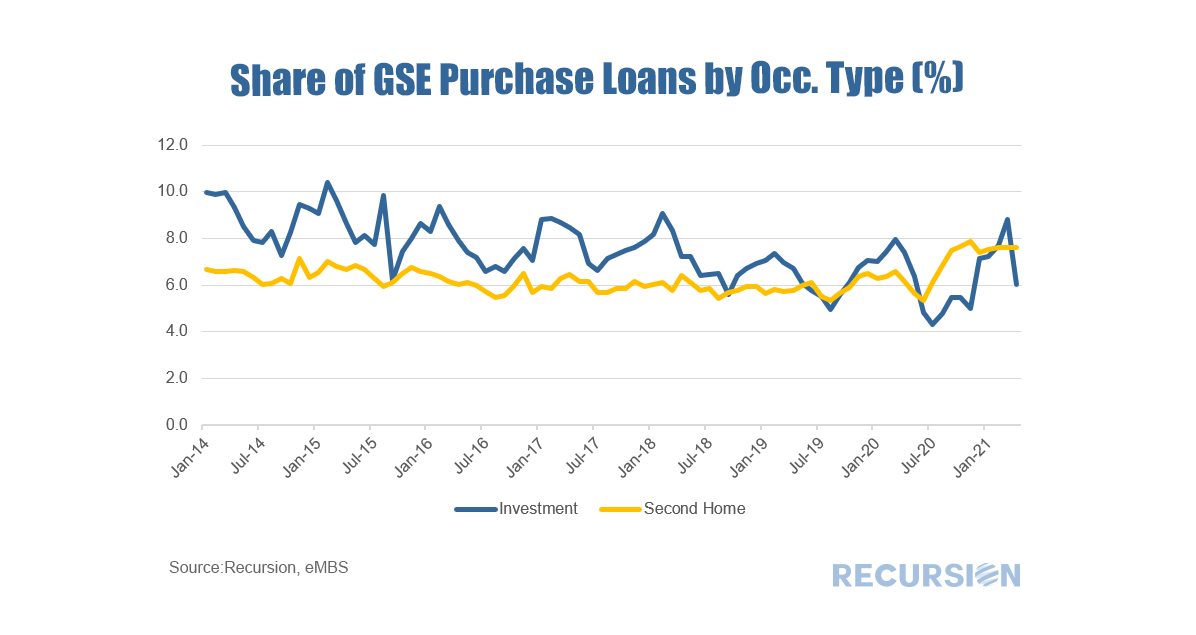 |
Archives
February 2024
Tags
All
|
 RSS Feed
RECURSION |
|

Copyright © 2022 Recursion, Co. All rights reserved.