• HOME
  • solutions
    • RECURSION ANALYZERS
    • Mortgage Company Data
    • Recursion DataCloud
    • Customized Solutions
  • BLOG
  • CLIENT LOGIN
    • Recursion Analyzers
  • ABOUT US
    • OVERVIEW
    • OUR TEAM
    • News & Events >
      • Recursion In News
      • Recursion Data Citations
  • CONTACT
RECURSION CO
  • HOME
  • solutions
    • RECURSION ANALYZERS
    • Mortgage Company Data
    • Recursion DataCloud
    • Customized Solutions
  • BLOG
  • CLIENT LOGIN
    • Recursion Analyzers
  • ABOUT US
    • OVERVIEW
    • OUR TEAM
    • News & Events >
      • Recursion In News
      • Recursion Data Citations
  • CONTACT
BLOG

Impact of COVID on Ginnie Mae Modified Loans

8/23/2021

 
One of the many recurring themes of these posts is that the shock of the Covid-19 Pandemic and subsequent policy response has resulted in structural changes in behavior that cause loan performance metrics to shift compared to the pre-crisis world. An interesting example of this can be found in the performance of modified loans in Ginnie Mae programs.

Modified loans in these programs are those that have been purchased out of pools by servicers that are past due that subsequently have features such as rate and term adjusted in order to bring households back to a current status. These are then often resecuritized into a new GNM pool.
​
  • Securitization of modified loan volumes more than doubled after the pandemic
The Covid shock of course has resulted in a surge in delinquencies and triggered large volumes of buyouts and modifications. Below find a plot of the share of modified loans of total new issuance for FHA and VA programs since January 2020:
Picture
Run Underlying Query
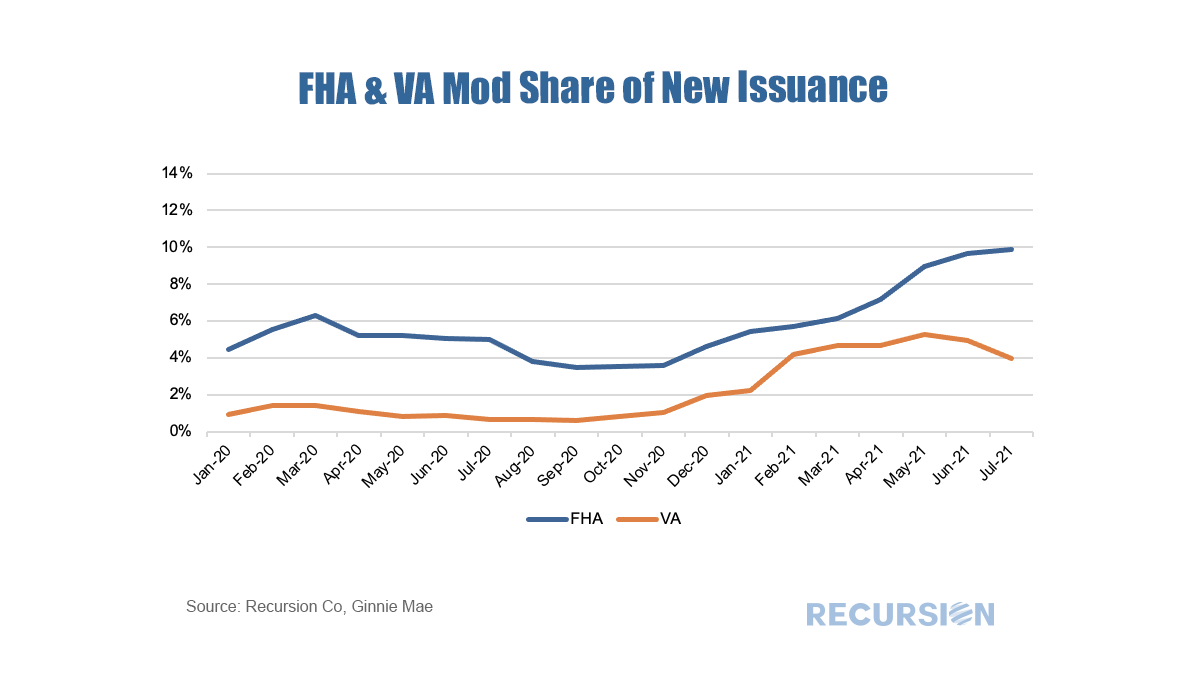
Historically, the FHA program has tended to have a higher modified share of total issuance than VA corresponding to the relatively higher delinquency rates for FHA vs VA associated with the relatively stronger credit stances of VA vs FHA borrowers. This gap narrowed significantly over the course of 2020, but in recent months the FHA share has continued to increase, albeit recently at a slower rate, while that for VA has turned down. The recent divergence in the two lines is not likely due to changes in the pace of delinquencies, but rather to the behavior of servicers active in the two programs.
​
To get a sense of the impact of these developments, we look at the performance of these modified loans. Historically total default rates in this category of loans are much higher than regular purchase and refi loans, reflecting recent distress. Since the current distress is quite different from that experienced previously, we look at cumulative default rates[1] at the 4th month after pool issuance pre- and post-pandemic. As a consistency check we look at this metric for the two biggest government programs, FHA and VA.
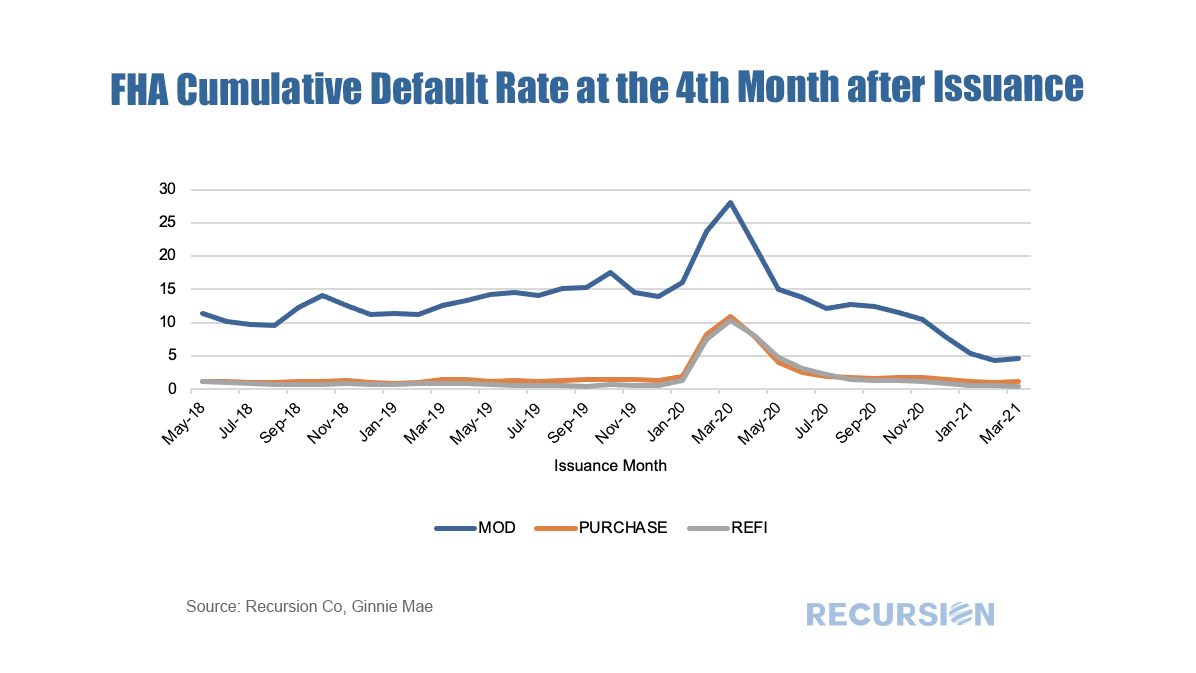
  • Performance of post-pandemic modified loans significantly better than those issued pre-pandemic
Now we look at the cumulative default rates for the various loan purposes in the FHA program at the 4th month after pool issuance:
Picture
And the VA program:
Picture
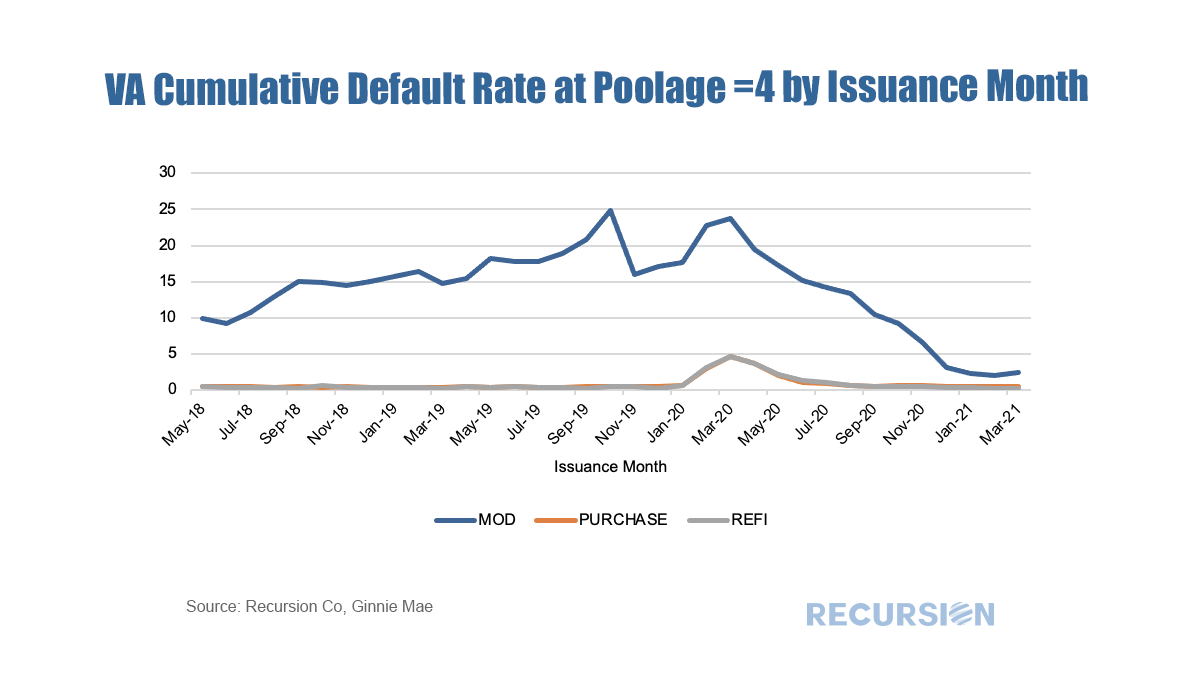
These results are striking. Somewhat unintuitively, by this measure the performance of modified VA loans compares unfavorably to that of FHA prior to the onset of the pandemic. The ratio of the cumulative default rate for mod loans relative to others at their peak in March 2020 as almost 5.2:1, while that for FHA is about 2.7:1. After the peak, relative performance sharply improved for both programs, but the pace has been much larger for VA relative to FHA. It seems that in both cases the characteristics of borrowers with modified loans has changed in the recent period compared to pre-pandemic times, but the changes are much more pronounced for VA[2]. There could be two possible reasons:
  1. Modification measures are more effective after the pandemic
  2. Borrowers receiving modifications after the pandemic are experiencing temporary hardship rather than the more permanent hardship that was typical pre-pandemic.
 
So, the supposition at the start that structural changes are underway that have a long-term impact on market performance appears to be verified. Whether this will persist or slowly adjust back to pre-pandemic norms remains to be seen, but the easy assumption of mean-reversion cannot be made with any real confidence.

[1] Cumulative default rates measure % of loans ever reached 60 day delinquency
[2] The weighted average credit score for FHA newly issued loans increased from 609 in Jan 2020 to 645 in Mar 2021; the score for VA newly issued loans increased from 613 in Jan 2020 to 666 in Mar 2021.

    Archives

    April 2025
    January 2025
    November 2024
    September 2024
    August 2024
    July 2024
    June 2024
    May 2024
    April 2024
    March 2024
    February 2024
    January 2024
    December 2023
    November 2023
    October 2023
    September 2023
    August 2023
    July 2023
    June 2023
    May 2023
    April 2023
    March 2023
    February 2023
    January 2023
    December 2022
    November 2022
    October 2022
    September 2022
    August 2022
    July 2022
    June 2022
    May 2022
    April 2022
    March 2022
    February 2022
    January 2022
    December 2021
    November 2021
    October 2021
    September 2021
    August 2021
    July 2021
    June 2021
    May 2021
    April 2021
    March 2021
    February 2021
    January 2021
    December 2020
    November 2020
    October 2020
    September 2020
    August 2020
    July 2020
    June 2020
    May 2020
    April 2020
    March 2020
    February 2020
    May 2019
    March 2019
    February 2019

    Tags

    All
    Affordability
    ARM
    Bank Call Report
    Bank\nonbank
    Borrower Assistant Plan
    Buydown
    Cash Window
    Climate Change
    CMBS
    CMO
    Conforming Loan
    Conventional Loan
    COVID 19
    CPR\CDR\CRR\CCR
    Credit Score\DTI\LTV
    Credit Union
    CRT\CAS\STACR
    Delinquency
    DPA
    Early Buyout
    Early Payment Default
    ESG
    ET Pools
    Fannie Mae
    Fed
    FHA
    FHFA
    Forbearance
    Foreclosure
    Foreign Investor
    Freddie Mac
    Freddie Mae
    FTHB\Repeated Purchase
    Ginnie Mae
    Green Loans
    GSE
    HECM
    HELOC
    HMDA
    HUD
    LMI
    Macro
    Manufactured Housing
    Modified Loans
    MSR
    Multifamily
    Multi-issuer
    Occupancy Type\NOO
    Partial Claim
    Payoff
    PIW
    Prepayment
    Property Valuation Methods
    PUD
    Purchase Loans
    Recursion In News
    Recursion In The News
    Refi Loans
    Reperforming
    Repurchase
    RG Pools
    RIN
    Rural Housing
    SEC
    Second Lien
    Single Family
    Special Eligibility Program
    TBA Market
    TIC
    TPO
    UMBS
    US Treasury
    VA

    RSS Feed

RECURSION

SOLUTIONS ​
Recursion Analyzers
​
Mortgage Company Data
Recursion DataCloud
Customized Solutions


ABOUT US  ​
Overview
​Our team
CLIENT LOGIN   ​
Recursion Analyzers

CONTACT

224 West 30th St., Suite 303, New York, NY 10001
Contact Us

Picture
Copyright © 2024 Recursion, Co. All rights reserved.​
  • HOME
  • solutions
    • RECURSION ANALYZERS
    • Mortgage Company Data
    • Recursion DataCloud
    • Customized Solutions
  • BLOG
  • CLIENT LOGIN
    • Recursion Analyzers
  • ABOUT US
    • OVERVIEW
    • OUR TEAM
    • News & Events >
      • Recursion In News
      • Recursion Data Citations
  • CONTACT