|
In a recent post[1], we discussed the disposition of loans that are exiting forbearance programs. In the Ginnie Mae programs, many loans bought out of pools have received modifications or other workouts, and then redelivered to Ginnie Mae pools. However, we have historically observed that there are more loans bought out than re-delivered, even considering the time needed for the workout. As it turns out, there are other market-based outlets for these loans, which is more evident at the issuer level than in aggregate. Below find a chart of buyout and securitization activities within Ginnie Mae program for Lakeview, the third-largest Ginnie Mae servicer as of April 2022. 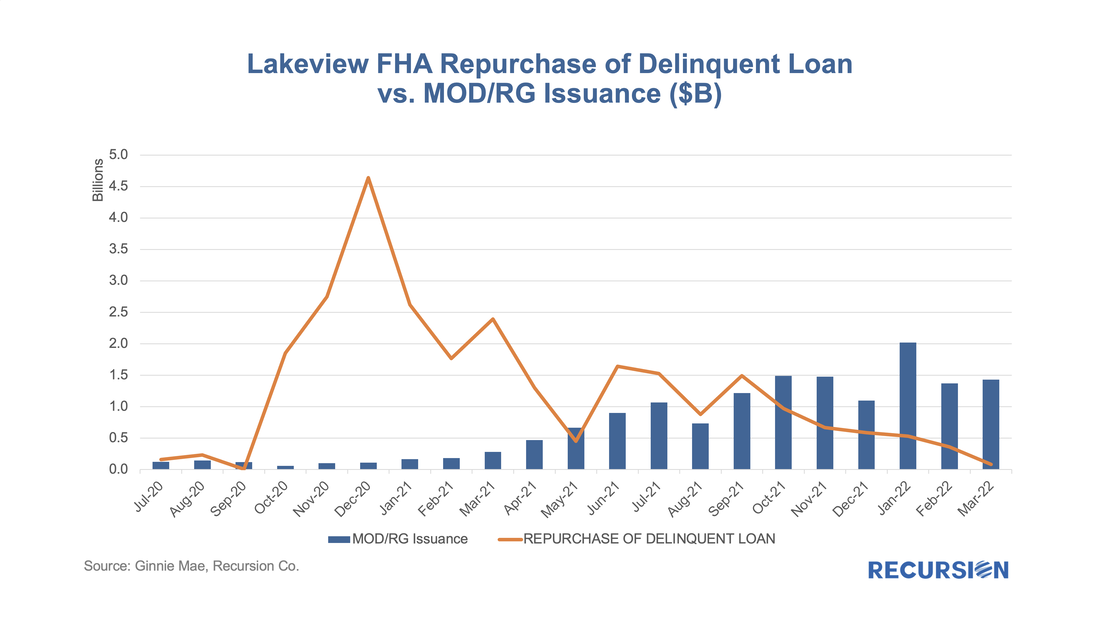 In an earlier post, we discussed the use of trial modifications as a leading indicator of buyouts, as loans in these programs must experience three months of successful payments prior to being eligible for a permanent mod[1]. On January 25, Fannie Mae announced that they had purchased certain loans out of pools prior to the completion of the necessary trial payments.[2] Then, on March 25, Fannie published a list of these securities, allowing us to quantify the impact of this event on the performance of their pools[3]. The spreadsheet attached to the March announcement contains over 17,800 entries dating back to February 2021 and states that the total unpaid balance bought out early amounted to over $4.5 billion. The point of this post is to assess the magnitude of this activity on Fannie Mae’s prepayment speeds. To address this question, we imported the data in the file released by Fannie Mae into our Recursion Pool Analyzer. As a first step, we look at the impact of these purchases on CDR’s as the activity was clearly involuntary. 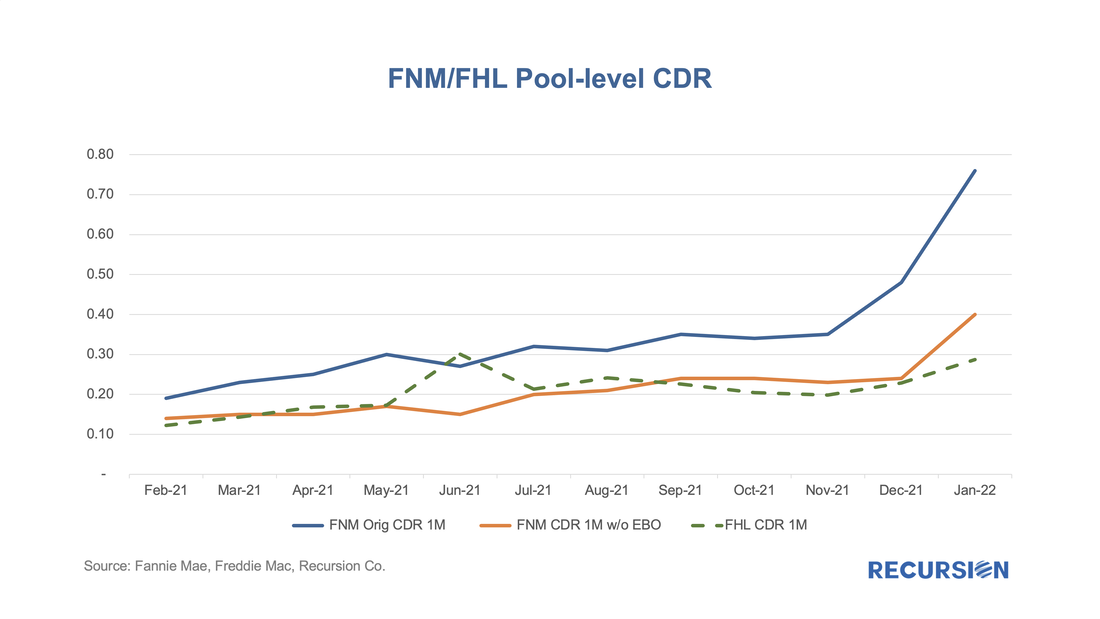 On March 24, the CFPB released HMDA data for 2021[1], with results obtained from 4,316 reporters, little changed from 4,472 reporters in 2020, but well below the 5,505 respondents reached in 2019[2]. There are yet more companies are expected to report to 2021 HMDA. However, our experience from previous year indicates little change in big picture when reporting is finalized. The drop reported in the number of reporters in 2020 vs 2019 is largely due to a reduction in the number of loans that a bank needed to underwrite, requiring a report to be filed starting in 2020. This data is used for market sizing by regulators and market participants, but it also represents a treasure trove of information regarding lender and consumer behavior across a wide variety of economic and market regimes. 2021 was notable for being the second year of the Covid-19 pandemic, which is associated with expansive monetary and fiscal policies and surging house prices. This report will briefly assess trends across a variety of topics. Market Activity After surging by 47% in 2020 to 24.8 million from 2019, the number of loan activities reported in 2021 HMDA ticked up by just 2% to 25.2 million, almost 40% below the record high 41.5 million attained in 2003. Similarly, the number of loans originated reported in 2020 jumped by 57% from the prior year to 14.2 million, while in 2021 the figure rose by only 3% to 14.6 million, down by about one-third from the 2003 peak of 21.4 million. 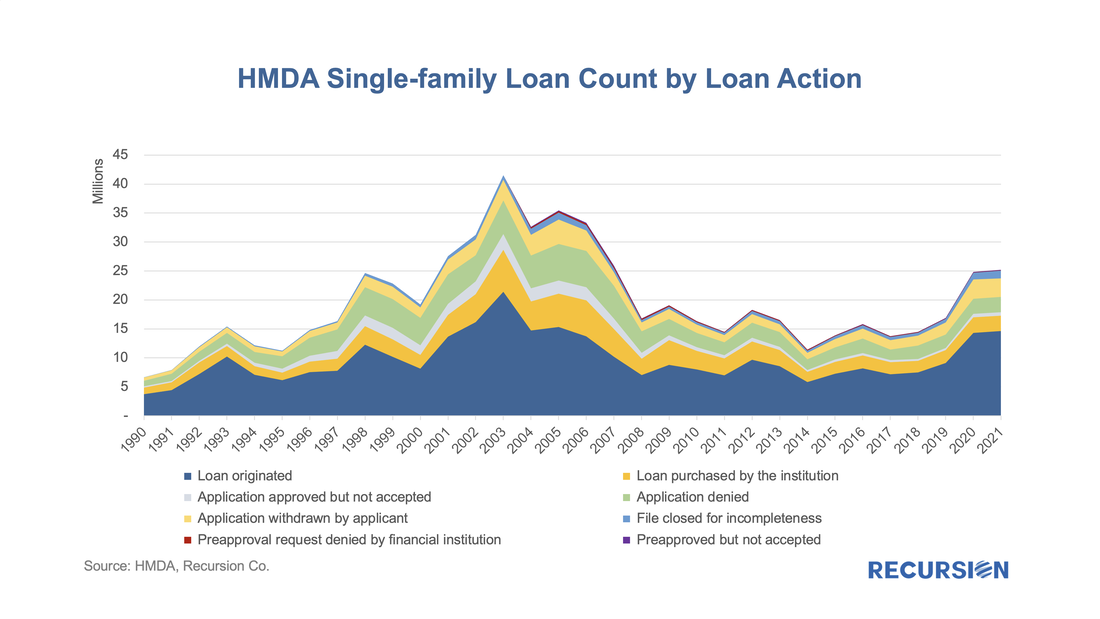 While surging house prices continue to be the focus of market participants, the rental market is increasingly attracting the attention of policymakers, both because of the impact on inflation[1] and the importance of this market for the economic wellbeing of lower-income households[2]. In both cases, there is a widespread consensus regarding the need for new supply to ameliorate these problems. There are many factors that come into play regarding the construction of new rental units, including the availability of private and public sources of credit. As part of its quarterly release of the "Financial Accounts of the United States"[3], the Federal Reserve publishes data that allows us to break down the trend in total multifamily lending into major categories of credit risk holders: 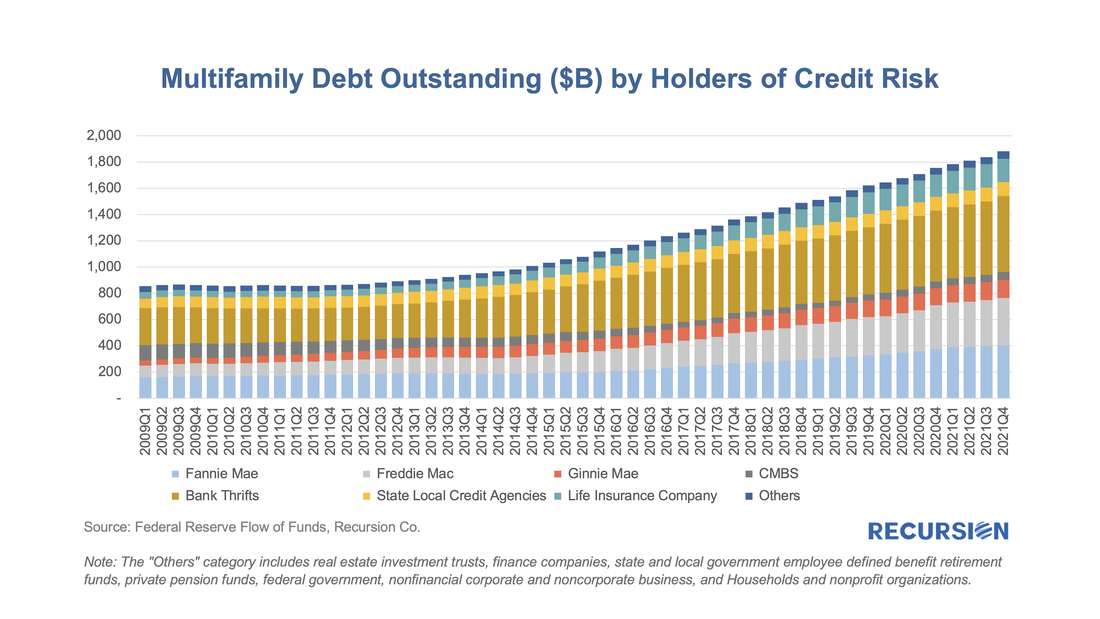 Recursion released the roaster of TOP 10 GNM issuers and GSE lenders of March 2022. Mortgage issuers delivered 183K loans for a combined $47B to Ginnie Mae program. Issuance volume dropped $2B from February 2022. Here’s a list of top 10 GNM mortgage issuers. 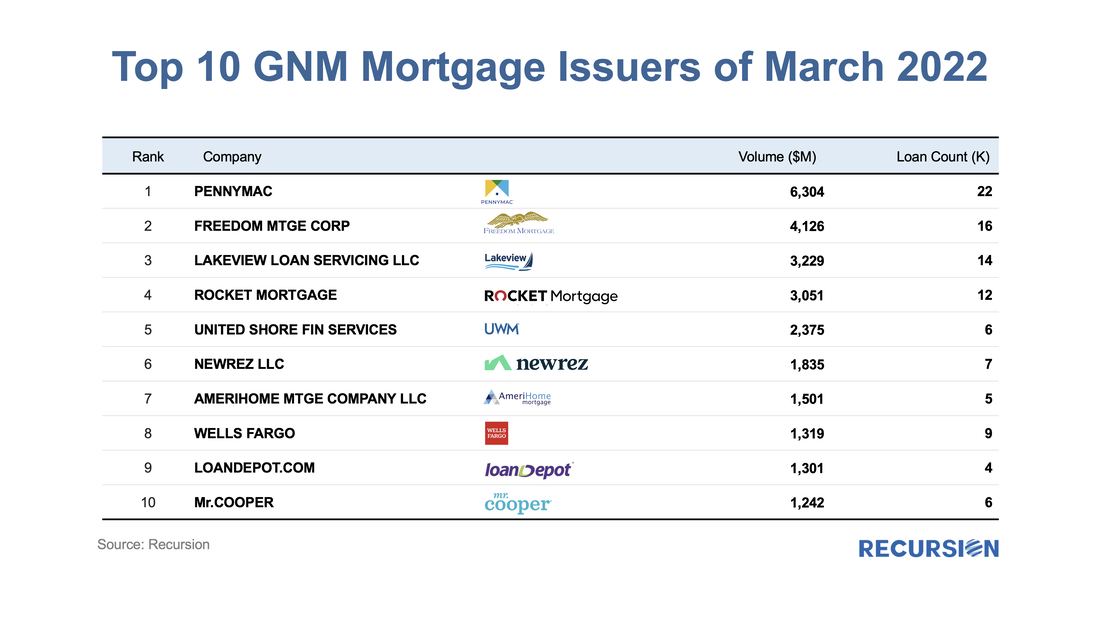 The fourth quarter of 2021 marked the 13th anniversary of the introduction of the Federal Reserve’s Quantitative Easing (QE) policy, whereby the central bank worked to push longer-term rates lower once short-term rates hit the zero lower bound. This activity largely took place via purchases of longer-dated Treasury securities and mortgage-backed securities. There were many nuances as the central bank bought securities in different proportions over time and occasionally let their balance sheet shrink as the securities they held paid off or matured. The purpose of this note is to take a big-picture view of the MBS market impact of a likely decline in Federal Reserve holdings in the Agency space as the central bank has recently indicated its intention to begin letting these securities run off its balance sheet. In particular, the FOMC statement of March 16 stated, “In addition, the Committee expects to begin reducing its holdings of Treasury securities and agency debt and agency mortgage-backed securities at a coming meeting.[1]” Which we guess will be in May. What does this mean to valuations in the MBS market? Our analysis is based on the data collected on Agency MBS ownership broken down by major investor class by the Federal Reserve in the Financial Accounts of the United States[2]. This data is produced quarterly and is a broad measure of Agency securities, including not just single family Agency MBS but also Multifamily MBS and Agency Debt. Below find a chart of the progress of the Agency MBS market from Q4:2008, when the Fed launched QE, through Q4:2021. The chart nicely shows the ebb and flow of activity in this market on the part of the major players. The holdings controlled by the central bank is one example, starting at near-zero in Q4:2008 and cycling up and down, reaching a record high of almost 25% at the end of 2021. 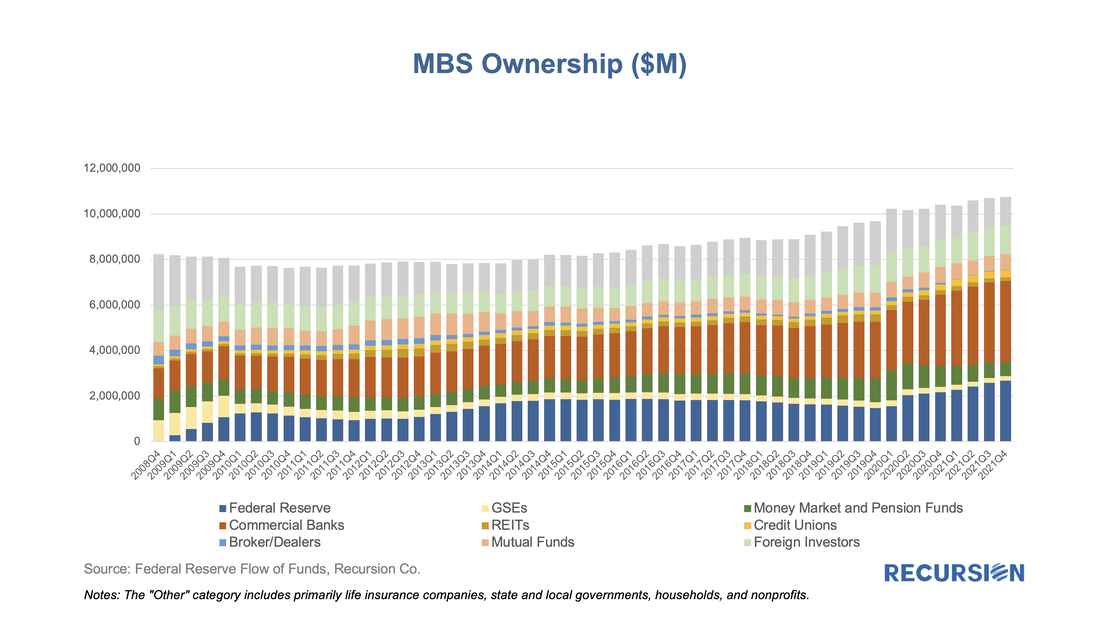 |
Archives
July 2024
Tags
All
|
 RSS Feed
RECURSION |
|

Copyright © 2022 Recursion, Co. All rights reserved.