|
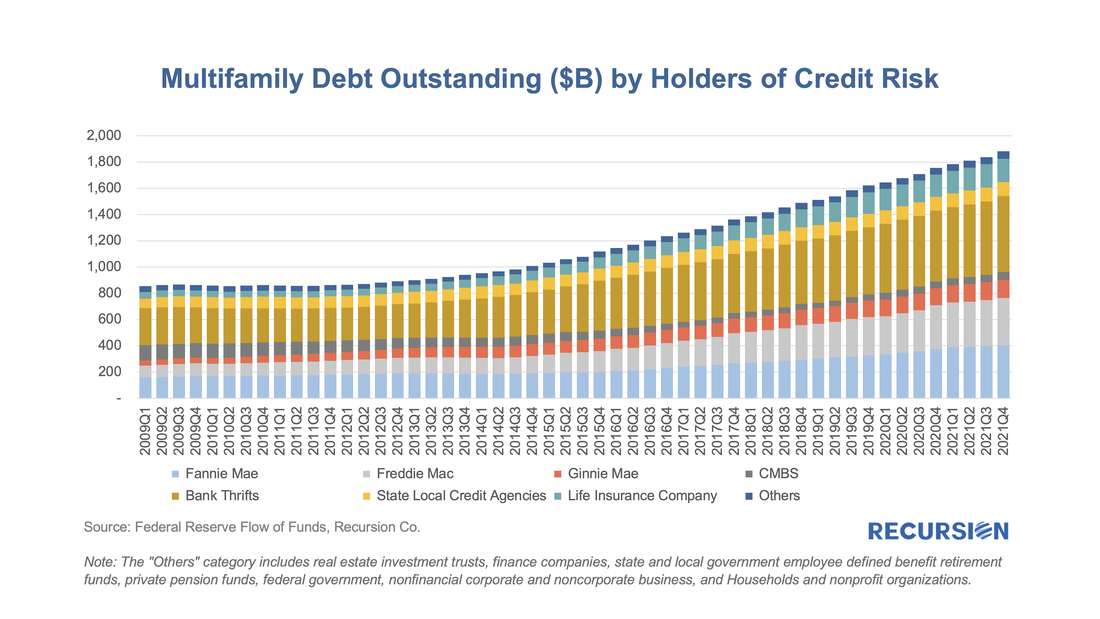
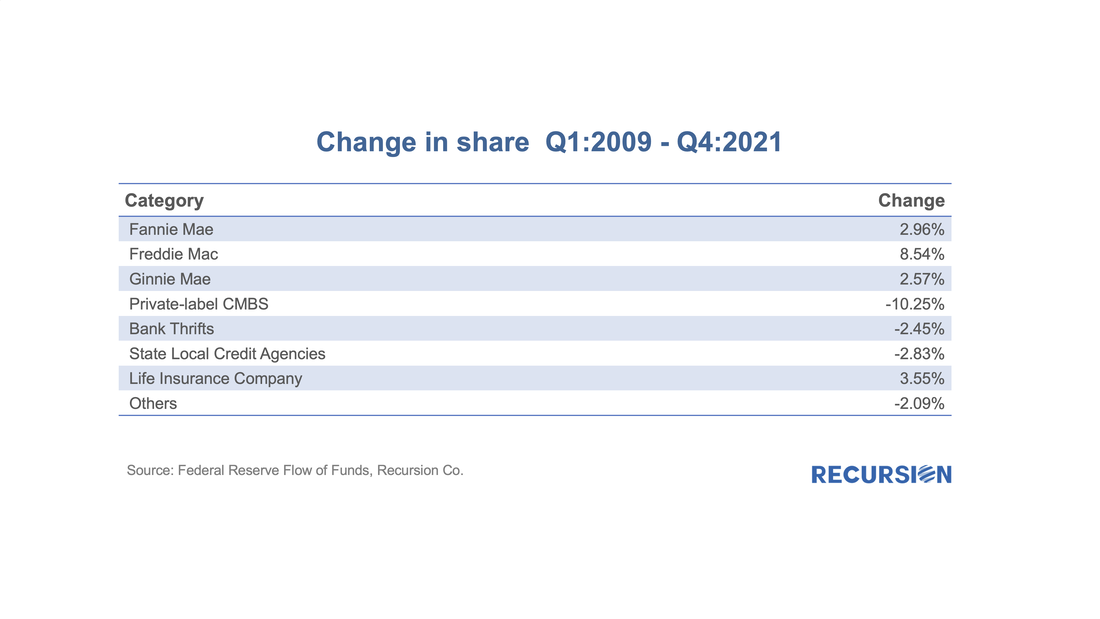
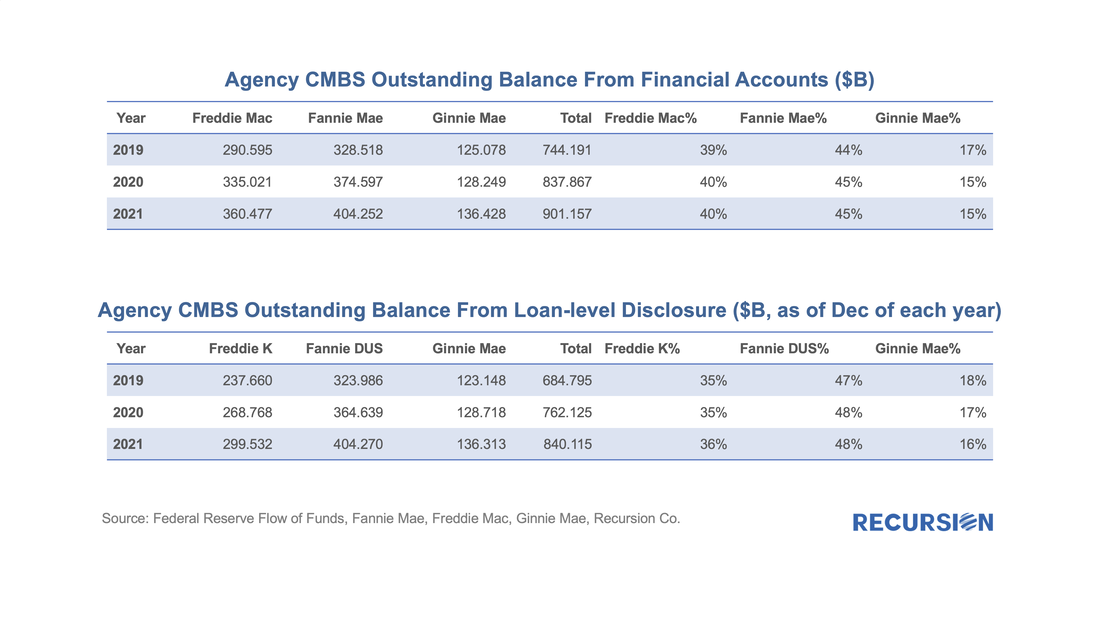
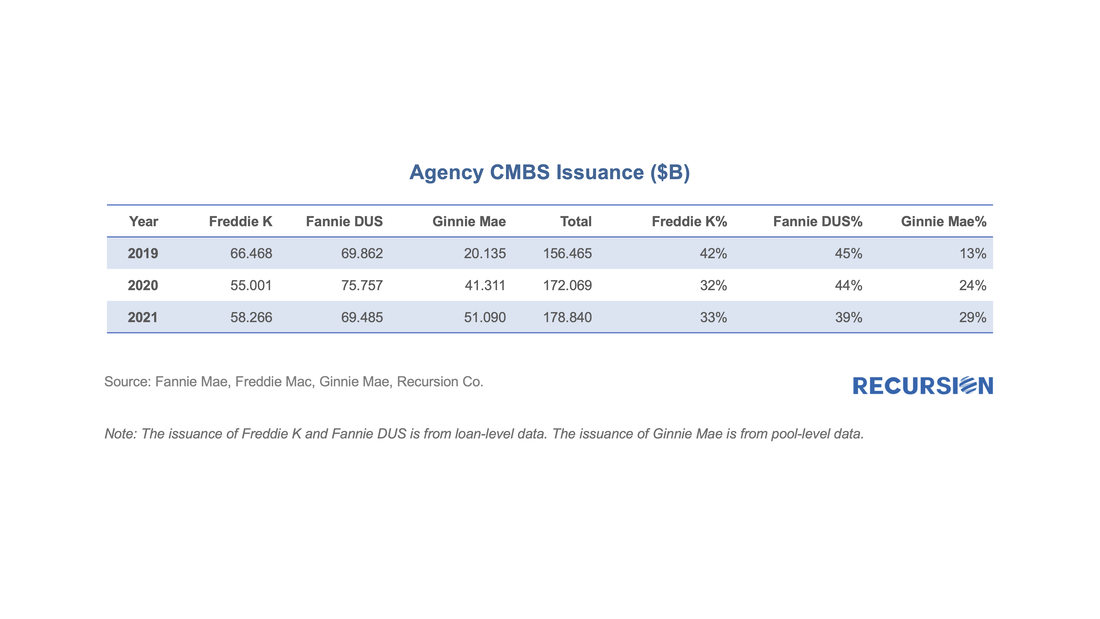
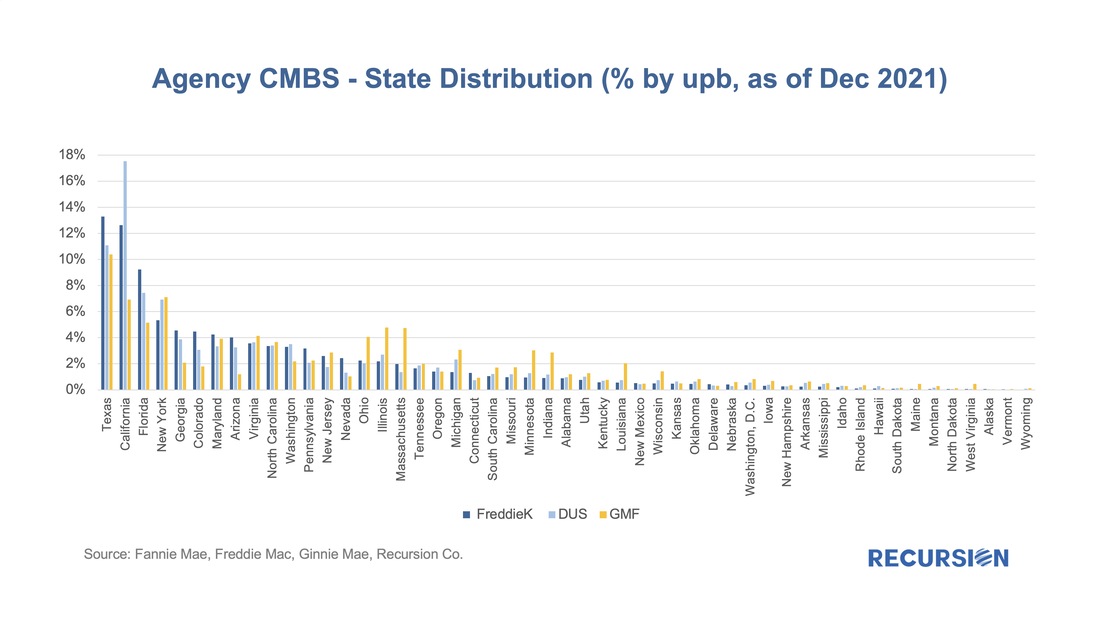
While surging house prices continue to be the focus of market participants, the rental market is increasingly attracting the attention of policymakers, both because of the impact on inflation[1] and the importance of this market for the economic wellbeing of lower-income households[2]. In both cases, there is a widespread consensus regarding the need for new supply to ameliorate these problems. There are many factors that come into play regarding the construction of new rental units, including the availability of private and public sources of credit. As part of its quarterly release of the "Financial Accounts of the United States"[3], the Federal Reserve publishes data that allows us to break down the trend in total multifamily lending into major categories of credit risk holders: Over the period Q1:2009 – Q4:2011, outstanding grew by just $9 billion to $863 billion. The pull back of private lenders in this space of -$49 billion is more than offset by an increase of Agency risk holdings of $58 billion in the wake of the Global Financial Crisis. Over the period Q1:2013-Q4:2021, MF debt volumes more than doubled to $1,882 billion with both private and public sector participation, although the Agencies captured more than half of this increase. Over the entire period, shares for the major categories increased for insurance companies and Agencies and declined across all others, most notably private-label CMBS. It is notable that while all three agencies gained share, Freddie Mac's increase was more than that of Fannie Mae and Ginnie Mae combined. To get a better handle on the nuances in these trends, we have downloaded and cleaned up the loan-level multifamily data provided in the Agency disclosures. Lenders who seek an Agency wrap must meet particular standards set by Government agencies (largely FHA) or the GSEs, including the Fannie Mae Delegated Underwriting and Servicing (DUS) program[4] or the Freddie Mac K-program[5]. Below find annual summaries of outstanding balances over the 2019-2021 period comparing the data from the Financial Accounts with that from the Agencies: The data are extremely close across data sources for the Fannie Mae and Ginnie Mae programs. In the case of Freddie Mac, we have downloaded the loan-level data for the K-program, which comprises the bulk of Freddie multifamily loans but have not yet looked into the other smaller programs that are included in the Financial Accounts data. We also look at the multi-family issuance for the three agencies: Here we see that the Ginnie Mae share of new issuance has climbed substantially since the onset of the Covid-19 pandemic, accounting for about 60% of the total gain in share attained at the expense of Freddie Mac (K-deals only) and 40% from Fannie Mae. Even though Ginnie Mae issuance experienced relatively rapid progress, the growth of the total outstanding balance is much slower than the book of Fannie or Freddie, due to the much faster payoff rate of its loans. Having the loan-level data allows us to look much deeper into credit formation in this space. To demo this power, we peer into the geographic distribution of outstanding loans: Many takeaways can be obtained from this chart, but an of particular interest is that the GNM share exceeds that of the GSEs in many midwestern states (Ohio, Illinois, Minnesota, Indiana), while the opposite occurs across much of the sunbelt (California, Florida, Georgia, Arizona). This only scratches the surface of what we can do with the loan level details reported for the $800B multi-family notes. Even the street addresses of the properties are reported and tracking the refinancing activities between different agencies is possible after careful cleaning of the data. More follow-up research will be provided in future posts. A final point about multifamily policy worth mentioning is that the distribution of credit between the private and public sectors is subject to direct policy intervention. The gain in share on the part of the Agencies over time has led to concerns about "crowding-out" of private lenders, and as a result, FHFA has imposed annual caps on the multifamily activity of the GSE's[6]. Whether these caps support the private sector or instead reduce credit availability in aggregate remains a topic of considerable discussion. [1] https://www.dallasfed.org/research/economics/2021/0824 [2] https://www.philadelphiafed.org/community-development/housing-and-neighborhoods/household-rental-debt-during-covid-19 [3] https://www.federalreserve.gov/releases/z1/ [4] https://multifamily.fanniemae.com/financing-options/conventional-products/dus-mbs [5] https://mf.freddiemac.com/investors/k-deals.html [6] https://www.fhfa.gov/Media/PublicAffairs/Pages/FHFA-Announces-2022-Multifamily-Loan-Purchase-Caps-for-Fannie-Mae-and-Freddie-Mac.aspx Recursion is a preeminent provider of data and analytics in the mortgage industry. Please contact us if you have any questions about the underlying data referenced in this article. |
Archives
July 2024
Tags
All
|
RECURSION |
|
Copyright © 2022 Recursion, Co. All rights reserved.

 RSS Feed
