|
Recursion has undertaken an intensive effort to compute the size of the Agency CMO market back to 2000. The size of the Agency CMO market is calculated by building up from the loan level. This data is provided by agency disclosure of the portfolio of each collateral group and collected from text files, pdfs, and other formats across single-family and multifamily CMOs. The formats of the disclosure files differed across agencies and changed over time, presenting a challenge to unify. 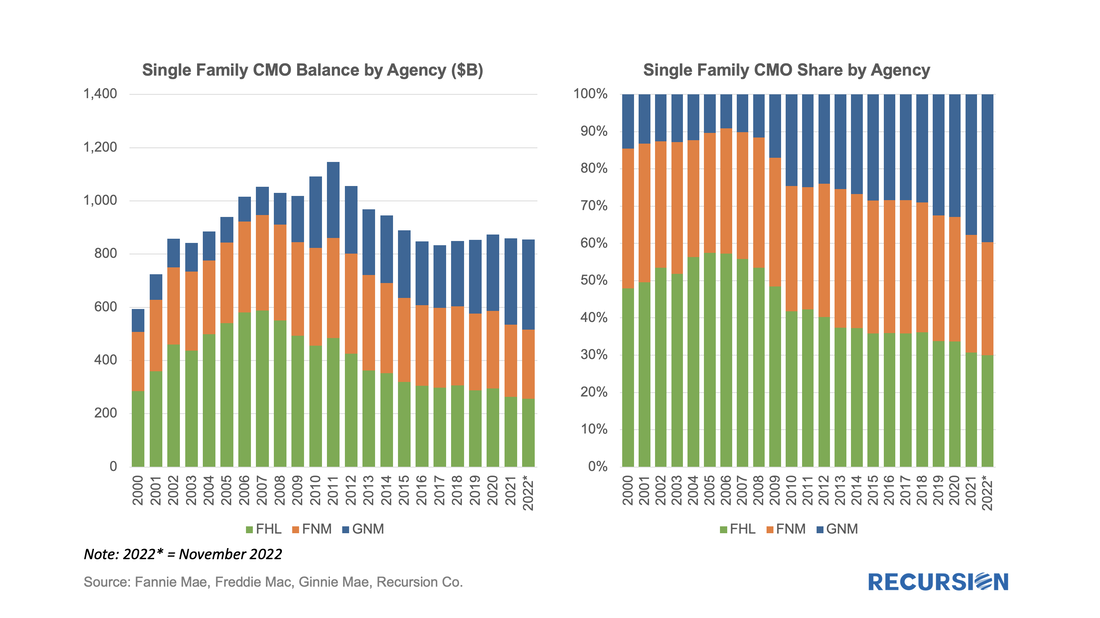 To read the full article, please send an email to [email protected] In a previous note, we pointed out that the ARM share of single-family MBS issuance, while on an increasing trajectory, was well below that achieved in prior periods of rising interest rates[1]. There are several possible reasons for this, including bank demand for these types of loans. The new supply (less than 1% of total UPB in recent years) we see in agency pools falls well short of demand for floating rate instruments in the current environment. The solution to this problem comes in the form of financial engineering. Our Recursion CMO Analyzer is a useful tool for examining trends in this market. Pooling financial collateral brings a number of advantages to fixed income markets, notably liquidity enhancement. But there are other benefits to be had as well. First, a CMO can tranche the cash flows from mortgages based on specific factors such as maturity dates and interest rates. This allows investors to optimize their investments with respect to their views on these underlying factors. ARM bonds are popular in these structures relative to simple fixed-rate pools: 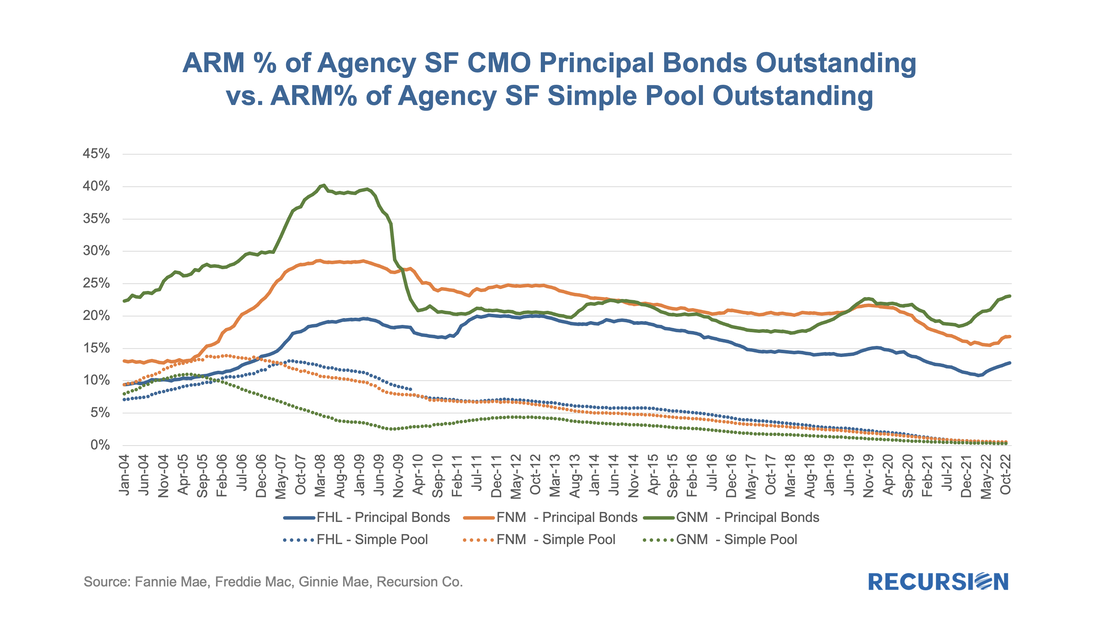 In previous posts, we discussed the trends in Ginnie Mae MBS issuance by loan purpose.[1] Recall that the decision to buy a loan out of a Ginnie pool rests with the servicer. As such, this decision is dependent in part on environmental factors that impact the profitability of this action, notably the interest rate. As loans get bought out at par, there is a greater incentive to purchase loans out of pools and get them into reperforming status when rates are low than when they are high. This relationship can be clearly seen in the following graphs:  Following the recent publication report of our CMO league tables[1], our next look at the structured mortgage product market is with HECMs. This is a very specialized product, but it offers distinct investment opportunities for investors to benefit from fundamental analysis of the unique characteristics of these "reverse mortgages". As the number of outstanding loans in this class is very much less than that of "forward" mortgages, it stands to reason that many HECMs would be packaged into CMOs to enhance diversification, and indeed that is the case: 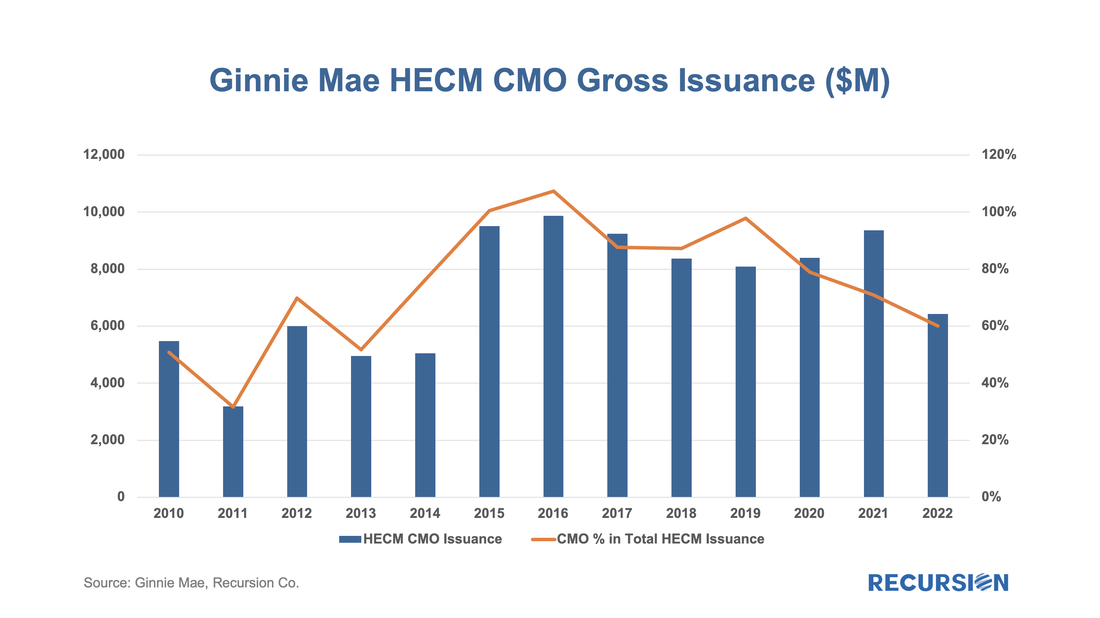 As pool issuance reached historical high amid record low mortgage rate with the onset of Covid-19 in 2020, Agency CMO took off correspondingly. Investors apparently looked favorably on the diversification opportunities in structured products, given the heightened uncertainty during that time. In 2021 total issuance dipped, and so far through the first eight months of 2022 volumes are well behind last year’s pace. The GSE commingle fee set force in June slowed down Fannie and Freddie’s CMO issuance significantly. However, as a share of total issuance, CMOs are holding up quite well. 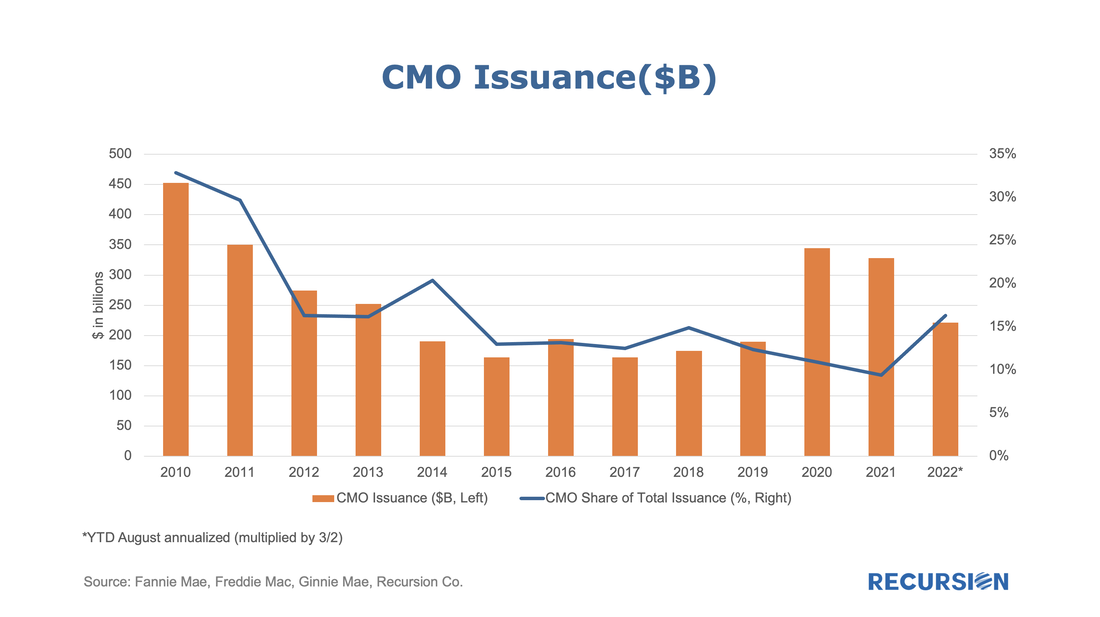 The Agency residential MBS market is over $8.3tn in February 2022 and is the second most liquid fixed income market after Treasuries. The market shares of the three agencies are: 1. Fannie Mae 3.5tn, ($1.060B in Fed Portfolio, $2,120B in Pools, $270Bin CMOs) 2. Freddie Mac 2.7tn ($840B in Fed Portfolio, $1,630B in Pools, $270B in CMOs) 3. Ginnie Mae 2.0tn ($560B in Fed Portfolio, $1,090B in Pools, $330B in CMOs) 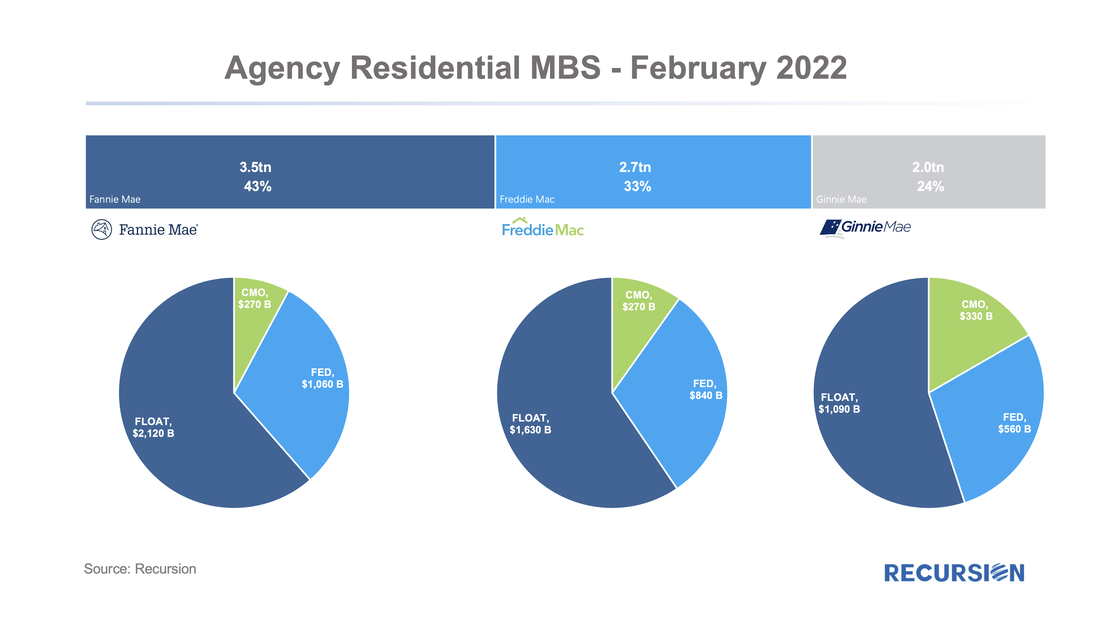 In a recent note, we pointed out how a measure of the success of the Unified Mortgage Backed Securities (UMBS) project was the narrowing in the CMO Lockup Rate between Freddie Mac and Fannie Mae[1]. For many years, Fannie Mae benefitted from the liquidity advantage its security maintained compared to that of Freddie Mac, based on its long-standing market leadership position. To compensate, Freddie Mac locked up more of its securities in CMO’s, in an effort to create a supply-constrained premium in its own securities. The degree of success achieved using this strategy could be measured in terms of changes in the “Traditional Share”. “Traditional Share” is a terminology widely used within Fannie and Freddie, that measures the market share held by Fannie Mae compared to its smaller rival. For example, the Traditional Share of 60, means loans guaranteed by Fannie Mae contribute to 60% of the GSE book, while those guaranteed by Freddie Mac contribute 40%. For the purposes of this note we will measure this in terms of loan count for purchase mortgages only. In 2014, FHFA announced the establishment of a new securitization infrastructure[2] for all mortgage loans backed by single family residences into a new common security. Historically, the Traditional Share had stood at about 60%, but at that time it had risen to over 70%, putting Freddie Mac into a dire situation. With that announcement, the share started to decline, and by the time the UMBS was launched in 2019 the share had eased back towards the 60% level. As a result, Freddie Mac faced reduced pressure to lock its securities up in CMOs, and the gap between this activity and that of Fannie Mae was about halved over the 2014-2019 time frame. Subsequently, the question was whether investors would maintain an indifferent posture between the delivery of Fannie Mae and Freddie Mac UMBS. Lingering fears about the possibility of so-called specified trades faded along with narrowing performance differences between the two agencies, and in recent months the Lockup Gap has almost disappeared. This was recently met with a significant plunge of 8.6% in the Traditional Share in Q3 2021 to a record-low 47.4%. 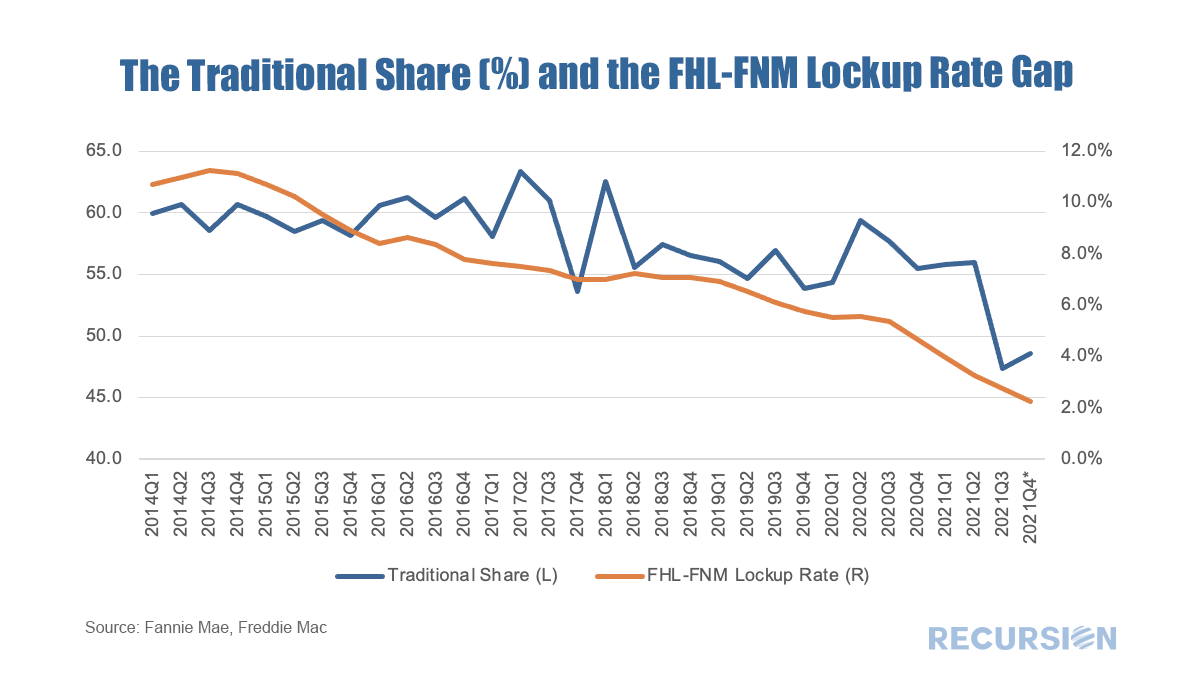 As we mentioned in our previous blogs, Recursion’s proprietary tools Cohort Analyzer, and Pool Level Analyzer can analyze FED and CMO portfolios recursively down to the “simple pool” level. There are a wide range of applications of these powerful tools. We previously demonstrated how to calculate FED portfolio and CMO lockup rates at the macro level. Another important application is to study the collateral of mortgage bonds directly at the loan level in order to support investor’s trading decisions.  To read the full article, please send an email to [email protected]
|
Archives
July 2024
Tags
All
|
 RSS Feed
RECURSION |
|

Copyright © 2022 Recursion, Co. All rights reserved.