|
In recent months, we have witnessed increasing attention being focused on the Government mortgage programs, particularly VA. Two issues in particular have generated considerable discussion. First, last year VA allowed its forbearance programs to expire without a backstop for distressed borrowers wishing to avoid foreclosure. Instead, VA implemented a voluntary foreclosure moratorium for their servicers, which has been extended to the end of 2024. And very recently, VA implemented a new program, the Veterans Administration Servicing Purchase Program (VASP), to help households in need, with full availability required by December 31, 2024[1]. Second, there has been a noticeable pickup in VA prepayment speeds compared to other major programs, including FHA[2]. This is particularly evident in higher coupon securities:  In Mortgage Winter, affordability is job one for housing policy. In our most recent quarterly macro report, we noted that the share of loans with buydowns posted significant increases across all three agencies in the second half of 2023[1]. To see how widespread these sorts of supportive actions are, we look at down payment assistance (DPA) programs. To start, the GSEs only allow downpayment assistance through specified second lien programs: “Community Seconds” for Fannie Mae[2] and “Affordable Seconds” for Freddie Mac[3]. While there are technical differences between programs, they are second liens funded by an approved list of government agencies, nonprofits, and private sector lenders. The liens are subordinate to the first mortgage and face various limits on combined LTV (CLTV) and note rates. These liens are neither securitized by the Enterprises nor directly reported in the data disclosures. However, we could identify those (we call it “piggyback”) by looking for loans with the original combined LTV higher than its original LTV. Below find the number of owner-occupied loans containing “piggyback” liens for the HFA programs, the low-income programs (FNM “Home Ready” and FHL “Home Possible”), and other[4]: 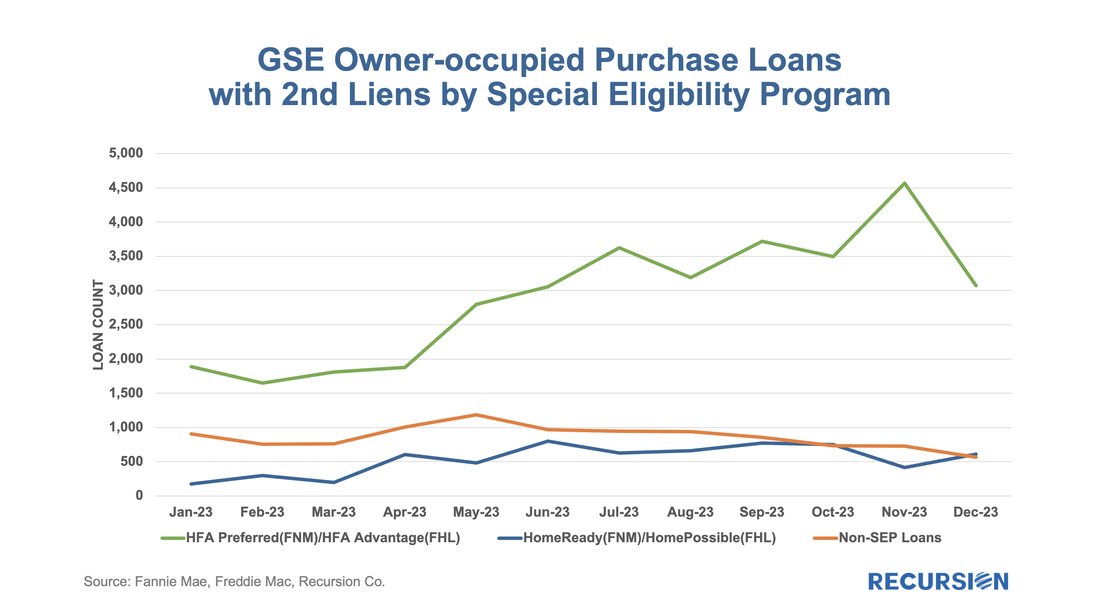 In a recent post, we noted that delinquency rates for two classes of FHA modified loans were rising faster than for the general population, namely reperforming (RG) and extended term (ET) loans[1]. In this post, we dig down into details to get a closer view of the behavior of lenders in these categories. We start with RG loans. As noted in the previous blog, the program was launched in January 2021, allowing borrowers who had outstanding unpaid balances from the Covid period but six consecutive months of payments to roll the balances into a “partial claim” due when the loan is extinguished. At that time, a new “RG” custom pool category was formed to issue these mortgages. Starting in February 2023, the seasoning period was reduced from six to three months and these loans became eligible to be issued in Ginnie Mae multi-issuer pools. The share of these loans in multi-issuer pools reached over 2/3 at the end of 2023. Delinquency rates are modestly higher for RG loans in multi-issuer pools relative to RG pools even though they are relatively new. One topic that comes up is which servicers are most involved in this loan type and how much variation in behavior can be seen across these institutions. Below find the list of the top 15 institutions issuing RG loans and the distribution of each by pool type 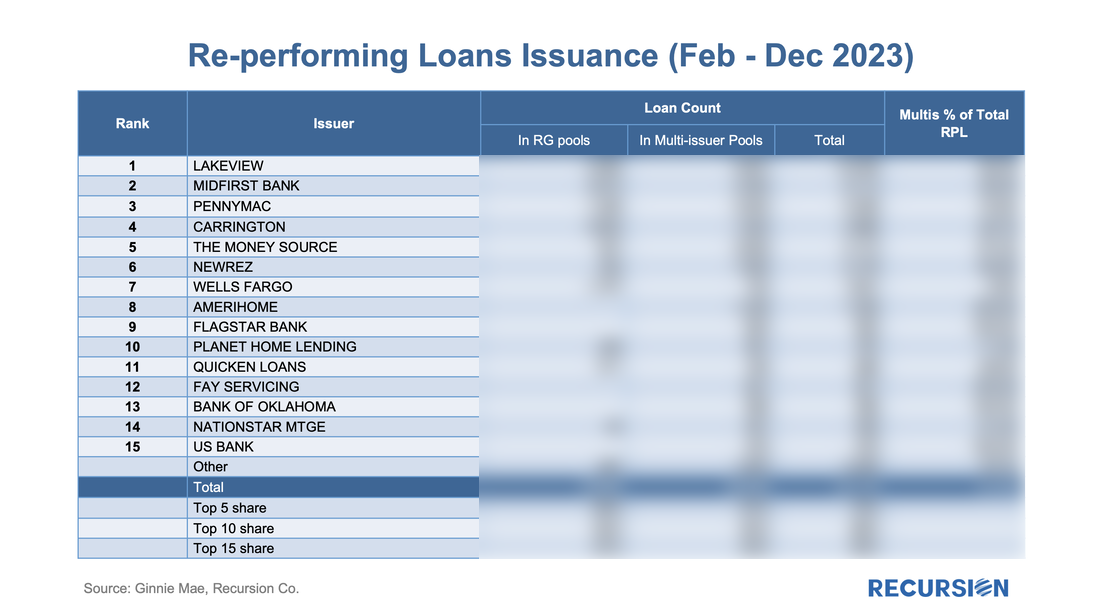 The single-family agency MBS market benefits from a set of consistent standards that allows traders and analysts to make straightforward judgments about relative value between securities. This is particularly the case for the conforming mortgage market since the single security UMBS market was launched in June 2019. The result is a market that is very liquid, supporting homeownership and affordability. There is a very different situation in the multifamily space. The programs are very distinct across, and even within Agencies. This is particularly the case for the Ginnie Mae program, which consists of construction loans that are lines of credit that are drawn upon, and then converted to project loans. The two largest programs within the GSE multifamily space are the Fannie Mae DUS program[1], where losses are shared between Fannie Mae and the underwriting banks, and the Freddie K-deals, where losses are shared with investors[2]. Both Agencies have numerous smaller programs as well with their own distinct characteristics. In the single-family space, the unit of analysis is the mortgage. These are pooled, and pools and loans are sometimes, in turn, aggregated into CMOs (We classify highly-structured deals such as Freddie K, Q, ML, SB, etc., as CMOs, too). Investors have a complete picture of activity in this market. In the multifamily space, however, the picture is murkier. There are two reasons for this. First is the multitude of different programs across the Agencies as cited above. The second is that a consistent data set for multifamily loans across the three agencies is not easily produced, as loans are typically securitized into pools, however, Freddie tends to securitize loans directly into structures more like CMOs, such as Freddie K, Q, SBL programs[3]. A year ago, we posted a note that described our bottom-up approach to sizing the multifamily market and validated this by comparing our calculation to similar figures obtained from the Federal Reserve Z.1 report. We are pleased to report that this approach continues to provide an accurate picture of total market size as our figures for the third quarter have consistently aligned within a margin of 0.5% for the past three years. 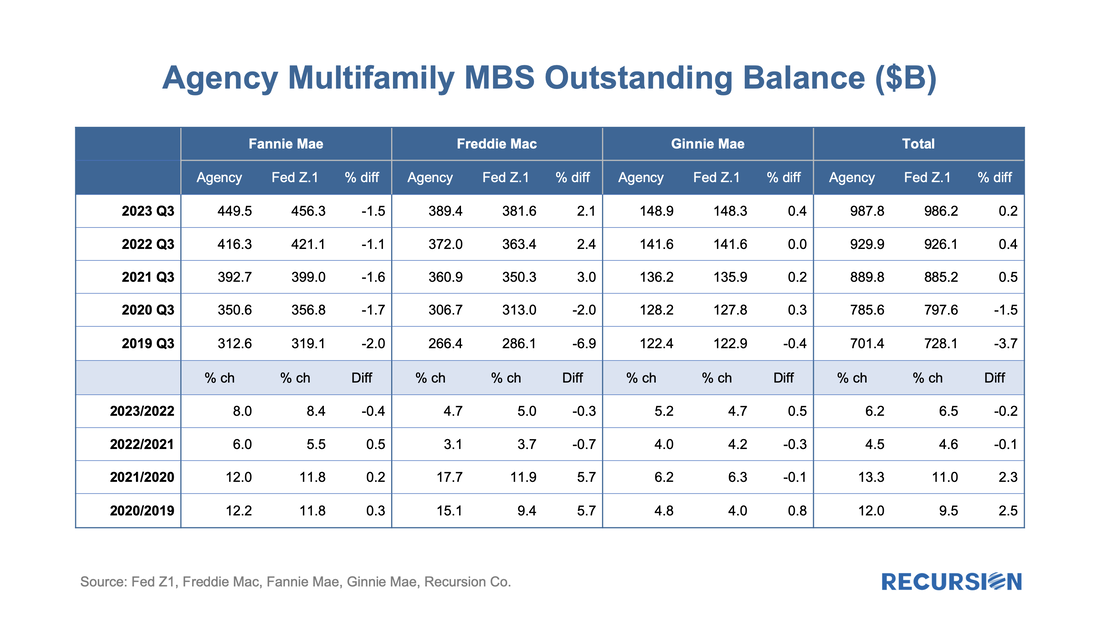 On June 29, 2023, both Fannie Mae and Freddie Mac announced enhancements to their MBS disclosures starting with the September monthly release[1]. The data covers active pools issued back to January 2022. As rates were quite low prior to this time, these disclosures cover the relevant period of high demand for buydowns: 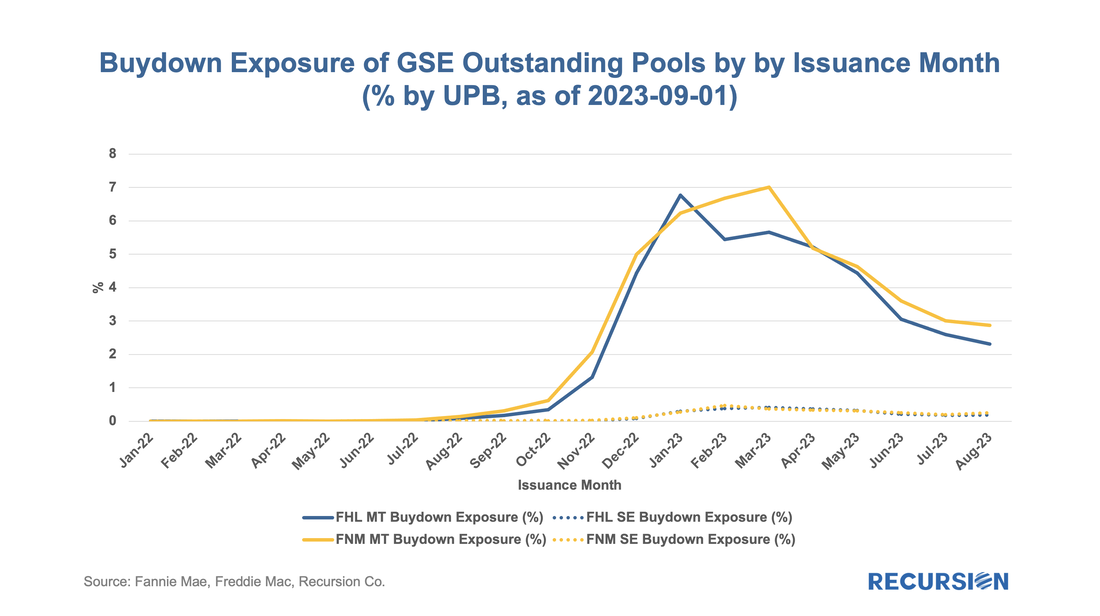 We’ve written many, many times about the inexorable rise in the role of nonbanks in the mortgage market[1]. A variety of factors have contributed to these gains, including superior technology, a relatively less oppressive regulatory environment, and Covid-19 chasing people out of bank branches online. This picture can be a little blurry, however, depending on the way you look at the market. There is, for example, the distinction between servicing book shares and origination shares. Our agency disclosure data doesn’t provide information on originators, but we can use “seller” as a proxy. The table below looks at the trends in outstanding portfolio and issuance for the conforming and Government markets over the period January 2022 – July 2023: 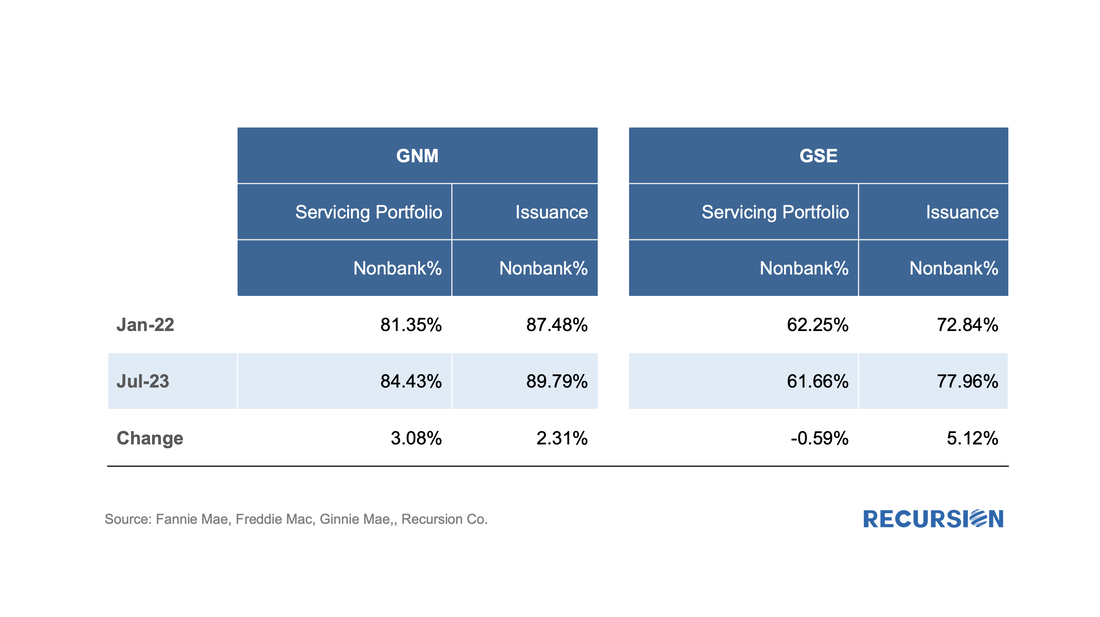 Overview The release of the Financial Accounts of the United States (also known as the Z.1[1]) is always an opportunity to learn about important structural changes in the mortgage market. This is particularly the case in our current environment of high home prices and borrowing costs which we call “mortgage winter”. In this note, we focus on the breakdown on the ownership of risk for single family mortgages. This is not the share of ownership of MBS; it is who bears the credit risk for the loans. Unsurprisingly, the growth in single-family mortgage credit outstanding in Q1 grew by the smallest amount in almost 7 years in the first quarter of 2023: 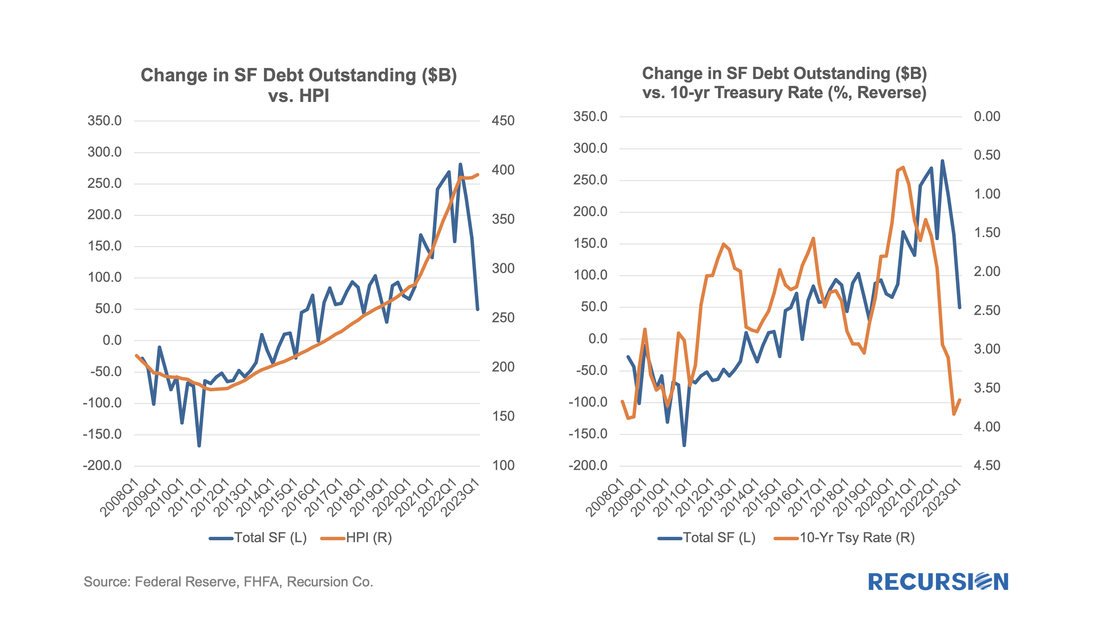 The release of the Agency performance data in early May provided confirmation that the dip in Early Payment Defaults[1] we have witnessed over the last three months ended a 16-month long uptrend in this statistic for FHA loans. A similar but far more muted pattern can be seen for VA and conventional mortgages. In a previous post, we speculated that the uptrend was correlated with the higher inflationary trend observed since early 2021[2]. Below please find an update of the chart: 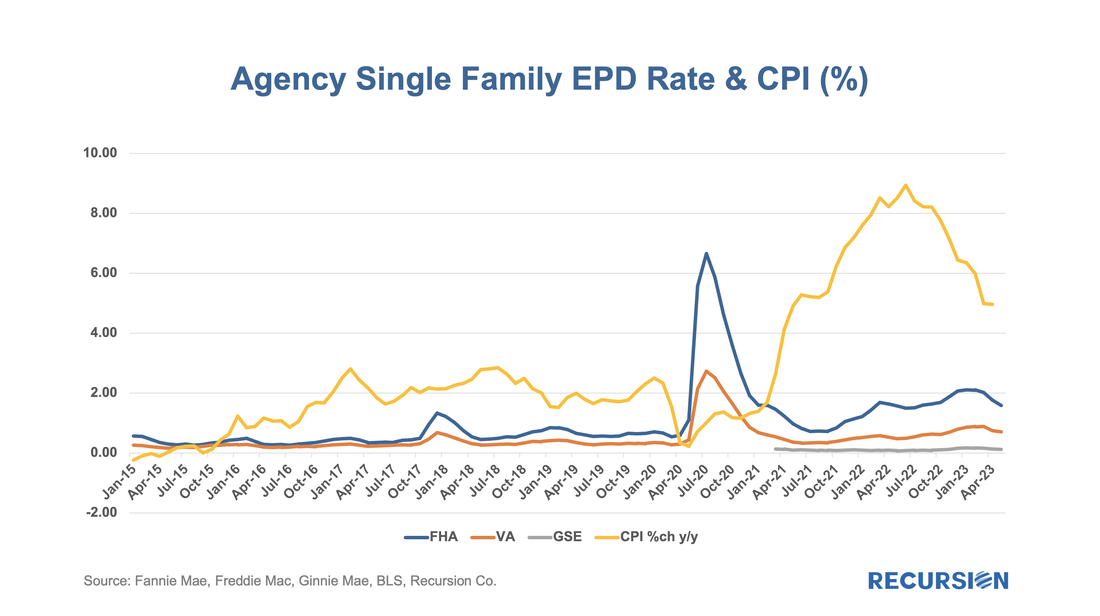 |
Archives
July 2024
Tags
All
|
 RSS Feed
RECURSION |
|

Copyright © 2022 Recursion, Co. All rights reserved.