|
On June 29, 2023, both Fannie Mae and Freddie Mac announced enhancements to their MBS disclosures starting with the September monthly release[1]. The data covers active pools issued back to January 2022. As rates were quite low prior to this time, these disclosures cover the relevant period of high demand for buydowns: 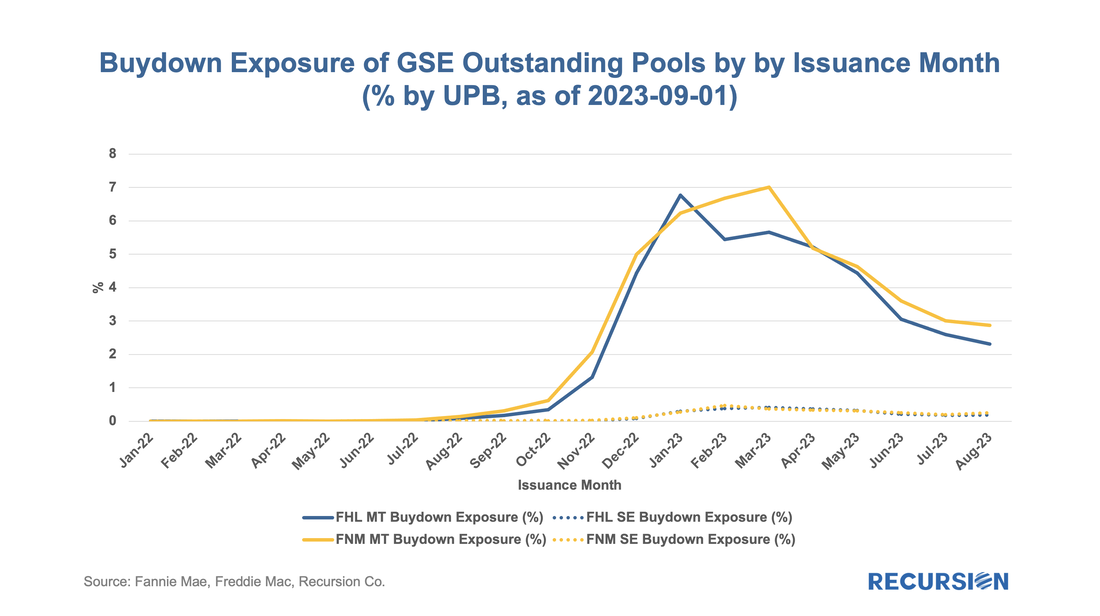 Note that there are two flavors of buydowns plotted here. First, we have “MT” buydowns, which for Fannie Mae means “Moderate” while for Freddie Mac “Temporary”. These are buydowns where the interest rate is reduced by less than or equal to 2% and for less than or equal to 24 months. A smaller share consists of “SE” buydowns, which for Fannie Mae means “Significant”, while for Freddie Mac “Extended”. These are buydowns in which the interest rate reduction is greater than 2% and less than or equal to 3% or for a period greater than 24 and less than or equal to 36 months. Kind of like “LLPAs” and “up-front fees.” Impress your friends that you know the difference. Most of the time, FNM has taken in a modestly greater share of loans with buydowns than Freddie Mac over the past year. Usage by Freddie Mac peaked in January of this year, while that for Fannie Mae peaked in March. It’s interesting to note that the share has declined over the last six months, although high-interest rates have persisted. It’s possible that growing regulatory scrutiny of this practice has resulted in increasing caution on the part of lenders. It is also possible that the spike in buydowns earlier this year was associated with refinances for borrowers with high note rates, and that this effect has run its course. As the data are available only at the pool level, it’s impossible from these disclosures to have confidence in any explanation. But read on. Next, we add GNM pools to the mix and compare these to the total for the GSEs, by both UPB and loan count. 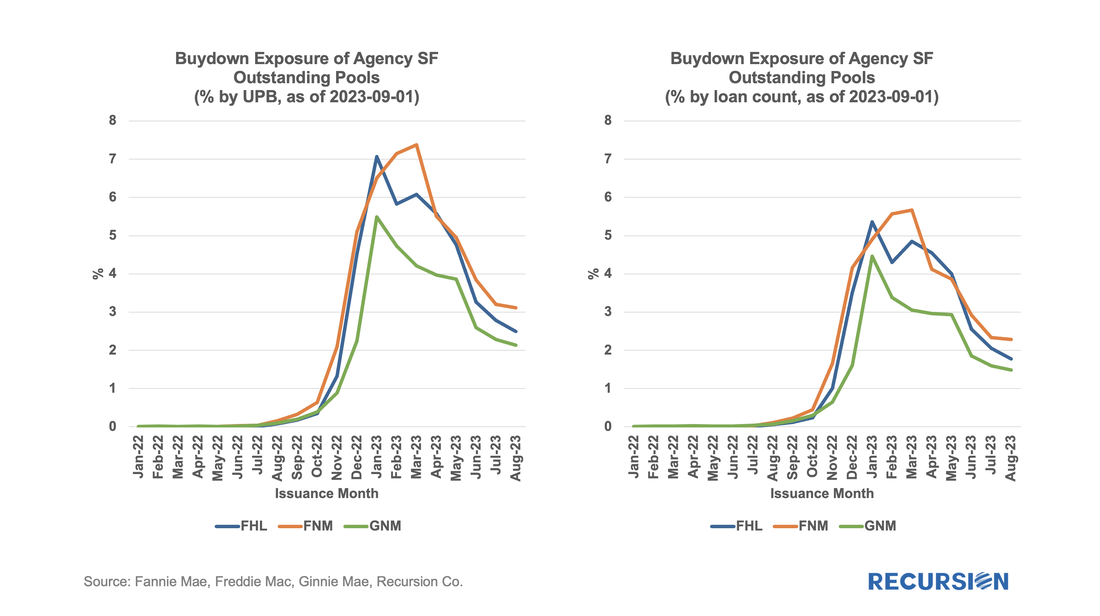 In each case, the share of outstanding by issuance month is greater than by loan count, implying that buydown loans are larger than others. For YTD 2023 through August, the average difference in shares is 1.25% for Fannie Mae, 1.05% for Freddie Mac, and 0.94% for Ginnie Mae. There are also distinctions to be found in the coupon distributions of the buydown shares by Agency: 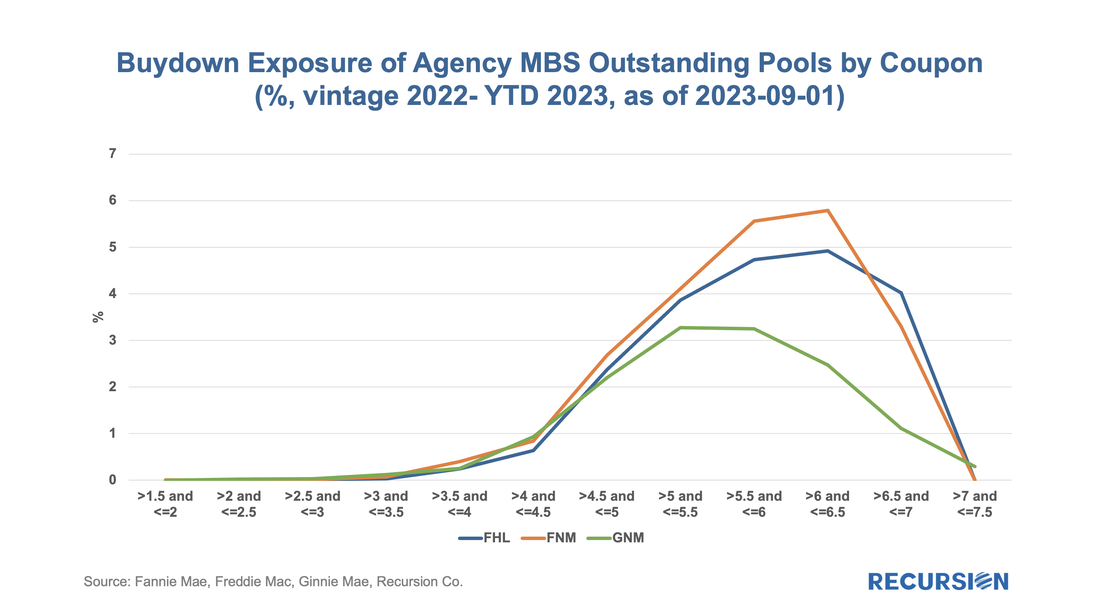 Note that these figures are a portfolio (stock) calculation for the period January 2022 – August 2023, as of 9/1/23, rather than the flow calculations by issuance month above. The notable takeaway is that the Ginnie distribution is skewed towards lower-coupon pools than is the case for the GSEs. As alluded to earlier, the key question for investors and policymakers is the performance impact of a buydown. As the GSE data is pool-based, there is little to be said in this regard, but we have loan-level data for the Government programs. The metric we use to measure performance is Early Payment Default (EPD), which is a loan that has experienced 2 or more missed payments in the first six months after it was originated: 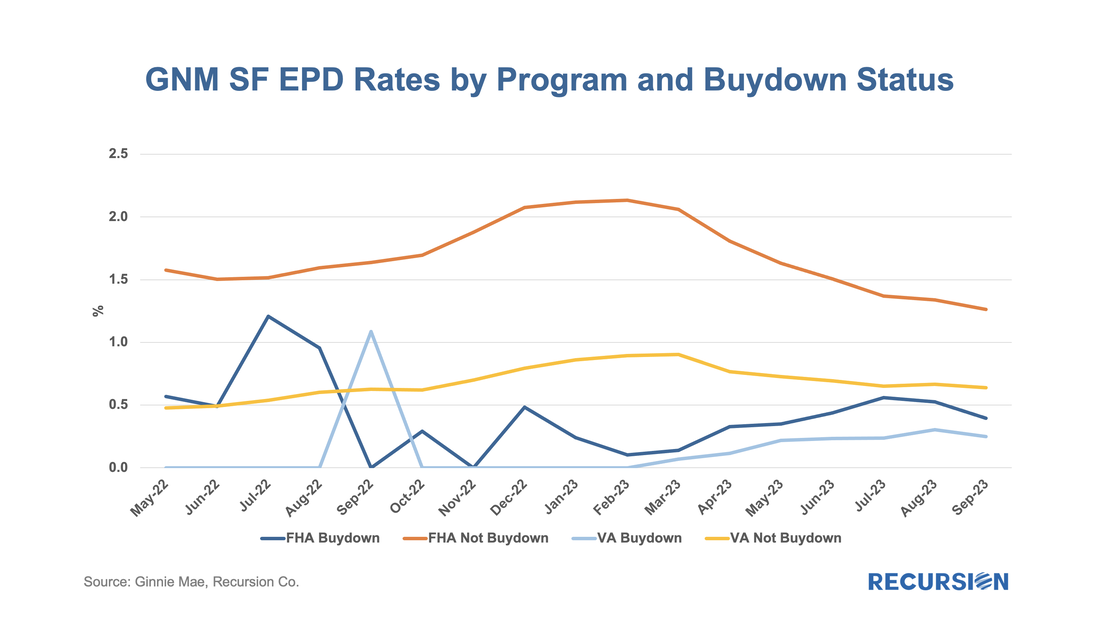 Since buydown volumes didn’t pick up until the fourth quarter of 2022, the EPD calculation will be very noisy until early 2023. But so far, year to date, we have a clear pattern of less stress in the buydown market relative to other loans for both the FHA and VA markets. One clue that this result might occur is the earlier observation that the size of buydown loans is larger than others, implying that they are made available to relatively higher-income borrowers. From the loan-level Ginnie data, we can also look at the credit statistics for borrowers: 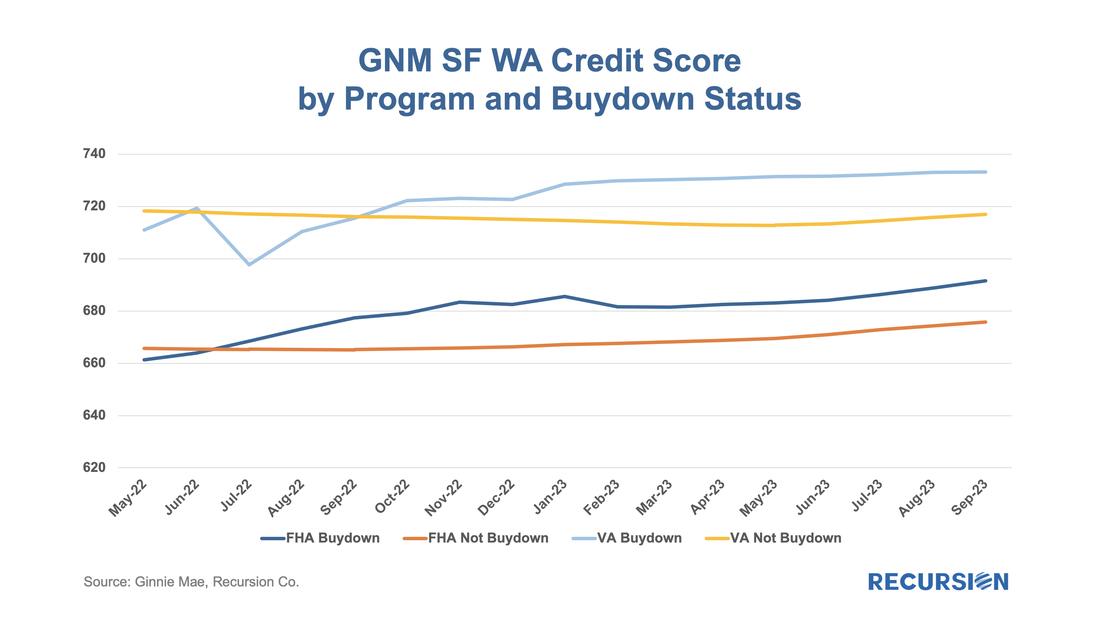 Starting in the fourth quarter of 2022, borrowers obtaining buydowns have, on average, displayed higher credit scores than those without that feature. If interest rates remain elevated, there is certainly risk for borrowers with buydowns, but on average, they are in a better position to bear it relative to other borrowers. While there are substantial differences between the conforming and Government markets, it stands to reason that similar behavior about allocating a riskier product to more credit-worthy borrowers makes sense. The difference to investors is that a more precise analysis of risks related to buydowns is available for Government investors where loan-level data is provided compared to the GSEs where only pool-level metrics are presented. This should shore up liquidity and support pricing for Ginnie securities relative to the GSEs. Going forward, it would be interesting to find out which issuers are taking advantage of the buydown program to supplement their originations. From the investors' point of view, it will also be interesting to study the prepayment speeds of the buydown loans, to see if there is a distinction in patterns between these loans and those without the buydown feature. |
Archives
July 2024
Tags
All
|
 RSS Feed
RECURSION |
|

Copyright © 2022 Recursion, Co. All rights reserved.