|
In a recent post, we summarized the main market indicators from 2023 HMDA[1]. Besides offering a wider view of the mortgage market than contained in the Agency disclosures, HMDA contains a wealth of information about borrower characteristics, harking back to its original purpose of ensuring credit availability across populations. This note provides a look at some of the most-followed characteristics. We start with the race of the borrower. This type of analysis is rather nuanced as HMDA allows for information for up to two borrowers per loan file, with demographic information available for both. The chart below shows the distribution of new conventional and FHA mortgages by the race of the first race category reported by the first borrower only. 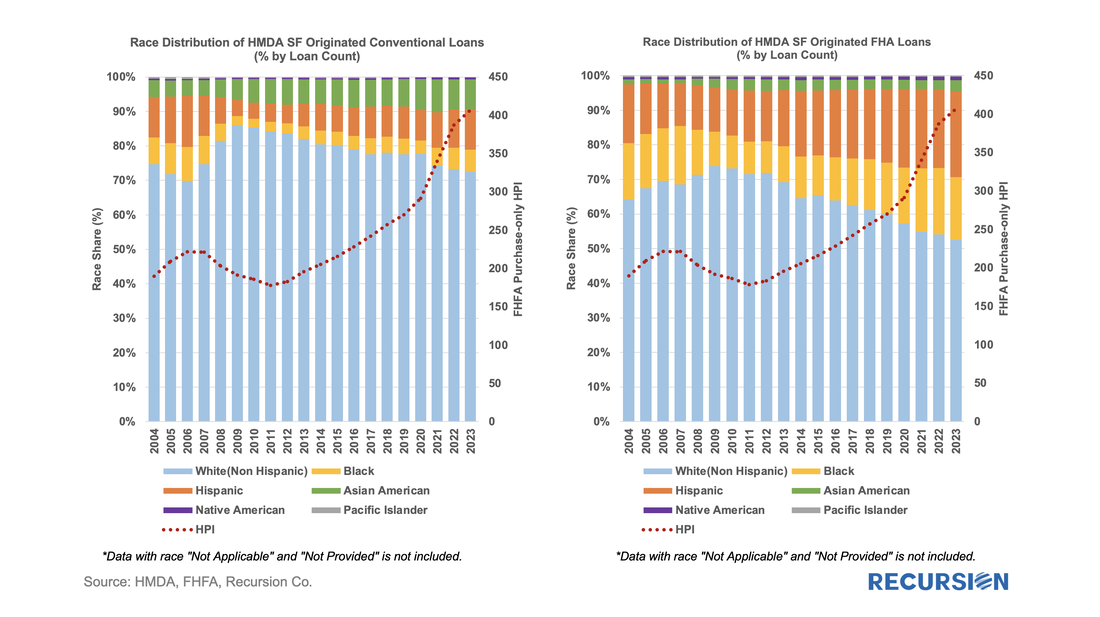 A few salient points can be immediately inferred. First, we can see that the minority share of mortgage recipients has risen steadily over the past 14 years for both loan types. 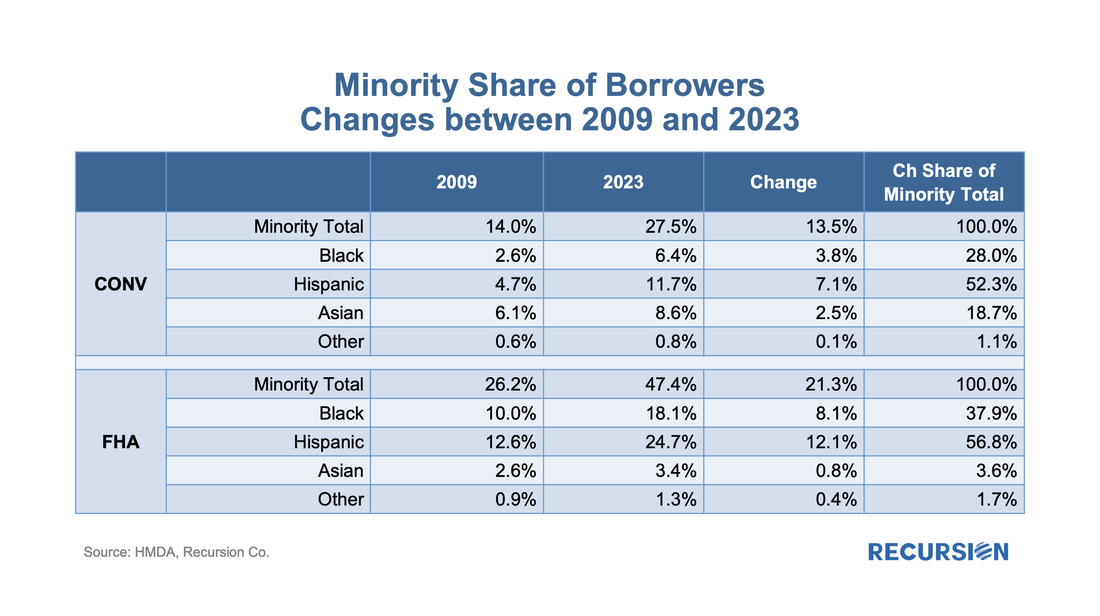 FHA continues to have a higher minority share than conventional, with minority borrowers accounting for almost half (47%) of new loans last year. That said, the share of minority borrowers obtaining conventional loans almost doubled over the 2009-2023 period to 28%, slightly below the 30% peak attained in 2006. In terms of breakdowns by race, the increase in the share of loans going to Hispanic borrowers led minority in both the conforming and FHA markets. Asian borrowers remain more significant to conventional than to FHA. There are many factors that account for these trends, including population growth in each category, policy measures taken to support minority ownership, and overall market conditions. It’s interesting to note that there is a distinct correlation between minority share and house prices in both programs. In the mid-2000, this ended badly as a disproportionate share of minority borrowers were trapped in toxic loans that led to foreclosures when the market collapsed. These concerns do not automatically carry over to the present as credit conditions are much more conservative, and policy is designed to keep distressed borrowers in their homes to the greatest extent possible. Next, we turn to gender. Here is the share of two-borrower loans where the lead borrower identifies as female: 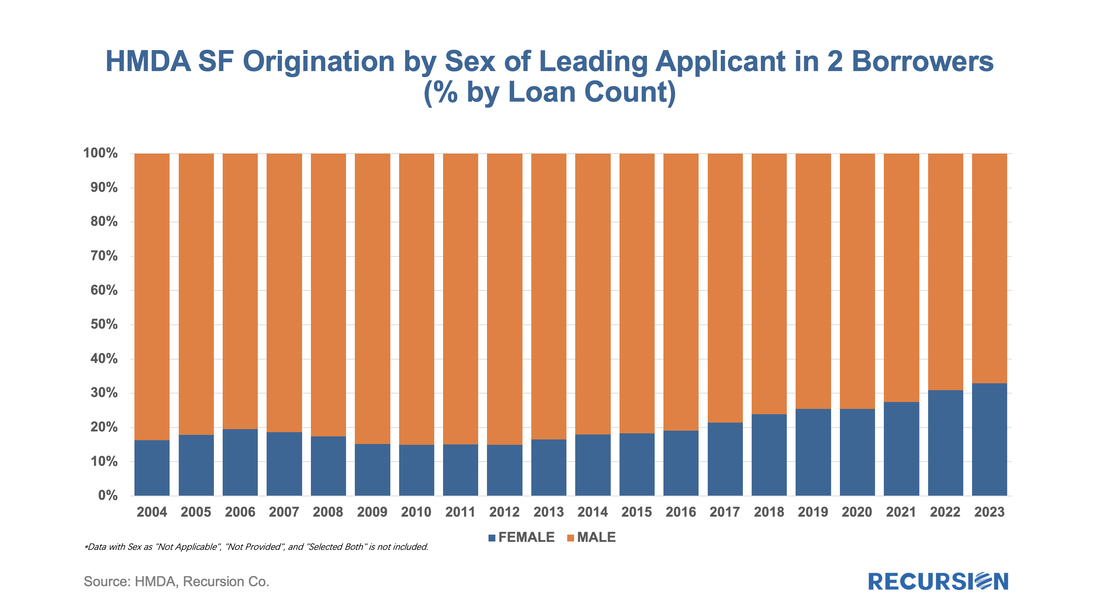 In 2023, the female share rose for the 10th time in 11 years, more than doubling from 14.9% in 2012 to 32.9% last year. HMDA also contains borrower income information, but a detailed analysis awaits the arrival of MSA-level median income data from HUD, which should be out sometime mid-year about when the final version of 2023 HMDA is released. For now, we can look at the distribution of loans by income bucket for the past three years: 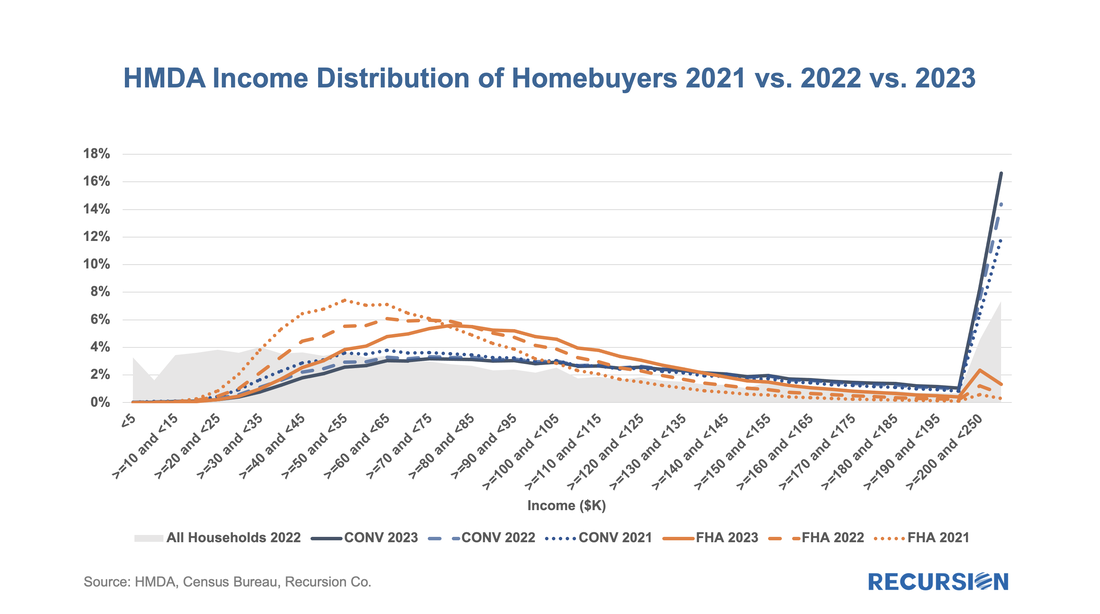 For both conventional and FHA loans, we have witnessed an increase in the weight of the distribution at the right tail, at the expense of the hump in middle-income brackets. This is particularly true for conforming loans where the share of incomes in the greater than or equal to $250 bucket jumped from 11.9% in 2021 to 16.6% in 2023. In the next blog, we will look at manufactured housing, a topic receiving increased policy scrutiny in the current era of unaffordable housing. This rich and robust dataset can accomplish much more. Feel free to contact us with specific questions. We get a lot of requests at Recursion, the bulk of which never make it to these posts, but one that struck home recently was from a regulator who asked what we know about Lahaina. Given the scope of this tragedy, we thought it worth the effort to talk about what we do and don’t have. Specific to that location, the answer is relatively limited. The Agency disclosure data is provided at the state level. The population of Lahaina was 12,700 as of the 2020 Census, out of a population of the Island (County) of Maui of 164,000 and 1.4 million for the state of Hawaii overall. So, this level of detail seems unlikely to be sufficiently granular to provide a basis for analysis. However, it seems we can take a bottom-up approach that may yield something of value. This would be based on the HMDA data. HMDA data has the advantage of granularity down to the census tract level. Out of over 84,000 Census Tracts, we can identify 6 for Lahaina. We can then pull-down originations from HMDA: 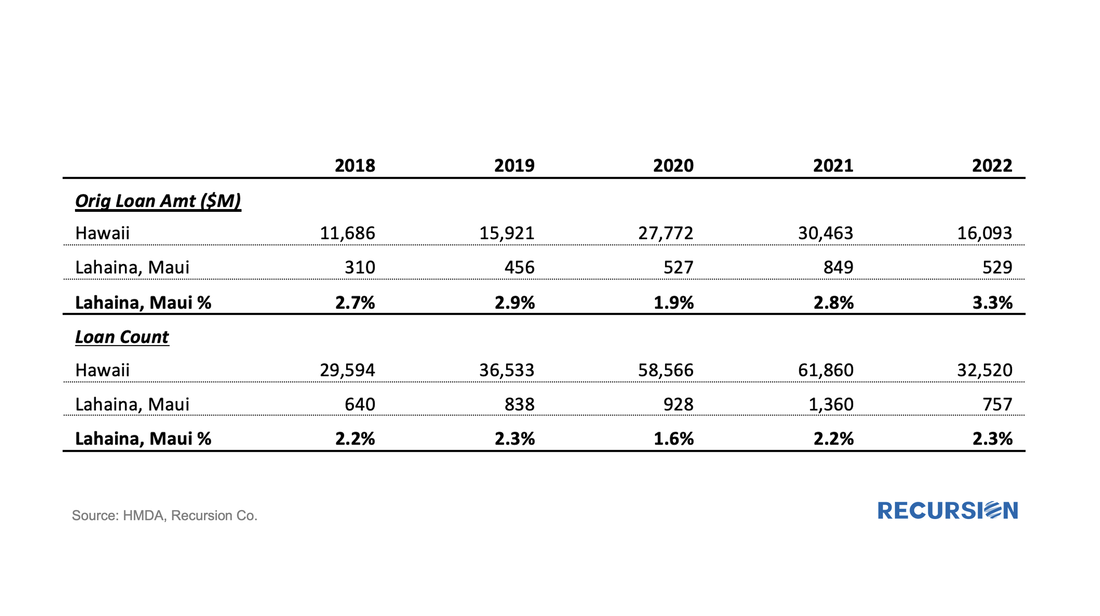 The release of the Agency performance data in early May provided confirmation that the dip in Early Payment Defaults[1] we have witnessed over the last three months ended a 16-month long uptrend in this statistic for FHA loans. A similar but far more muted pattern can be seen for VA and conventional mortgages. In a previous post, we speculated that the uptrend was correlated with the higher inflationary trend observed since early 2021[2]. Below please find an update of the chart: 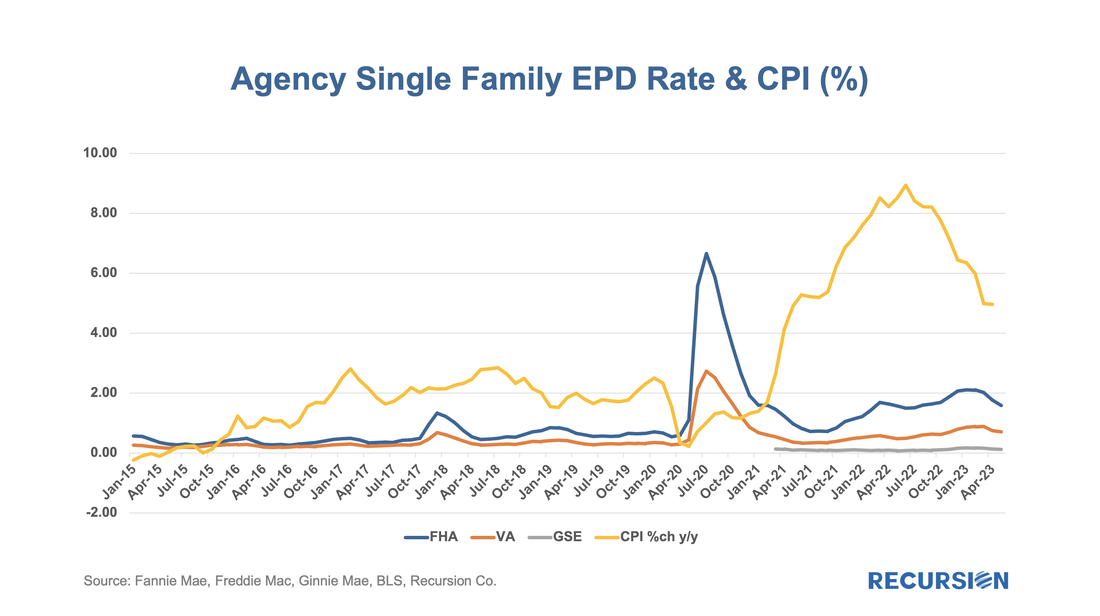 The recent release of “Social Scores” on the part of the GSE’s serves to point out the broad range of ESG issues facing the mortgage market.[1] Of course, this covers a lot of policy territory, and over time investors, lenders and policymakers will have to come to grips with the details associated with these concerns. In today’s post, we look at environmental issues related to the condo market. These issues came to a head with the disaster in Surfside Florida in June 2021, when the partial collapse of Champlain Towers South, a 12-story condo, resulted in 98 deaths and over $1 billion being awarded to victims in a class action lawsuit. Implications for regulation and insurance costs continue to be felt as the event brought home the immediacy of issues surrounding climate change to the general public. In October 2021, Fannie Mae issued a Lender Letter presenting tightened requirements that impact the eligibility of loans made in buildings with five or more attached units[2]. These new policies were “designed to support the ongoing viability of condo and co-op projects…(as) aging infrastructure and significant deferred maintenance are a growing concern across the nation.” These new standards came into effect on January 1, 2022. Among other things, they may land a building on an “unavailable” status if there is significant deferred maintenance, failure to pass local regulatory inspections, or not meeting the 10% budget reserve requirement. To see if there is any impact, we start with a look at Freddie Mac and Fannie Mae condo loan deliveries from January 2019 to March 2023. During this period, the two Enterprises delivered 1.16 million purchase loans securitized by a condo, of which Fannie Mae generally had a share of about 57%: 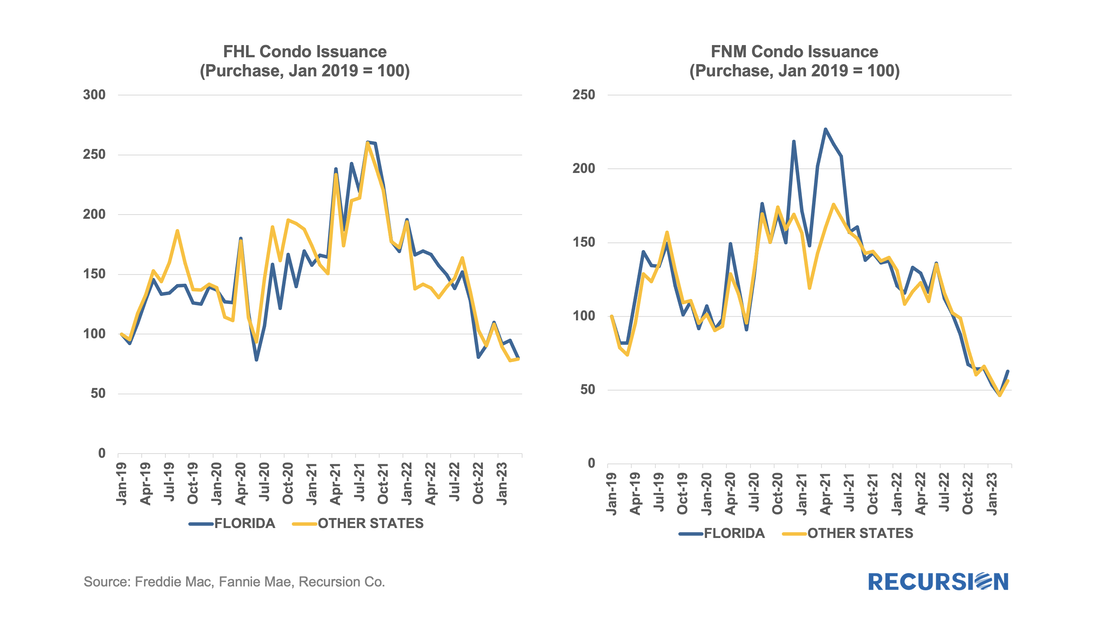 Since the end of last year, the Government Sponsored Enterprises have released so-called “Social Score” Indexes that are made to appeal to ESG investors. Both Fannie Mae and Freddie Mac produce scores at the pool level based on a variety of social metrics. The following methodology summary comes from Fannie Mae[1] (Freddie Mac has adopted the same methodology as Fannie Mae’s):
In a previous note, we looked at mortgage trends derived from the recent release of 2022 HMDA data[1]. Of course, HMDA is a prime data source for analysts and policymakers who seek to understand how social and economic trends interact. The most discussed issue is the distribution of originations by race. Below find a bar chart for the share of originations by race annually from 2004-2022 by loan count:
On February 9, Ginnie Mae announced a new Low-Moderate Income Borrower (LMBI) disclosure[1] “in response to investor interest in having greater transparency into Ginnie Mae mortgages in pools, in particular as part of meeting Environmental, Social, and Governance (ESG) investment mandates”.
“The new disclosures capture the number of underlying loans made to LMI borrowers, the percentage of LMI loan count of total loan count, the unpaid principal balance (UPB) of LMI loans in the mortgage-backed security (MBS), and the percentage of LMI UPB of total MBS UPB.” “LMI households are classified according to the Federal Financial Institutions Examination Council (FFIEC) Median Family Income Report Tables[2] corresponding with the time of loan origination. These disclosures are being provided at the aggregate pool level for Federal Housing Administration (FHA) and U.S. Department of Veterans Affairs (VA) loans originated beginning in 2012.” In other words, grist for the Recursion mill. First, we look at the share of Ginnie vintage 2012 and later pools that consist of loans for which more than 50% are LMBI borrowers: The release of 2021 HMDA data in March set off a familiar round of impactful analysis[1]. However, there are components that cannot be obtained unit the final release in July, including the important category of manufactured housing, a key piece of the policy discussion around affordable housing. Last year we dug into this topic[2] and it would be a good time to update this analysis with new information from the final 2021 release. First of all, manufactured housing experienced a resurgence in 2021: 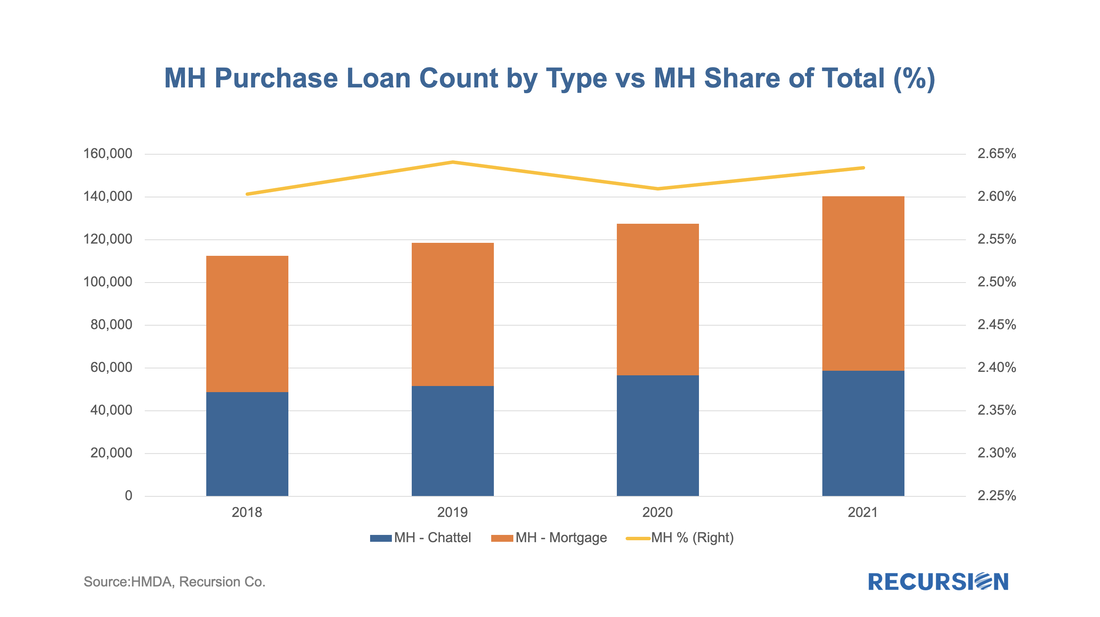 |
Archives
July 2024
Tags
All
|
 RSS Feed
RECURSION |
|

Copyright © 2022 Recursion, Co. All rights reserved.