|
In a recent post[1], we discussed findings obtained with the recent release of 2021 HMDA data. Among other things, we looked at the share of mortgage originations by income group and product type. In this note, we look at the difference in lending patterns between the banks and nonbanks. The incentive behind this approach is policy driven. There is a long history of measures taken to encourage lenders and builders to foster economic development in low-income areas via the housing market. For example, the Community Reinvestment Act (CRA) stipulates that a bank’s performance with regards to compliance of their regulatory requirements depends in part on: “the geographic distribution of loans—that is, the proportion of the bank's total loans made within its assessment area; how these loans are distributed among low-, moderate-, middle-, and upper income locations[2]” To assess this issue, we assign a flag to each of the census tracts designated by HUD as having a greater than 51% share of households with incomes in the Low-to-Moderate (LMI) range in the larger MSA the tract is part of[3], which are called LMI area by HUD, or “low income” tracts by FHFA. Below find a chart of the 10-year trend in the share of loans originated in this category by institution type for conventional and FHA loans: 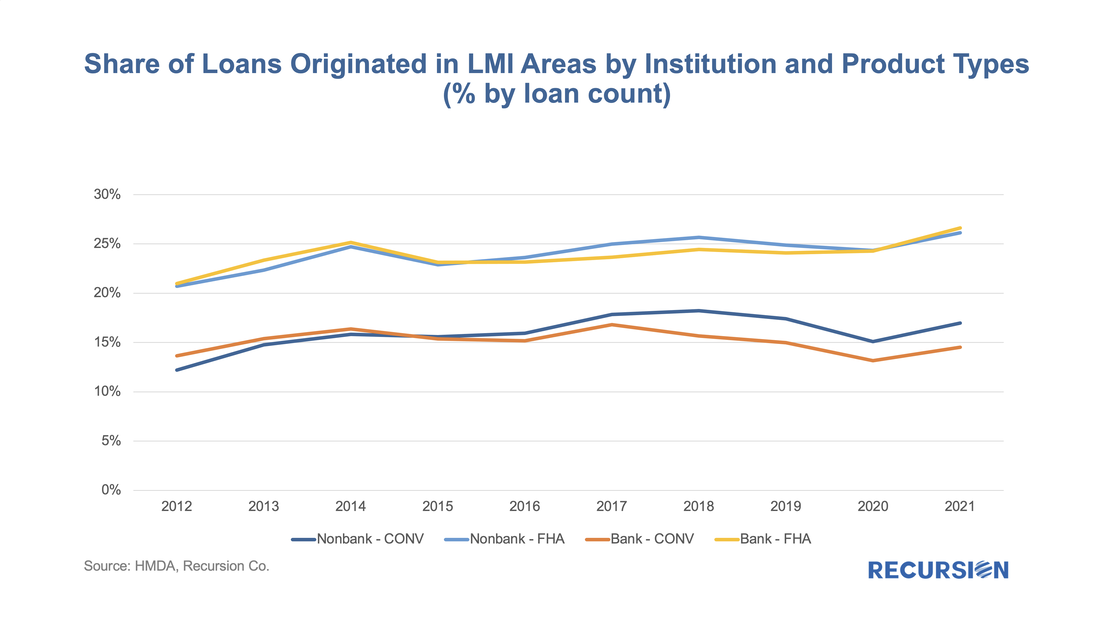 On March 24, the CFPB released HMDA data for 2021[1], with results obtained from 4,316 reporters, little changed from 4,472 reporters in 2020, but well below the 5,505 respondents reached in 2019[2]. There are yet more companies are expected to report to 2021 HMDA. However, our experience from previous year indicates little change in big picture when reporting is finalized. The drop reported in the number of reporters in 2020 vs 2019 is largely due to a reduction in the number of loans that a bank needed to underwrite, requiring a report to be filed starting in 2020. This data is used for market sizing by regulators and market participants, but it also represents a treasure trove of information regarding lender and consumer behavior across a wide variety of economic and market regimes. 2021 was notable for being the second year of the Covid-19 pandemic, which is associated with expansive monetary and fiscal policies and surging house prices. This report will briefly assess trends across a variety of topics. Market Activity After surging by 47% in 2020 to 24.8 million from 2019, the number of loan activities reported in 2021 HMDA ticked up by just 2% to 25.2 million, almost 40% below the record high 41.5 million attained in 2003. Similarly, the number of loans originated reported in 2020 jumped by 57% from the prior year to 14.2 million, while in 2021 the figure rose by only 3% to 14.6 million, down by about one-third from the 2003 peak of 21.4 million. 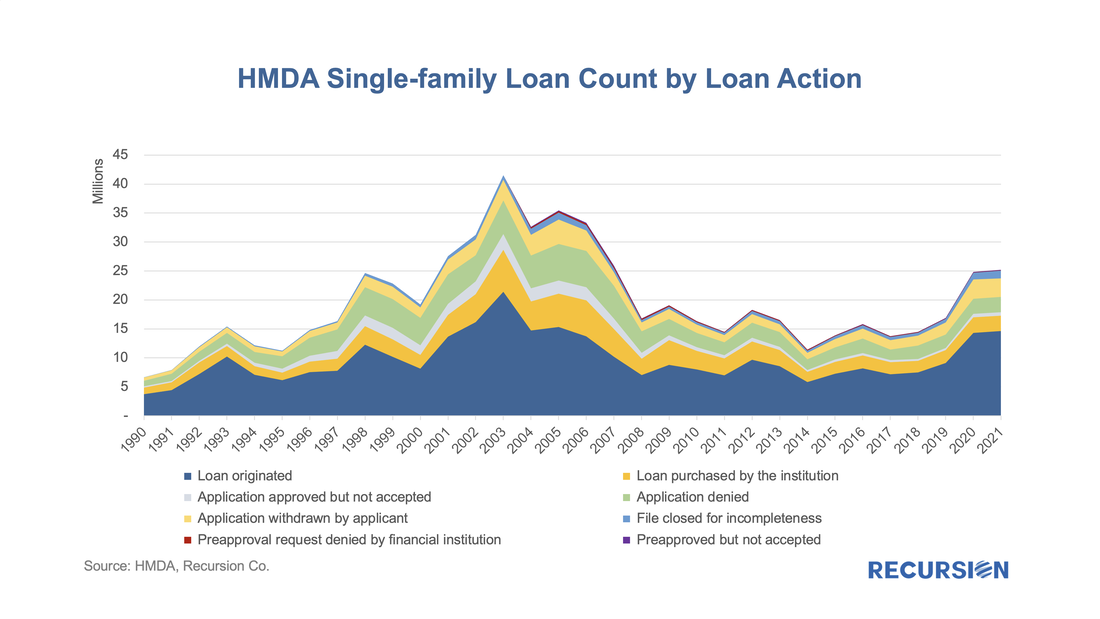 On February 15, 2022, Ginnie Mae announced it was adding a “Green Status” field to its multifamily disclosures, “giving investors information that supports their sustainable investing decisions and solutions.”[1] Specifically, “The new securities disclosure allows investors to easily identify multifamily mortgage-backed securities whose collateral meets the requirements of FHA’s Multifamily “Green” Environmental Product Programs. This will assist investors in acquiring suitable investments to meet their ESG mandates and improve the liquidity of the securities in the secondary trading to other ESG investors.” There are several broad observations that can be immediately taken from the new disclosure. First, Green loans tend to be larger than others. As of February 2022, over 12% of loans in Ginnie Mae multi-family pools by loan count contain the green flag, accounting for almost 28% of UPB. As a result, green loans stand about twice as big as those which do not fall in this category. The bulk of these units are market rate apartments meeting the Green building requirements or loans in the affordability categories accounting for less than 1% of both total outstanding loan count and UPB. 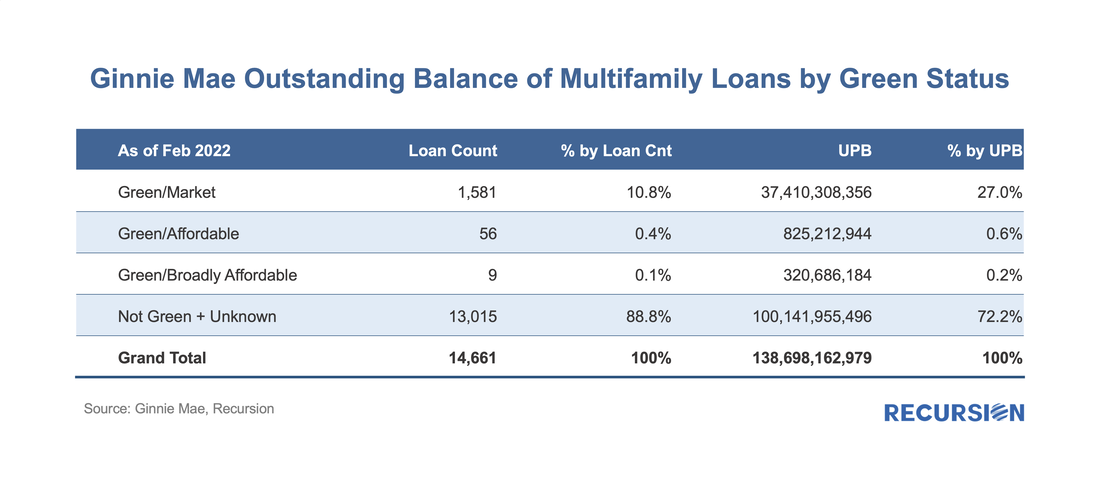 New York, NY Nov.3rd 2021 --- New York based FinTech company Recursion is teaming up with Fordham University’s Center for Research in Contemporary Finance to work on ESG aspects of mortgage market.
The group will utilize Recursion’s cutting edge big data tool, HMDA analyzer, that is based on HMDA data released by CFPB and FFIEC from 1990 to 2020 consisting of more than 600mm mortgage applications, originations, and purchases that is widely used to evaluable affordable housing policies in the US. Recursion also recently introduced FHFA’s newly released fair lending dataset, such as low-income areas, minority tracts, disaster areas and rural areas to HMDA analyzer. |
Archives
February 2024
Tags
All
|
 RSS Feed
RECURSION |
|

Copyright © 2022 Recursion, Co. All rights reserved.