|
In a recent post[1], we discussed findings obtained with the recent release of 2021 HMDA data. Among other things, we looked at the share of mortgage originations by income group and product type. In this note, we look at the difference in lending patterns between the banks and nonbanks. The incentive behind this approach is policy driven. There is a long history of measures taken to encourage lenders and builders to foster economic development in low-income areas via the housing market. For example, the Community Reinvestment Act (CRA) stipulates that a bank’s performance with regards to compliance of their regulatory requirements depends in part on: “the geographic distribution of loans—that is, the proportion of the bank's total loans made within its assessment area; how these loans are distributed among low-, moderate-, middle-, and upper income locations[2]” To assess this issue, we assign a flag to each of the census tracts designated by HUD as having a greater than 51% share of households with incomes in the Low-to-Moderate (LMI) range in the larger MSA the tract is part of[3], which are called LMI area by HUD, or “low income” tracts by FHFA. Below find a chart of the 10-year trend in the share of loans originated in this category by institution type for conventional and FHA loans: 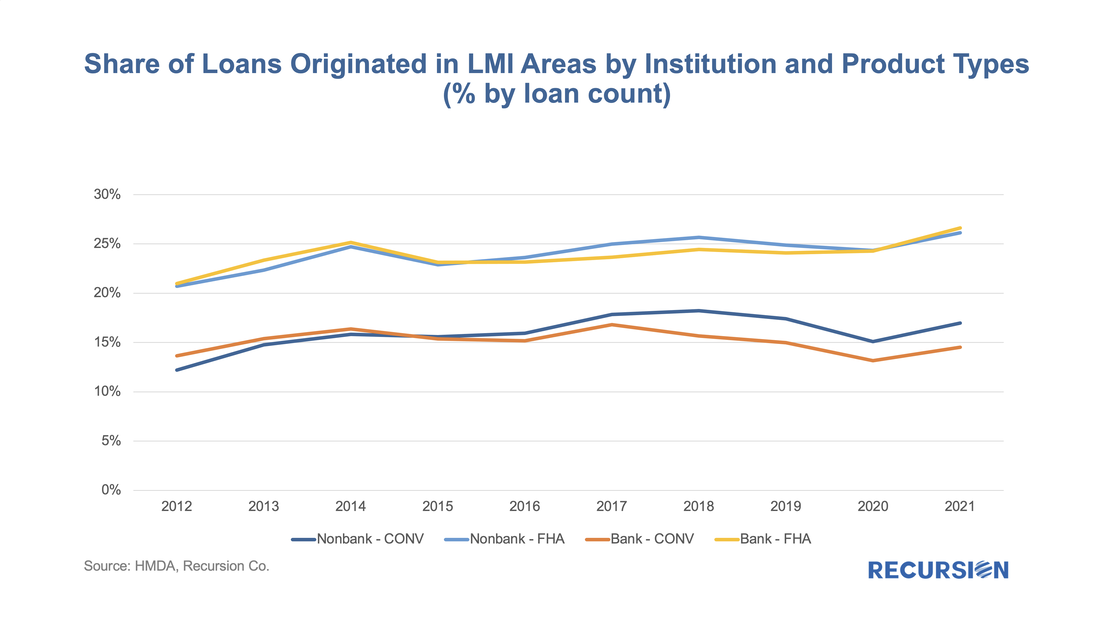 As the FHA program is geared towards low-income homebuyers, it is not surprising that the shares are uniformly higher than those of conventional loans. Interestingly, there is very little difference in the bank and non-bank shares for FHA. The situation is quite different with respect to conventional loans. Nonbanks have increased their share of loans to LMI areas relative to banks over the past five years, perhaps reflecting the growing importance of the availability of technology in underbanked regions. In terms of trends over time, for every category, there was a modest upward trend in this share starting from 2012, peaking in 2017 (conventional loans underwritten by banks) or 2018 (all other categories), followed by a period of flattening or decline and then a sharp increase in 2021. The FHA shares reached new decade highs last year, while the shares in conventional mortgages have not yet risen to their prior peaks, with a particularly tepid rebound in the bank share. The dynamics here are complex but likely related to household behavior in the wake of the onset of the Covid-19 pandemic and surging house prices across the country. Besides originations, HMDA provides comprehensive data on loan purchases via the correspondent channel. Below find the view on LMI activity from this perspective. 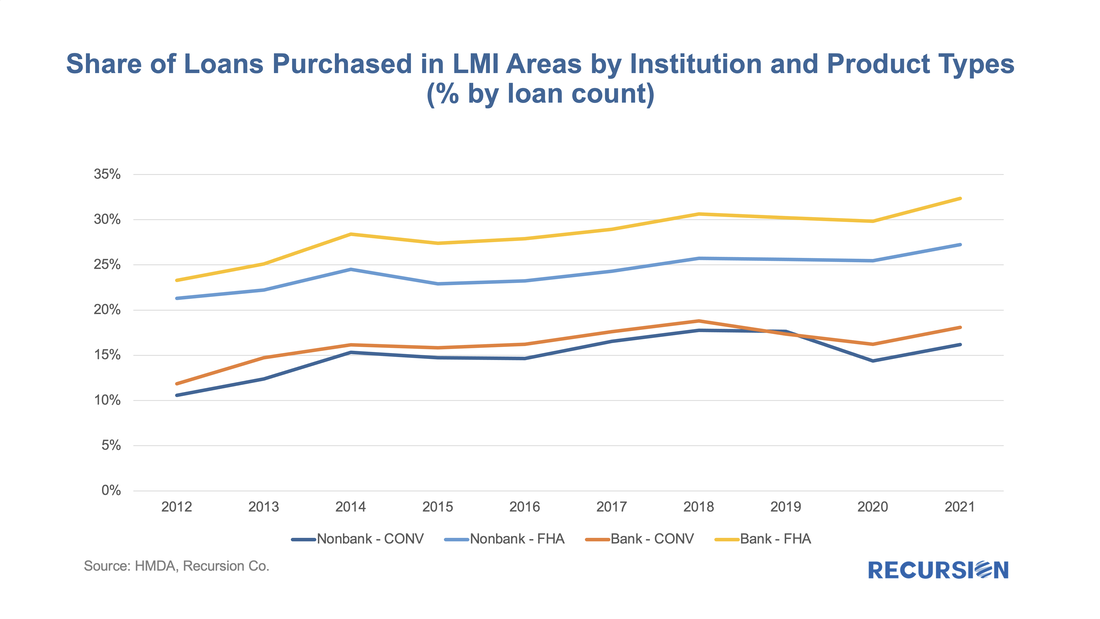 The situation here is very different. As is the case with underwriting, the shares of loans purchased in LMI areas for FHA loans is greater than for conventional mortgages. However, the bank share in this category is considerably greater than that for nonbanks, which we largely attribute to banks’ CRA requirements. The same consideration is likely to be responsible for the more modest excess in bank shares of LMI loans compared to that of nonbanks. Once again, we witness important trends in bank behavior in the mortgage market driven by policy. The CRA utilized by the bank regulators was enacted in 1977, with the last major adjustment made in 1995[4]. Attempts at modernization since that time have largely not materialized. The market broadly expects a renewed effort, perhaps soon now that Federal Reserve Board member Lael Brainard has been elevated to Vice Chair. Vice Chair Brainard has been the leading advocate of a CRA that “seeks to advance the CRA's core purpose of addressing inequities in credit access and ensuring an inclusive financial services industry.” A new proposal based on this purpose will likely have profound implications for the mortgage industry. For example, we note that Vice Chair Brainard refers to “financial institutions” and not “banks”. Lenders and investors are increasingly focused on ESG concerns, driven by public awareness and public policy. These organizations will need to be supported by comprehensive data that allows for deep dives into the activities of individual financial institutions at a neighborhood level, the sort of information that is readily accessed through Recursion’s HMDA Analyzer. [1] https://www.recursionco.com/blog/2021-hmda-takeaways [2] https://www.atlantafed.org/banking-and-payments/publications/community-reinvestment-act/bank-cra-performance-standards.aspx [3] A low income household is one with less than 50% of the area median income and a moderate income household is one with income greater or equal to 50% of AMI but less than 80%. [4] https://www.federalreserve.gov/consumerscommunities/cra_history.htm Recursion is a preeminent provider of data and analytics in the mortgage industry. Please contact us if you have any questions about the underlying data referenced in this article. |
Archives
July 2024
Tags
All
|
 RSS Feed
RECURSION |
|

Copyright © 2022 Recursion, Co. All rights reserved.