|
On March 24, the CFPB released HMDA data for 2021[1], with results obtained from 4,316 reporters, little changed from 4,472 reporters in 2020, but well below the 5,505 respondents reached in 2019[2]. There are yet more companies are expected to report to 2021 HMDA. However, our experience from previous year indicates little change in big picture when reporting is finalized. The drop reported in the number of reporters in 2020 vs 2019 is largely due to a reduction in the number of loans that a bank needed to underwrite, requiring a report to be filed starting in 2020. This data is used for market sizing by regulators and market participants, but it also represents a treasure trove of information regarding lender and consumer behavior across a wide variety of economic and market regimes. 2021 was notable for being the second year of the Covid-19 pandemic, which is associated with expansive monetary and fiscal policies and surging house prices. This report will briefly assess trends across a variety of topics. Market Activity After surging by 47% in 2020 to 24.8 million from 2019, the number of loan activities reported in 2021 HMDA ticked up by just 2% to 25.2 million, almost 40% below the record high 41.5 million attained in 2003. Similarly, the number of loans originated reported in 2020 jumped by 57% from the prior year to 14.2 million, while in 2021 the figure rose by only 3% to 14.6 million, down by about one-third from the 2003 peak of 21.4 million. 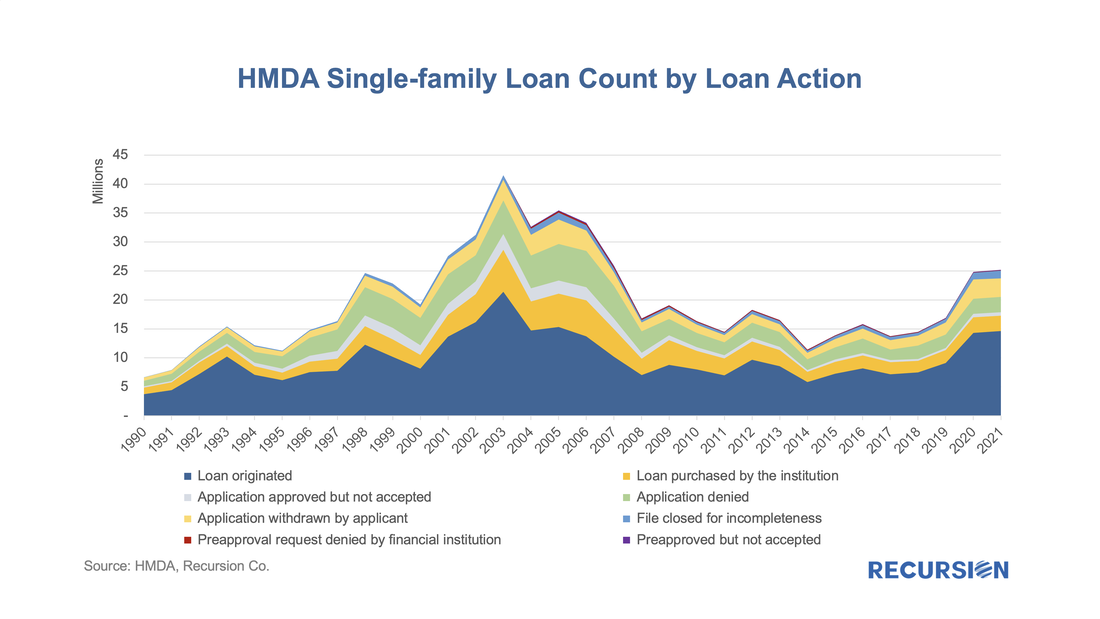 However, given the recent rapid rise in house prices, a much different picture emerges for loan balances. In this case, the volume of all activities in 2021 of $7.4 trillion stands 16% above the 2003 report, while for originations, the $4.4 billion number reached in 2021 is 31% higher than the 2003 figure. 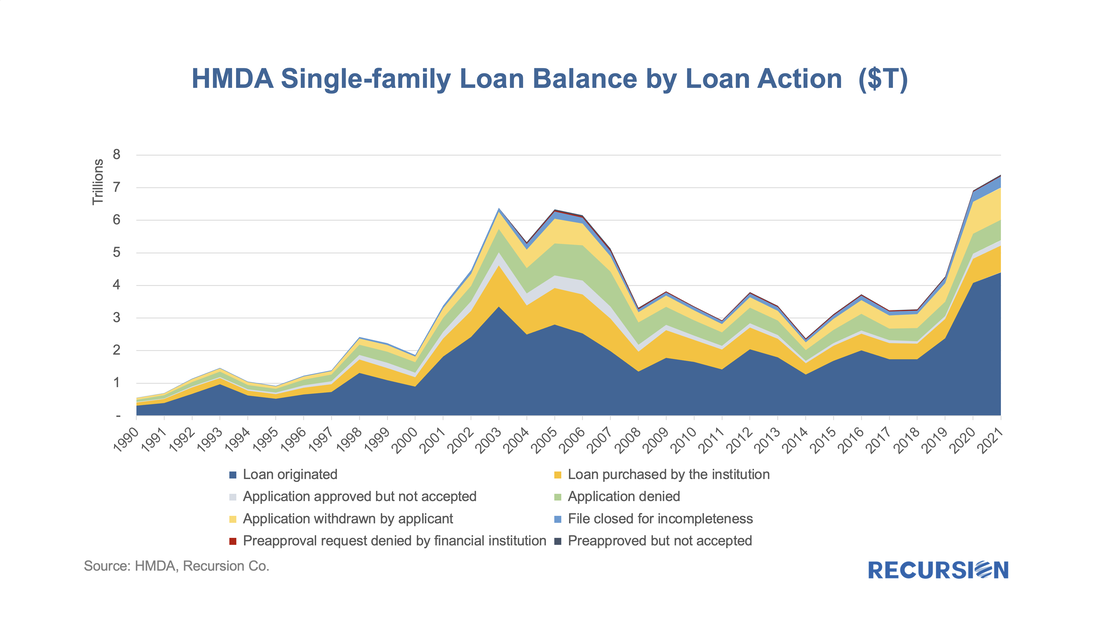 Loan Purpose and Property Type By loan count, the year-year swings in single-family underwriting volumes tend to be dominated by the refinance market in response to changing interest rates. Despite the impact of the pandemic and the policy response, neither refinance nor purchase volumes have yet to reach their bubble peaks on a loan count basis. 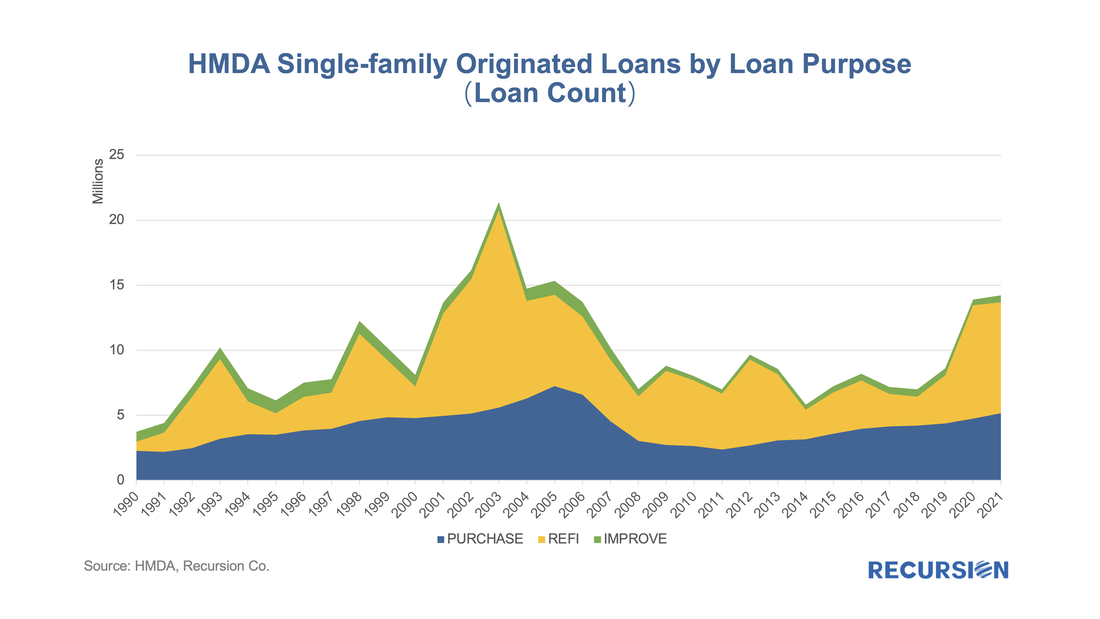 There remains a long-term tendency in the single-family housing market for growth in demand and prices to move in a correlated manner. 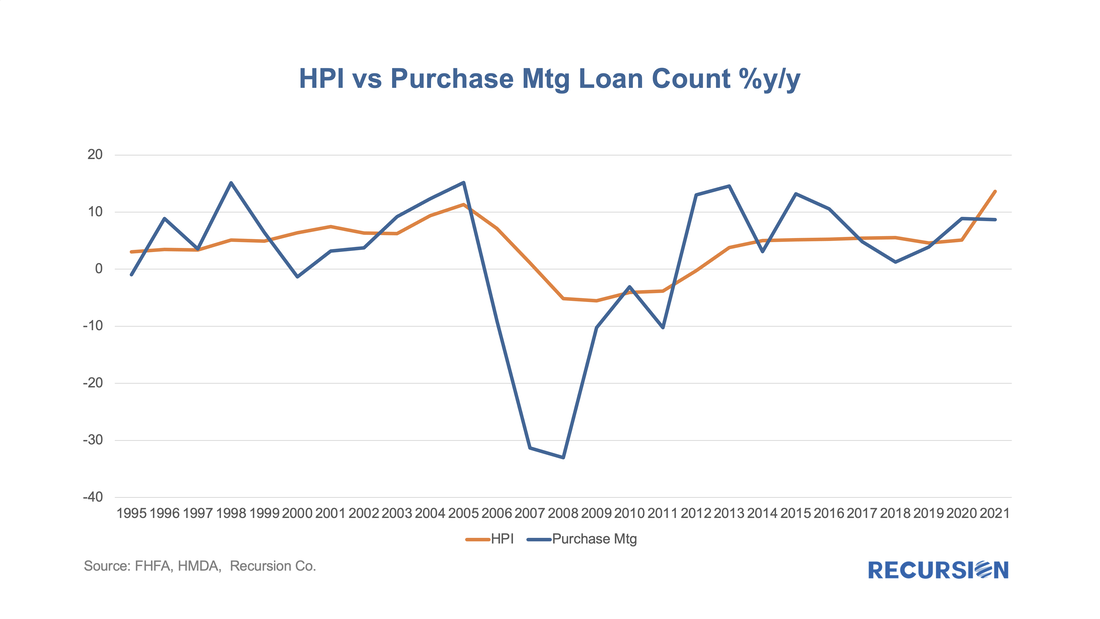 The value of multifamily debt origination has multiplied seven times since the Global Financial Crisis. Growth has been much slower in manufactured housing origination value but has jumped by over 70% in the last two years as single-family house prices have skyrocketed. 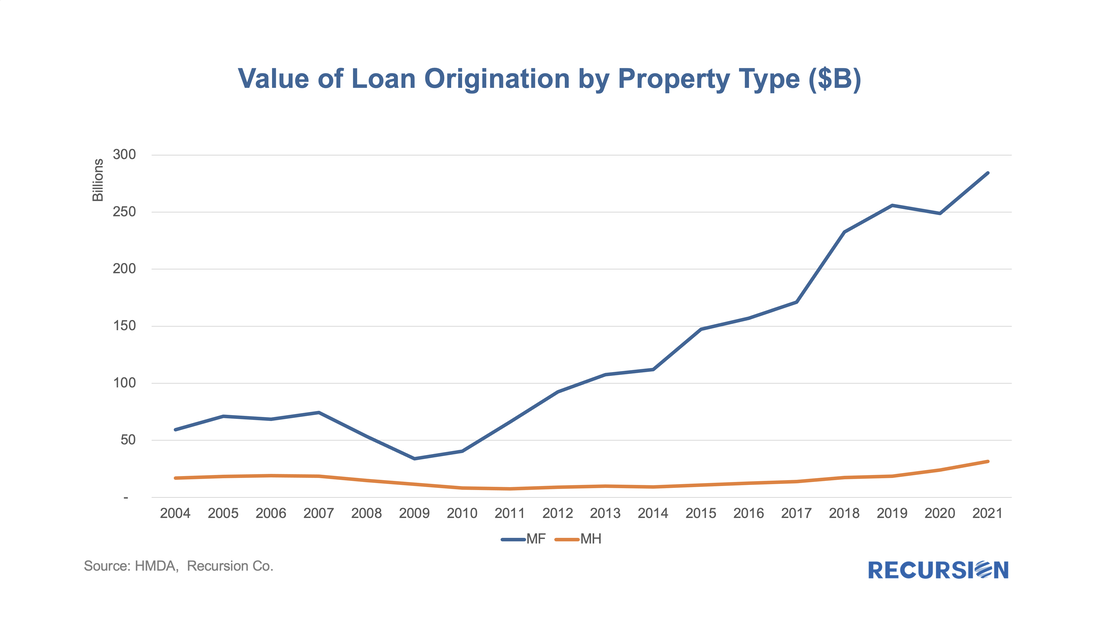 Lender Type The nonbank juggernaut continued to roll on in 2021, with its total share of the single-family market rising by 2.5% to a record 62.0%, following a spectacular 7.6% jump the prior year with the onset of the pandemic. This sector continues to benefit from superior technology, a lighter regulatory burden, and a fundamental trend away from on-site financial transactions that seems set to persist. Another notable development is that after losing 1.8% in share in 2020, the role of credit unions in the market stabilized in 2021, rising 0.1% to 9.2%. 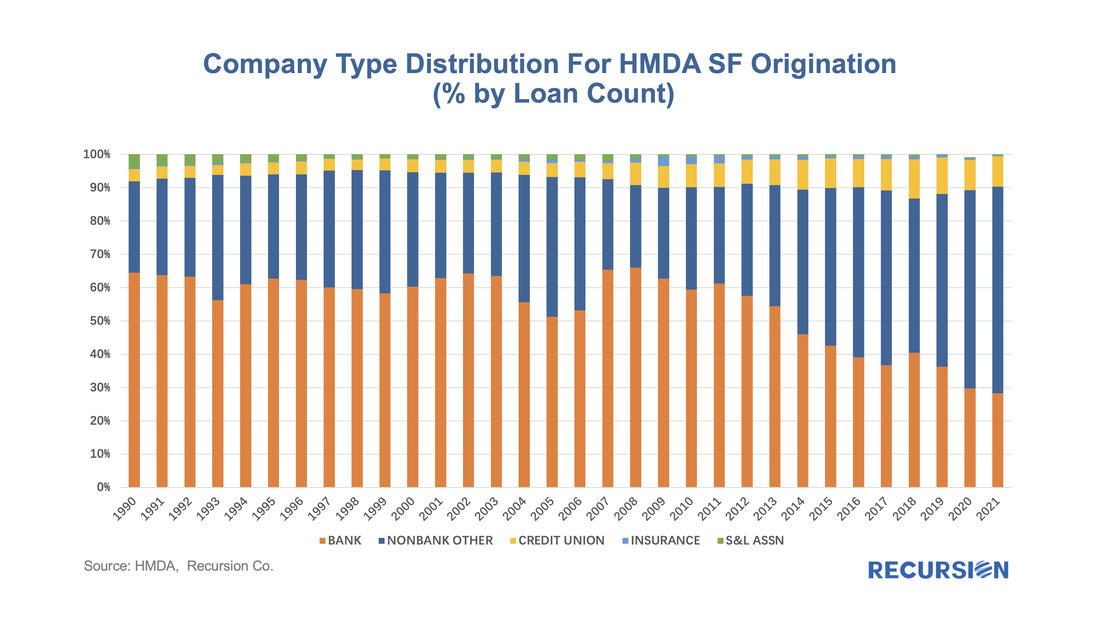 Originations by Income With house prices up, it’s not surprising that the distribution of mortgage originations would shift towards higher-income households. 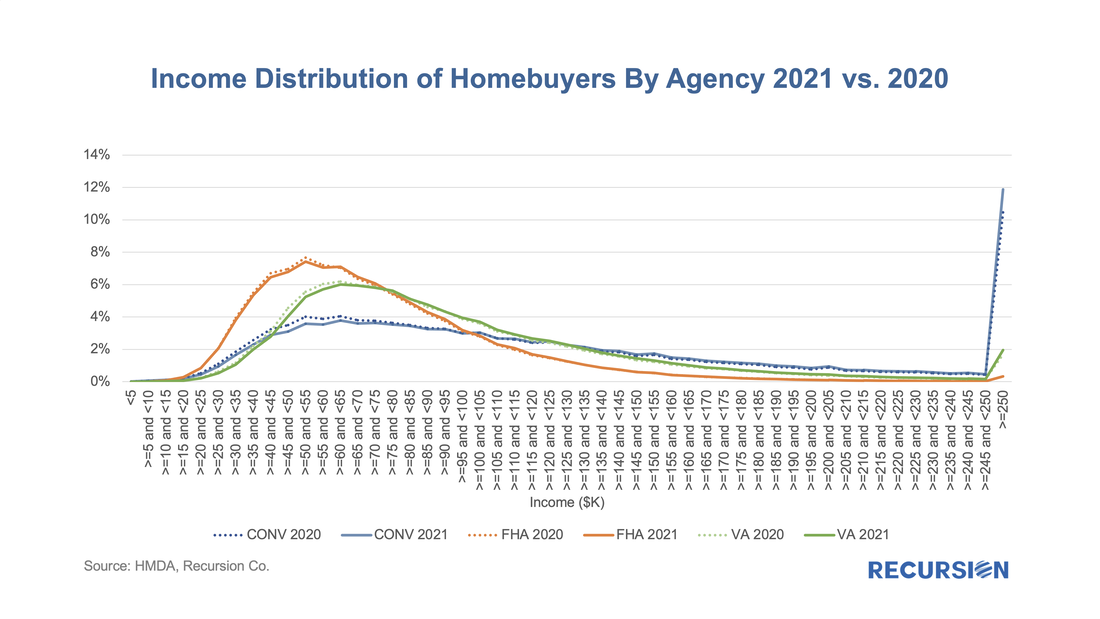 There are observable differences in the degree of this shift by loan type. In the case of conventional mortgages, households with income under $100,000 comprised a 3% lower share of originations in 2021 than in 2020. About 1/3 of this share went to the 100-200K bracket, with 2/3 going to the greater than 200K segment. For VA, the decline in share for the <100K bracket was 2%, with 3/4 going to the 100K-200K bracket and 1/4 shifting to households with incomes over $200K. Finally, the distribution changed very little for FHA borrowers with the lower income segment share falling by just 0.25%, which shifted into the 100K-200K segment. 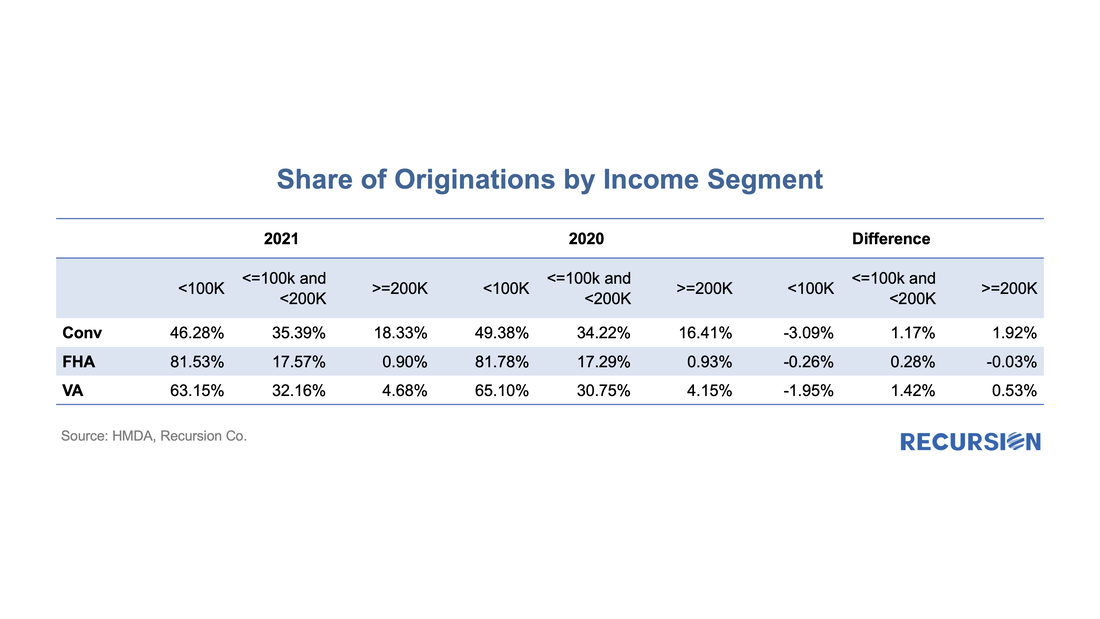 Originations by Race HMDA data for 2021 shows a jump in the share of minority borrowers at the expense of non-Hispanic Whites. There is also a trend increase in the share of loans that the borrower’s race is not indicated. 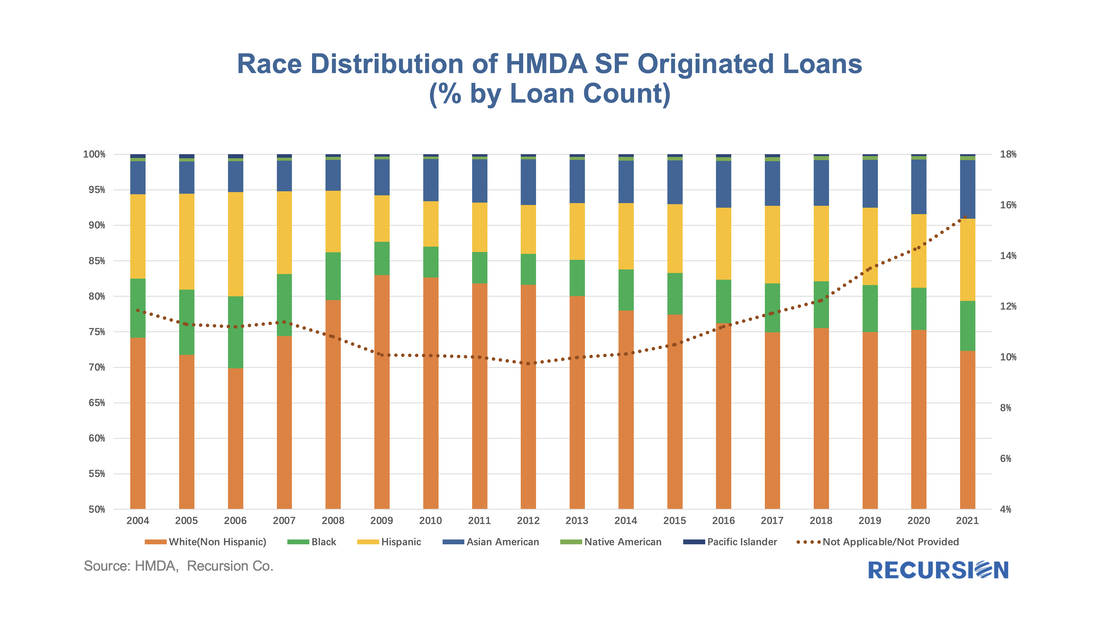 Interestingly, the declining share of non-Hispanic Whites can be seen across all the major loan programs, with highest decline from conventional loans (from 77.7% to 74.4%), driven by FHFA policy mandate. 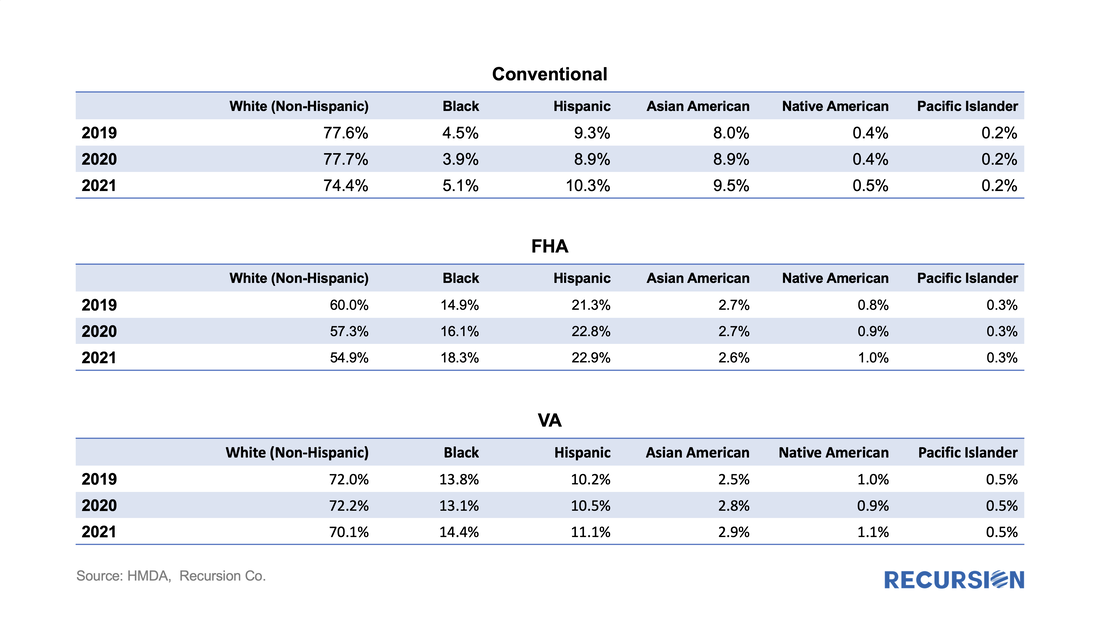 Financial inclusion is a key policy goal, but the natural question arises about the possibility that buying real estate at record high prices sets up minority borrowers to take the brunt of the fallout should the market weaken in coming years. 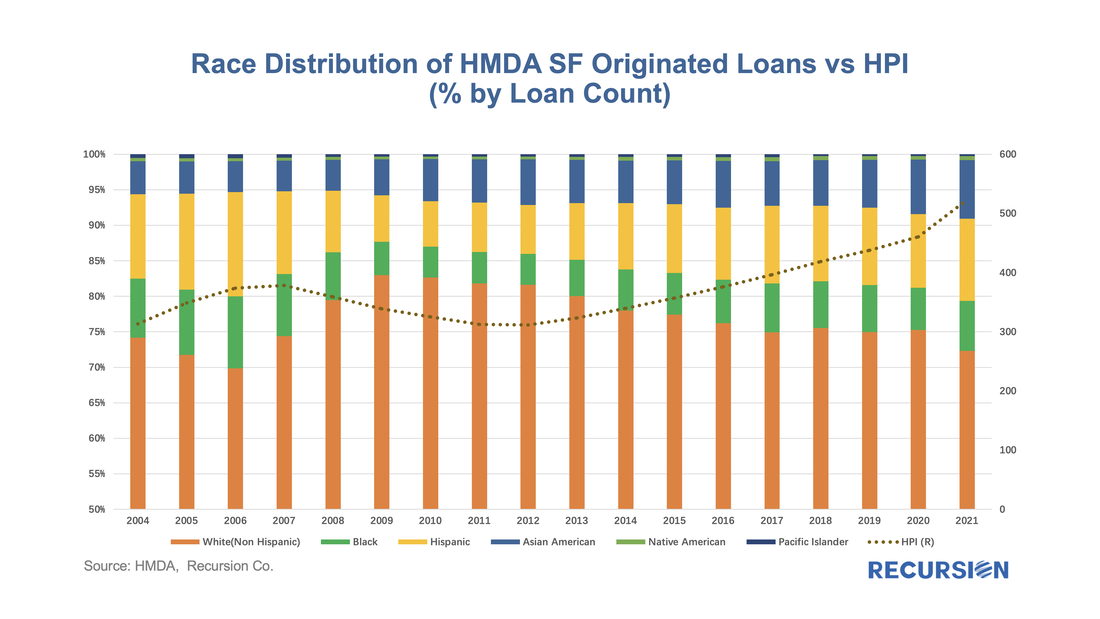 In fact, the non-Hispanic White share of originations in 2021 at 72% was the lowest level attained since the peak of the housing bubble in 2006 when it was 70%. Originations by Gender In this section, we break the single-family origination market down into loans with a single name on the mortgage and those with two names. In the first case, the number of loans with a single borrower that identified as female has been rather steady, nearly 40% in recent years. 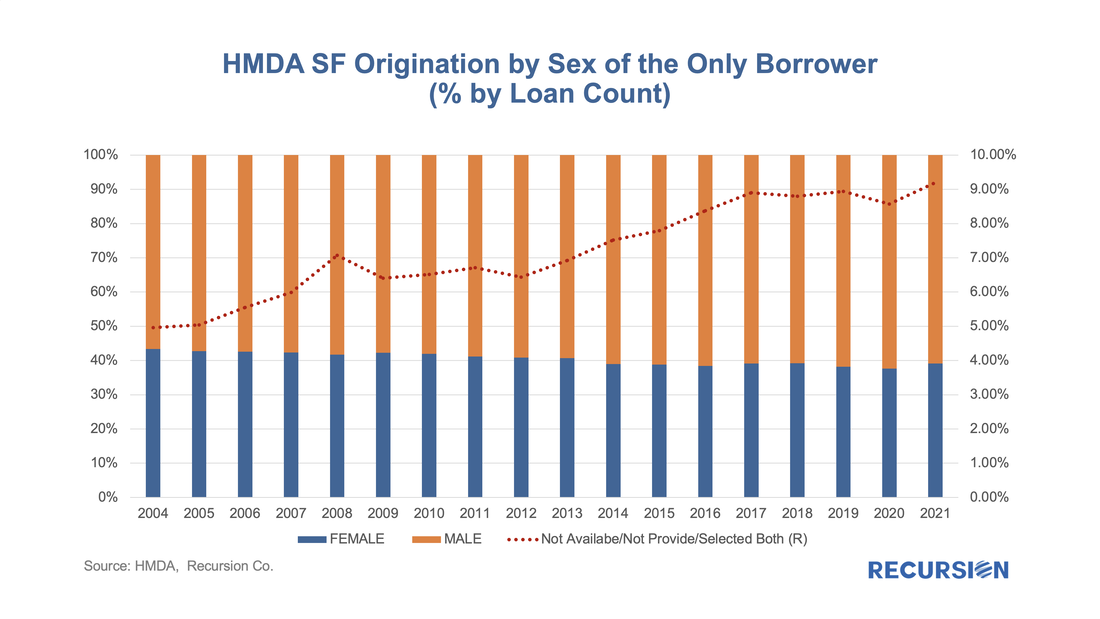 However, in the case of two-person mortgages, the share of loans where the first applicant is female continues on an upward trend and, in 2021, reached a record 27.5%: 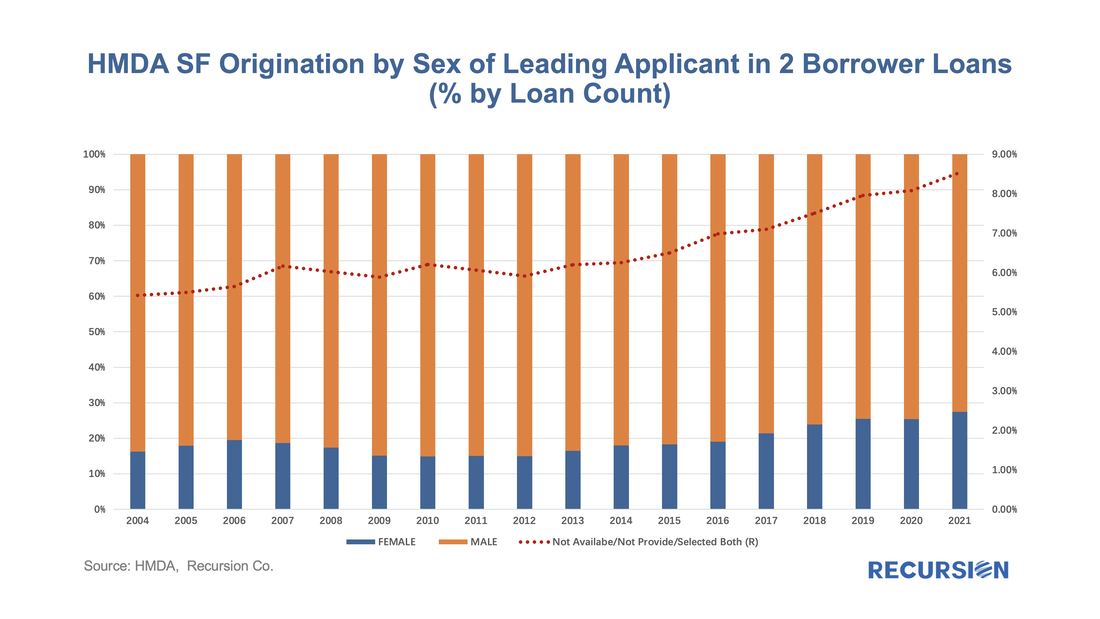 Conclusion The big-picture view described above by no means covers the landscape of topics this dataset touches upon. In particular, there is information provided on thousands of financial institutions at a geographic level down to the census tract. Other topics, such as borrower age and loan type stratification including conforming and non-conforming loans are also disclosed. Recursion has made a considerable effort to harmonize the respondent names over time to allow our customers to apply our analytic tools to assess market trends over multi-year periods to enhance their strategic and regulatory objectives. |
Archives
July 2024
Tags
All
|
 RSS Feed
RECURSION |
|

Copyright © 2022 Recursion, Co. All rights reserved.