|
On November 30, 2023, the Veterans Administration (VA) announced a new home retention program called the VA Servicing Purchase (VASP) program as an option for borrowers who cannot be assisted through other home retention options[1]. As the program will not be rolled out until March 2024, VA has strongly encouraged a foreclosure moratorium on all VA-guaranteed loans through May 31, 2024. Under this program, VA will exercise its statutory option to purchase the loan from the servicer and VA will hold the loan in VA's own loan portfolio[2]. The servicer will prepare a modification of the loan to increase affordability for the Veteran. As the vast majority of VA mortgages are securitized in Ginnie Mae pools, let’s first take a look at the outstanding balance and loan count of VA loans using data disclosed by Ginnie Mae: 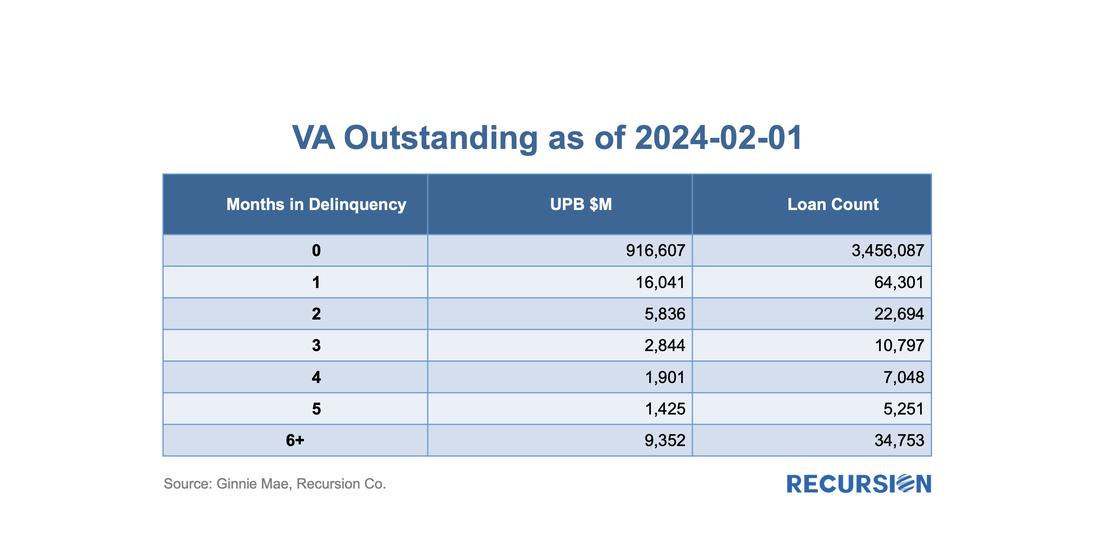 The recent release of pool-level buydown data led us to write a note contrasting the use of this product across Agencies, including Ginnie Mae[1]. In the process of writing this, we discovered that FHA, unlike the GSEs, also provides loan-level data for buydowns. This allowed us to run an analysis showing loan performance as measured by EPDs was better for FHA loans with buydowns than without, reflecting increased lender caution in using buydowns, which, on average, had higher credit scores than those without. The availability of loan-level data for FHA on this topic provides us with an opportunity to conduct an additional informative analysis specific to this program, which we document here. To start, let’s look at the share of the market with buydowns: 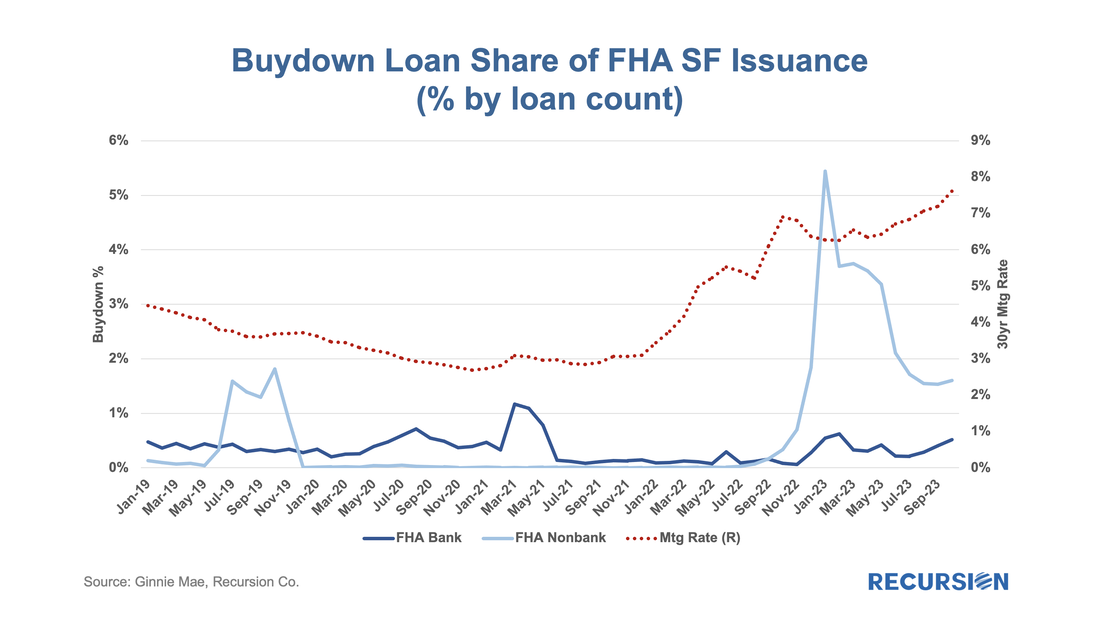 ......  ......  ...... 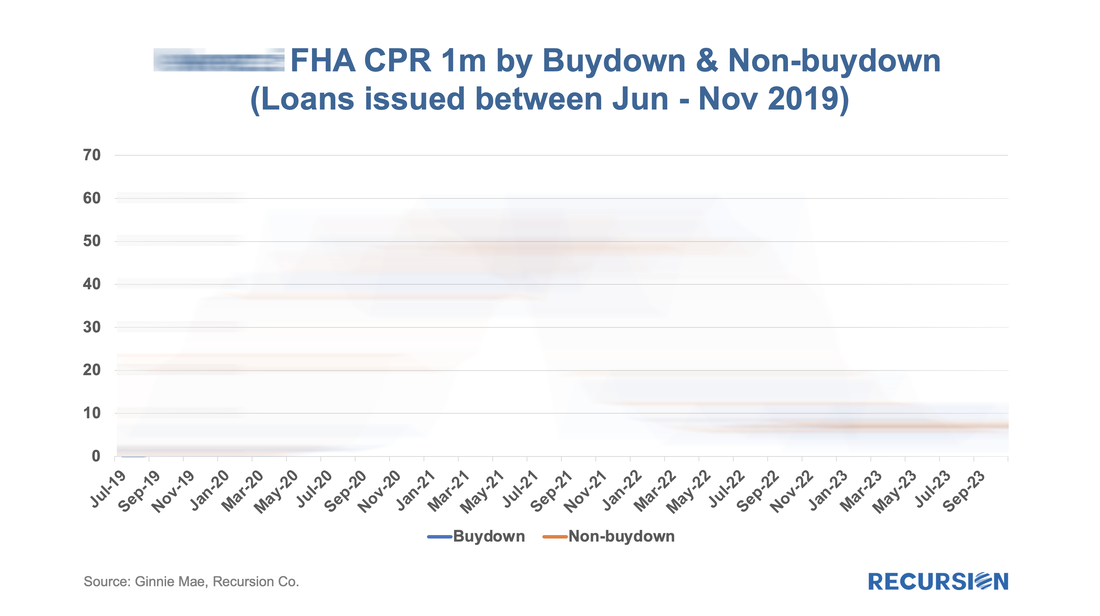 To read the full article, please send an email to [email protected] Analyzing trends in market performance requires two things, 1) a lot of data, and, 2) a deep understanding of the structure of markets. We recently came across a good example of this with relative delinquency rates between GNM and GSE pools[1]. In this post, we look at the dynamics of the two categories of reperforming mortgage loans. Investors have spent many years building models of prepayment speeds for mortgage pools based on a variety of characteristics such as loan size and underwriting characteristics. However, institutional factors can come into play as well. One that comes to mind is the difference in program structure between conventional and government loans. For the conforming market, the issuer is a GSE, while for government programs, it is the servicer. In both categories, when a loan becomes seriously delinquent, it can be bought out of the pool at par, amounting to a prepayment. The difference is that for the case of conforming loans, it is the quasi-public GSEs that perform this function, while for government programs, the decision is up to private sector entities. In the first case, there are overarching policy goals that weigh on decisions about the disposition of loans in delinquency, while in the second case, these decisions are based on financial considerations. One way to test this is to look at buyouts over the interest rate cycle. Below find a chart containing the shares of reperforming loans in new issuance for FHA, VA and the GSEs. These are loans that have been previously bought out of pools and then reissued into new pools. There can be a substantial lag between the buyout and re-issuance. 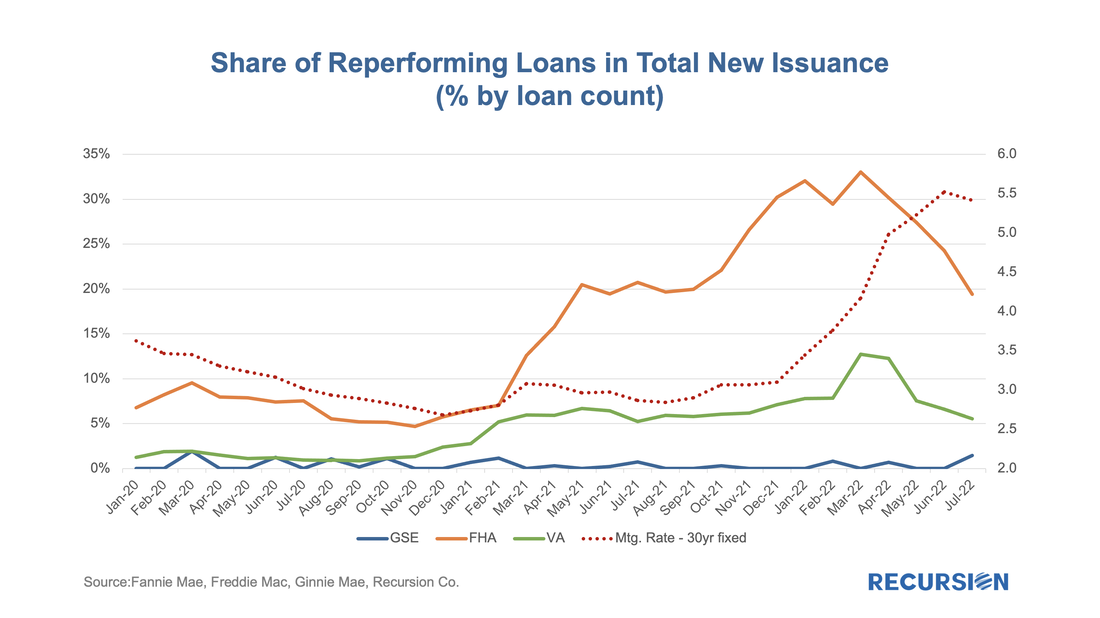 On May 5, 2022, Freddie Mac announced "that certain principal curtailments were previously not passed through on a timely basis to MBS securities holders[1]. The outstanding principal curtailments will be reflected in the May 2022 factors and passed through to the affected MBS securities with the May 2022 payment. The curtailments are associated with approximately 178,000 mortgages distributed across approximately 50,000 pools. As a result of this catch-up pass through of principal curtailments, the May 2022 factors will reflect an approximately 0.7% CPR increase in prepayment speeds for the related pools, in the aggregate." In addition, they attached a list of 1,102 pools where the curtailment amount was equal to or exceeded 5% of the UPB[2].
That's a remarkable statement for a variety of reasons, but at Recursion, our immediate response was to take this as an analytical challenge. Do we have the information and tools needed to reproduce Freddie Mac's estimate of a 0.7% CPR increase from this remediation? How to begin? As the payment was adjusted in May factors, it would have impacted April CPR. But how to back out curtailments? It's clear that this would have to be done at the loan level since there is not enough information at the pool level to compute a shortfall. Back in 2021, we wrote a comment on the properties of the GSE Special Eligibility Programs designed to provide lower income households with access to mortgages (HomeReady for Fannie Mae and Home Possible for Freddie Mac)[1]. Given the increasing policy focus on the provision of credit to these households[2], it is appropriate for investors to look at the investment opportunities in this area. In this note, we look at the performance of HomeReady/Home Possible Program loans (referred as Low-Income Program in the following) vs. non-special-eligibility program loans, as measured by one month CPR, controlling coupon and vintage. We focus on just two such cohorts, 1.5% and 2.0% coupon pools of 2021 vintage. By loan count, the share of Low-Income Program loans in these pools by agency for May 2022 is: 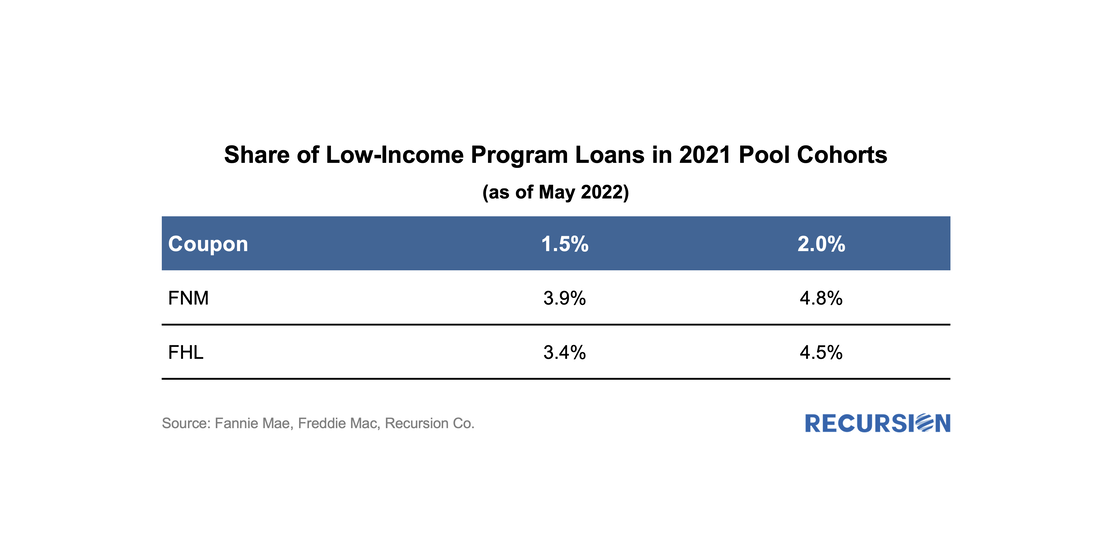 In a recent post, we posed the question: as the Fed’s portfolio shrinks, who will buy[1]? In this report, we dig a bit deeper and look at the differential market impacts based on whether the loans on the balance sheet roll off (as in, for example, a refinance transaction) or are sold off. In the first case, we assume that a mortgage in a pool the Fed holds is extinguished, and a new mortgage is created through a refinance transaction, or via a home sale followed by the purchase of a new home financed by a new purchase mortgage, or through a buyout that generates a new modified loan. This case describes the situation described in the earlier post: a mortgage on the Fed’s balance sheet disappears, and some other investor has to pick up the new loan. The question here is how much higher the yield on the new pools has to be to attract sufficient demand from private investors. These new loans tend to have characteristics that investors find attractive, including a coupon which is near the most liquid part of the market (the current coupon). The second case is quite different. In this instance, the question is how much higher the yield has to be (lower price) for the existing mortgages being sold to find buyers, not for a new mortgage with the most desirable characteristics. In this case, it’s not just a matter of who has the capacity to increase their holdings, but how much additional yield investors will be required for characteristics that are less than pristine. These are challenging issues that we can’t offer precise solutions to, but one way to approach the issue is to see how different the Fed’s portfolio looks from those held in the private sector. To conduct this exercise, we look at two characteristics. The first is the coupon distribution of what the Fed holds vs. the portfolios held by private investors. This rather technical exercise can be conducted by supplementing the data provided in the Agency disclosures contained in our Pool-level Analyzer with the central bank’s holdings provided by the New York Fed[2]. In fact, the distinction is quite notable for 30-year fixed-rate mortgage pools: 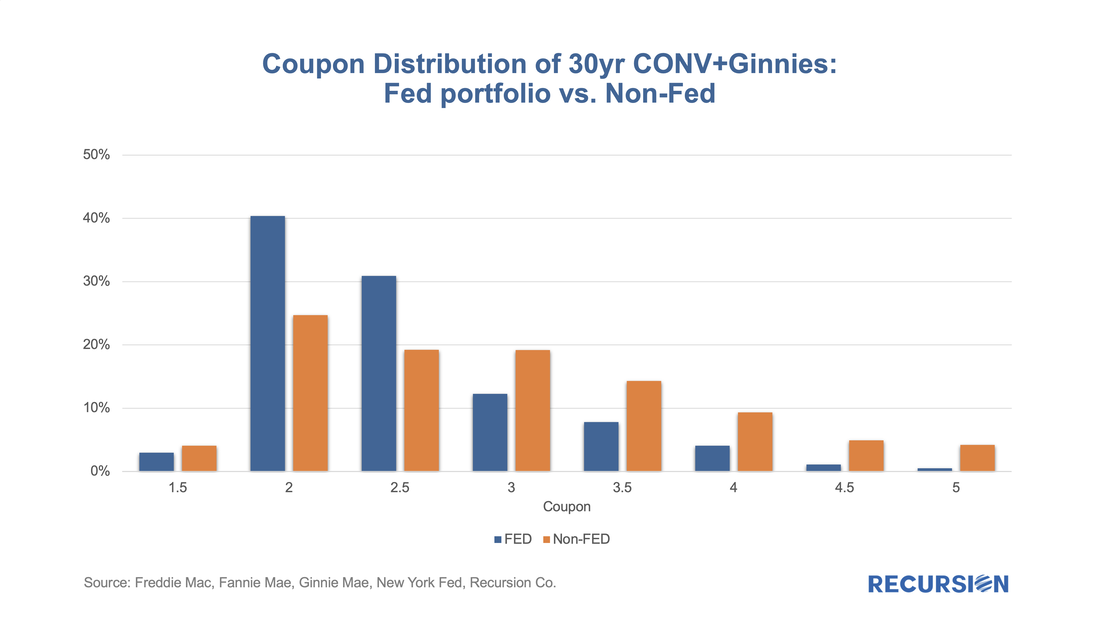 In an earlier post, we discussed the use of trial modifications as a leading indicator of buyouts, as loans in these programs must experience three months of successful payments prior to being eligible for a permanent mod[1]. On January 25, Fannie Mae announced that they had purchased certain loans out of pools prior to the completion of the necessary trial payments.[2] Then, on March 25, Fannie published a list of these securities, allowing us to quantify the impact of this event on the performance of their pools[3]. The spreadsheet attached to the March announcement contains over 17,800 entries dating back to February 2021 and states that the total unpaid balance bought out early amounted to over $4.5 billion. The point of this post is to assess the magnitude of this activity on Fannie Mae’s prepayment speeds. To address this question, we imported the data in the file released by Fannie Mae into our Recursion Pool Analyzer. As a first step, we look at the impact of these purchases on CDR’s as the activity was clearly involuntary. 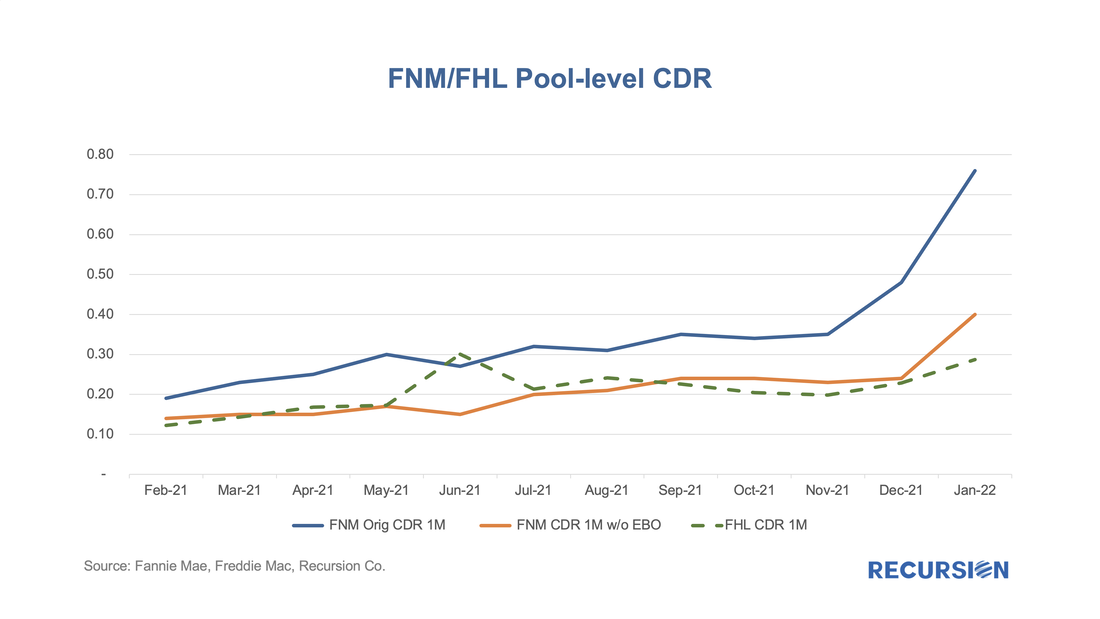 With the expiration of forbearance programs underway, there is an interesting question about how loans exiting these programs will perform once they are resecuritized. For Ginnie Mae programs, these are either loans that exit forbearance with a partial claim or receive a permanent mod under the various waterfall options in the FHA or VA programs. In our previous blogs[1], we have noted MOD and RG loans are becoming a significant portion of loans delivered to newly issued Ginnie Mae pools. 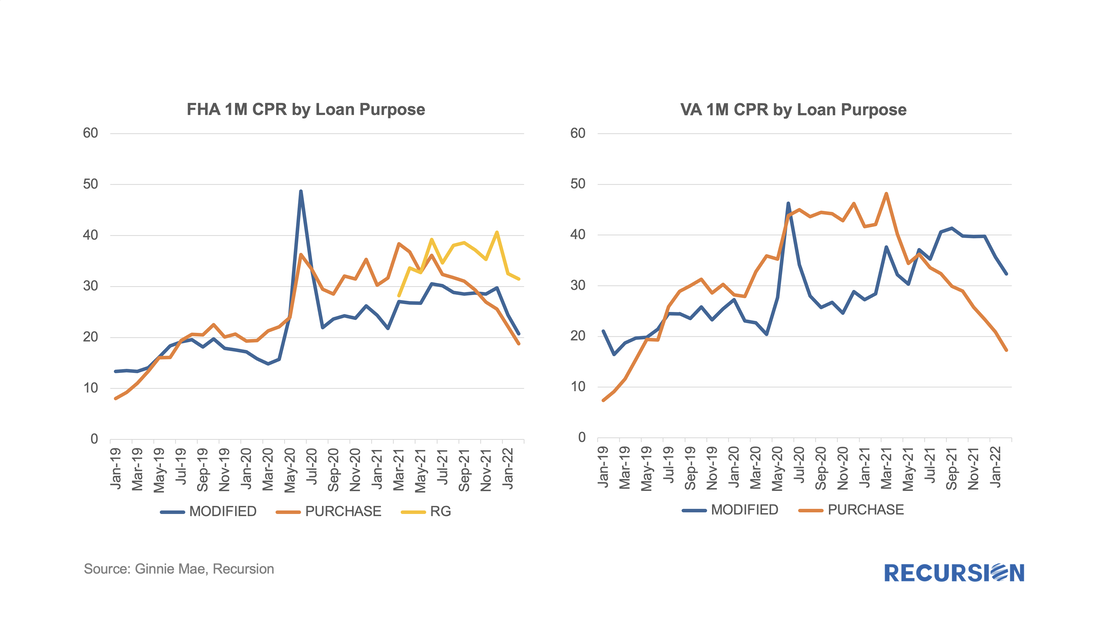 |
Archives
July 2024
Tags
All
|
 RSS Feed
RECURSION |
|

Copyright © 2022 Recursion, Co. All rights reserved.