|
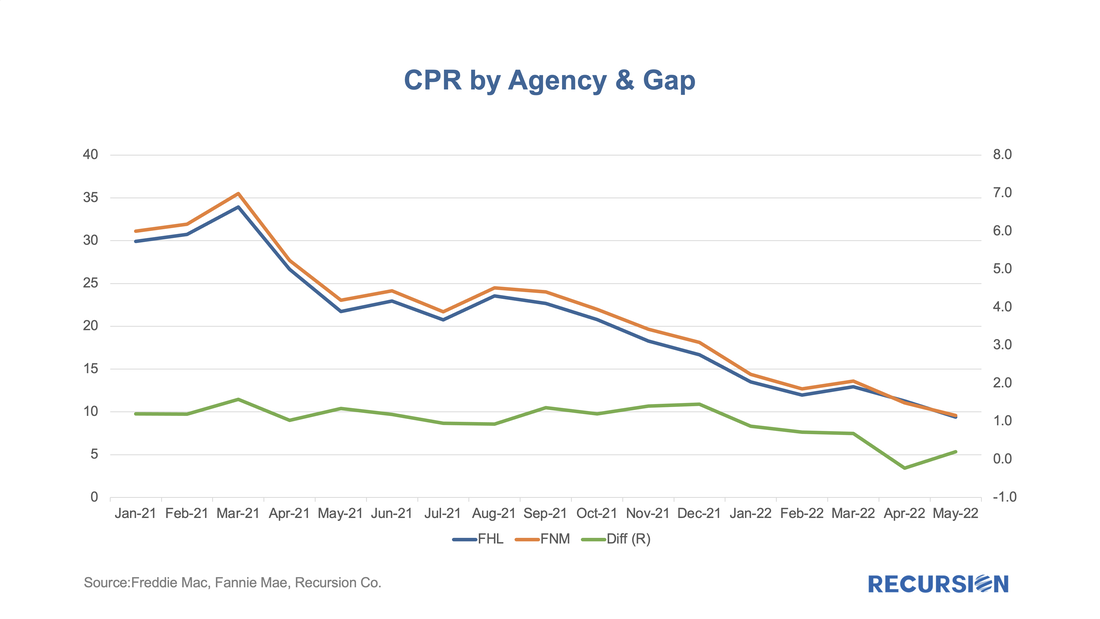
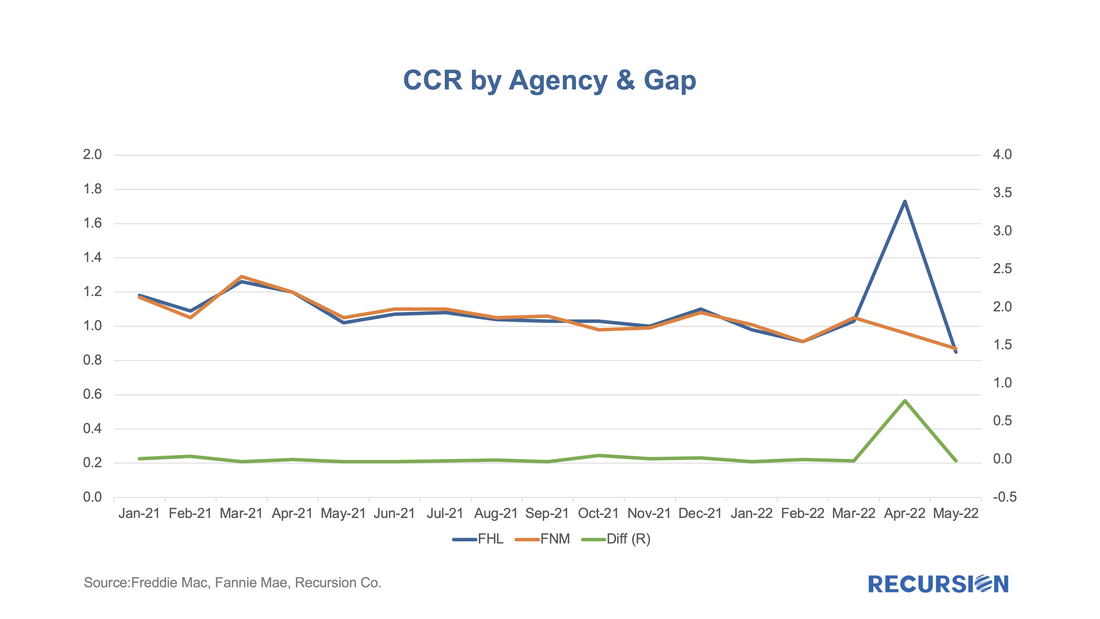
On May 5, 2022, Freddie Mac announced "that certain principal curtailments were previously not passed through on a timely basis to MBS securities holders[1]. The outstanding principal curtailments will be reflected in the May 2022 factors and passed through to the affected MBS securities with the May 2022 payment. The curtailments are associated with approximately 178,000 mortgages distributed across approximately 50,000 pools. As a result of this catch-up pass through of principal curtailments, the May 2022 factors will reflect an approximately 0.7% CPR increase in prepayment speeds for the related pools, in the aggregate." In addition, they attached a list of 1,102 pools where the curtailment amount was equal to or exceeded 5% of the UPB[2]. That's a remarkable statement for a variety of reasons, but at Recursion, our immediate response was to take this as an analytical challenge. Do we have the information and tools needed to reproduce Freddie Mac's estimate of a 0.7% CPR increase from this remediation? How to begin? As the payment was adjusted in May factors, it would have impacted April CPR. But how to back out curtailments? It's clear that this would have to be done at the loan level since there is not enough information at the pool level to compute a shortfall. What we have at the loan level is the loan rate and loan balance and term. From that, we can compute an expected payment for the following month. Assuming the loan has not fully paid off, we can compare the amount received to the expected remittance and the curtailment. To put it in prepayment terms, we can express this as: CCR =(1- [(scheduled balance-curtailment)/(scheduled balance))^12]*100 We call this the Constant Curtailment Rate or CCR. Note that the formula is the same as the CPR formula, except replacing the prepayment amount with the curtailment amount. But, unlike Freddie Mac, we don't have data on which of these was the result of missed earlier payments. So how to proceed? Well, we have a natural experiment in that we can perform a similar calculation for Fannie Mae. Since the onset of the Unified Mortgage-Backed Security (UMBS) was launched in 2019[3], prepayment speeds between the two Enterprises have moved closely together: Over the course of 2021, Fannie Mae's speeds stayed modestly above those of Freddie Mac but have converged so far in 2022. Some of this difference is attributable to Fanni Mae's buyouts exceeding those of Freddie Mac (CDR). You don't have to look hard to see a dip in the gap in April and a rebound in May. Now let's look at the same graph for CCRs. In this case, the two lines are indistinguishable, except for April, when Freddie's CCR exceeds that of Fannie by 0.77. Pretty close! Beyond a demonstration of technical expertise, the door is now open to other investigations, including an analysis of fundamental drivers of CCRs. Over the past 18 months, CCRs have been running largely in a narrow range of around 1 percent, comprising a bigger share of total prepayments, which have been declining sharply in line with higher interest rates. Finally, we can take the loan level CCRs and aggregate them up to the pool level to look at how this factor impacts pool performance metrics. Who can say what new understandings and trading opportunities can arise with this analysis based on the new concept of CCR? It ain't me. [1] f408news.pdf (freddiemac.com) [2] Pool List (pools impacted by 5 pct or more 28Apr2022).xlsx (freddiemac.com) [3] FHFA Announces June 2019 Implementation of the New Uniform Mortgage-Backed Security | Federal Housing Finance Agency Recursion is a preeminent provider of data and analytics in the mortgage industry. Please contact us if you have any questions about the underlying data referenced in this article. |
Archives
July 2024
Tags
All
|
RECURSION |
|
Copyright © 2022 Recursion, Co. All rights reserved.


 RSS Feed
