|
One of our ongoing themes is that pervasive structural change implies that traditional relationships between measures of market performance and economic fundamentals cannot be relied on to be stable over time. As a result, a broader view across markets is called for. Below see 90+Day delinquency rates as reported by the Federal Reserve Bank of New York’s Household Debt and Credit Report:[1]  There are quite a few points to take away from this chart. Note the peaks around the time of the Global Financial Crisis (2009-2010) and the onset of the Covid Crisis (2020-2021). These correspond well with comparable spikes in the unemployment rate (10% in October 2009 and 14.8% in April 2020). But the composition is quite different. During the GFC mortgage, DQs spiked very much higher for mortgages than those for car loans, while the pattern was reversed during Covid. This can reflect differences in policy between the two periods (mortgage forbearance in 2021 but not 2011), but also, this likely reflects consumer’s views on the value of paying off different types of debt. In 2010, house prices were plummeting, so incentives to pay towards an underwater mortgage were low, but they needed their cars to get to their jobs, so they continued to pay off their auto loans. During the more recent Covid crisis period, homeowners in distress had access to forbearance programs. This brings us to the more recent period. We see that delinquency rates across products started to rise in late 2022 across debt classes. Of note is the sharp increase in 90-day DQs for credit cards from 7.7% in Q4 2022 to 10.7%, above the Covid crisis peak of 10.0% in 2021Q1 and the highest reached since 10.9% in Q2 2012. Car loan DQs rose modestly from 3.7% to 4.4% over this period, while mortgage DQs inched slightly higher from 0.4% to 0.6%. The superior performance in mortgages is no doubt due to the post-Covid surge in house prices, which has created a powerful incentive for homeowners to stay current on their mortgages. But the interesting observation is that these increases occurred even though the unemployment rate has remained less than or equal to 4.0% for the past 18 months. Clearly there is a class of distressed borrowers out there in this relatively strong labor market. Since the NY Fed data contains no detail at all in terms of these borrowers, we take a deep dive into mortgage delinquencies based on agency disclosures. We start by looking at total delinquencies of the total books of business for the GSEs and FHA:  It's interesting to note that the trend in all cases is flat-to-down, in contrast to the slight rise in the NY Fed data[2]. There are many possible explanations for this, including that our data do not contain VA or non-QM loans, and that the NY Fed data is based on a 5% sample while ours covers the entire universe of outstanding mortgages in the GSE and FHA programs[3]. For our purposes, the most interesting program is FHA since these borrowers tend to have lower incomes, lower credit scores, and less experience managing debt compared to other mortgage holders, implying that they have relatively higher vulnerability to adverse economic conditions[4]. The thing is, as mentioned earlier, conditions are not that adverse. To find trends in distress in the FHA program we look at modified loans as these started out as loans that were determined to be unsustainable to begin with. In fact, performance here has deteriorated on trend over the past couple of years:  The 90-day DQ rate for these loans almost doubled from 4.1% in February 2022 to 8.0% in March 2023 and has been in a volatile but flat trend since that time. We look for fundamental trends to scale this trend, in general, from labor market indicators, which we feel is the key driver of mortgage performance. There are many such candidates, but here we look at the Kansas City Federal Reserve Labor Market Condition Indicators (LMCI)[5]. These indicators consist of 24 distinct labor market variables. The indicator we use is the LMCI Level of Activity index. It is scaled so that a number above zero indicates a stronger level of activity than the long-term average. In the chart above, we invert this indicator so as to see the correlation with rising distress in FHA modified loans. It seems that modified loans are sensitive to deceleration in labor market activity. We can dig deeper into this phenomenon by breaking the data down into different categories:  Here, we break the FHA universe into four categories: ET loans, mods ex ET, RG and other purposes. ET is extended term, which are generally 40-year mortgages. RG is Reperforming, which is not a mod but a loan leaving forbearance with a partial claim. All four categories exhibit quite different behaviors with ET loans displaying sharply worse performance than the other categories. It’s important to note that the ET share is quite small but growing:  The above chart points out that while looking at DQ charts is informative, they can be somewhat misleading in situations where programs have been around for different lengths of time. One way to get around this is to look at particular cohorts. Below find DQ’s for the 2022-2024 cohort:  It’s interesting to note here the stability in the Mod ex-ET and other categories. Growing distress is visible for the newer RG and ET programs, although the DQ rates for both peaked earlier this year. Finally, another way of looking at distress over time in a consistent pattern across programs is via Early Payment Defaults (EPDs). These are the share of loans that experience two or more months of missed payments in the first six months after origination:  EPDs jumped with the onset of Covid but quickly fell back after forbearance and other policy programs were instituted. More recently, we can see distress in the various mod programs while loans in the Other category exhibit little such behavior. This difference is interesting because the incentive to pay for more recently-originated mortgages is very much less than those prior to 2021 given the recent jump in home prices. To conclude, examining the behavior of nonpayment of debt is a very complex task, which varies by loan class, and subclass. It depends on the financial health of borrowers, and the state of the economy, particularly with respect to labor markets. It is important to avoid making broad statements about trends in DQs without taking these factors into consideration. Finally, we do not see broad signs of distress in consumer debt markets (particularly credit cards) spilling over to mortgages, except possibly in the most distressed cohorts. We conclude that mortgages are not yet a source of general financial concern, but the situation needs to be closely monitored, particularly within the most distressed category of borrowers. [1] https://www.newyorkfed.org/microeconomics/hhdc
[2] This contradicts a widespread view that FHA loan performance has deteriorated in recent quarters. In fact, the 30-day DQ rate for FHA has been in an upward trend over the past two and a half years. (To as high as 6.5% recently, according to FHA Loan Performance Trends Report). Most of these however, cure before hitting the 90-day threshold. [3] See New York Fed Household Debt And Credit Report (https://www.newyorkfed.org/microeconomics/hhdc), p44, paragraph 1. [4] For 2023 issued GSE and FHA loans (disclosed by Agencies), the WA credit score is 754 vs. 676; while the share of first-time home buyer of purchase loans is 46.5% vs. 75.0%. In addition, according to HMDA 2023, the WA borrower’s income is $301k for conventional loans and $112K for FHA loans. [5] https://www.kansascityfed.org/data-and-trends/labor-market-conditions-indicators/ On November 30, 2023, the Veterans Administration (VA) announced a new home retention program called the VA Servicing Purchase (VASP) program as an option for borrowers who cannot be assisted through other home retention options[1]. As the program will not be rolled out until March 2024, VA has strongly encouraged a foreclosure moratorium on all VA-guaranteed loans through May 31, 2024. Under this program, VA will exercise its statutory option to purchase the loan from the servicer and VA will hold the loan in VA's own loan portfolio[2]. The servicer will prepare a modification of the loan to increase affordability for the Veteran. As the vast majority of VA mortgages are securitized in Ginnie Mae pools, let’s first take a look at the outstanding balance and loan count of VA loans using data disclosed by Ginnie Mae: 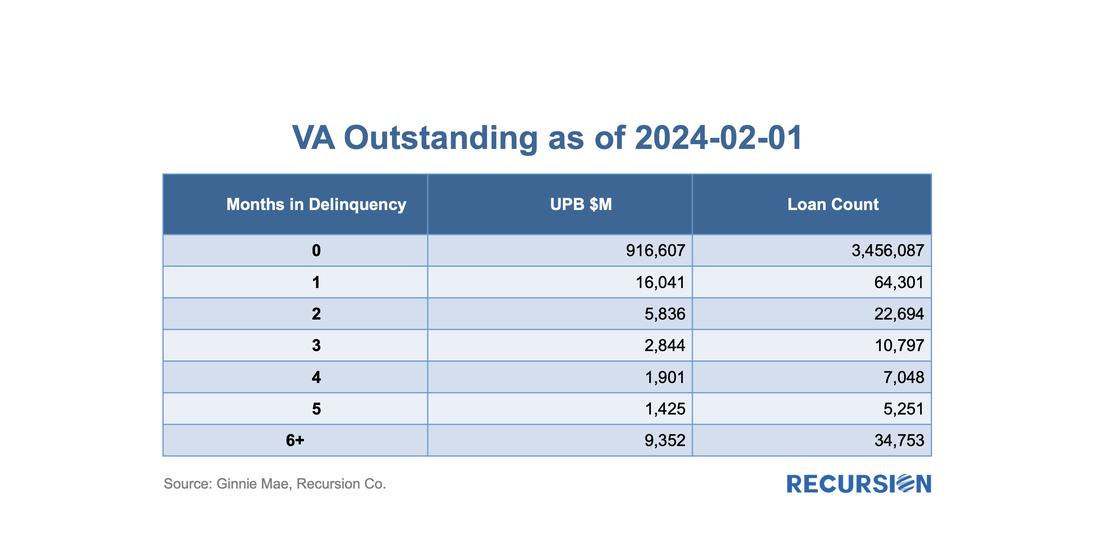 With all eyes on the turmoil in the banking sector, it’s good to see that policymakers continue to innovate to help borrowers. Earlier this month, HUD published Mortgagee Letter 2023-06 “Establishment of the 40-Year Loan Modification Loss Mitigation Option”, which establishes the 40-year standalone Loan Modification into FHA’s COVID-19 Loss Mitigation policies[1]. The standalone 40-yr mod is scheduled to be implemented by May 8. This follows the establishment of a 40-yr modification with a partial claim in April 2022[2]. The introduction of standalone 40-yr mods reminded us that we haven’t focused on the progress of the 40-year mod with a partial claim identified by pool prefix “ET”. Below find a chart of issuance by program:
As policy interest rates continue to rise and economic activity begins to slow, attention in the mortgage market shifts towards concerns about the potential for borrower distress. We are early in this process as the labor market continues to add jobs, and there continue to be more job openings than people looking for work. Nonetheless, signs of strain begin to be seen, and it's worthwhile to point out early trends and consider implications. Notably, the impact of Hurricane Ian could be seen in the short-term delinquency data: 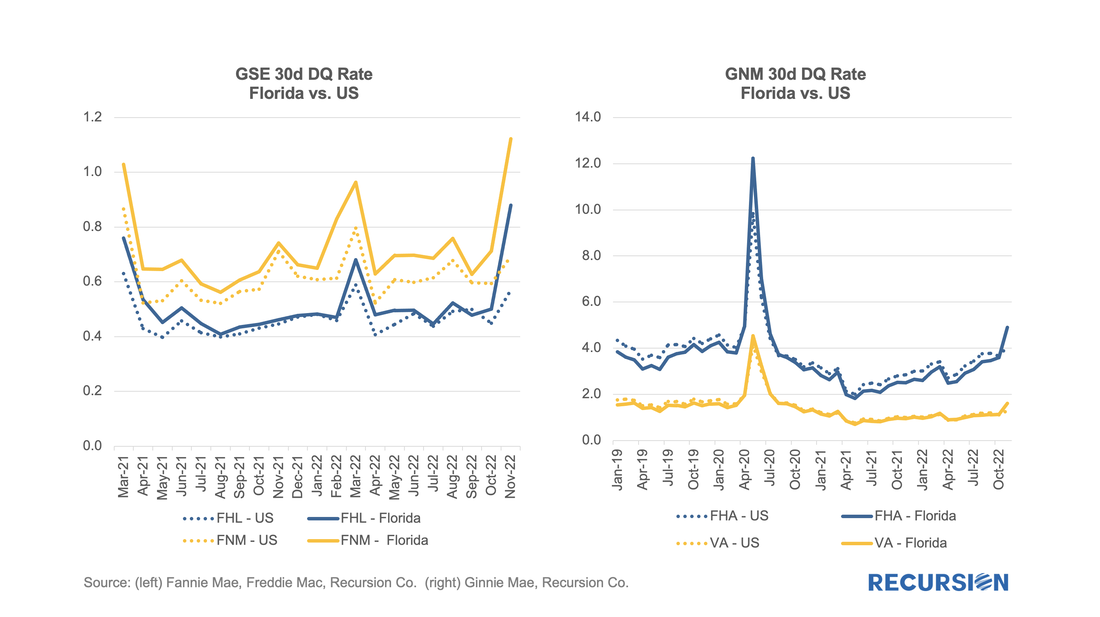 In previous posts, we discussed the trends in Ginnie Mae MBS issuance by loan purpose.[1] Recall that the decision to buy a loan out of a Ginnie pool rests with the servicer. As such, this decision is dependent in part on environmental factors that impact the profitability of this action, notably the interest rate. As loans get bought out at par, there is a greater incentive to purchase loans out of pools and get them into reperforming status when rates are low than when they are high. This relationship can be clearly seen in the following graphs: 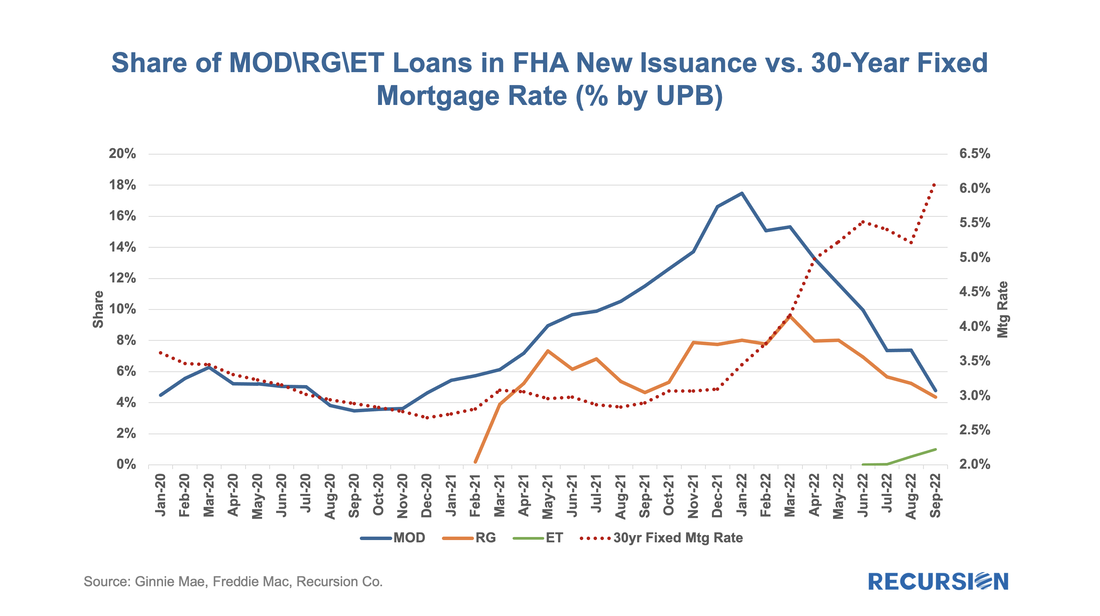 Analyzing trends in market performance requires two things, 1) a lot of data, and, 2) a deep understanding of the structure of markets. We recently came across a good example of this with relative delinquency rates between GNM and GSE pools[1]. In this post, we look at the dynamics of the two categories of reperforming mortgage loans. Investors have spent many years building models of prepayment speeds for mortgage pools based on a variety of characteristics such as loan size and underwriting characteristics. However, institutional factors can come into play as well. One that comes to mind is the difference in program structure between conventional and government loans. For the conforming market, the issuer is a GSE, while for government programs, it is the servicer. In both categories, when a loan becomes seriously delinquent, it can be bought out of the pool at par, amounting to a prepayment. The difference is that for the case of conforming loans, it is the quasi-public GSEs that perform this function, while for government programs, the decision is up to private sector entities. In the first case, there are overarching policy goals that weigh on decisions about the disposition of loans in delinquency, while in the second case, these decisions are based on financial considerations. One way to test this is to look at buyouts over the interest rate cycle. Below find a chart containing the shares of reperforming loans in new issuance for FHA, VA and the GSEs. These are loans that have been previously bought out of pools and then reissued into new pools. There can be a substantial lag between the buyout and re-issuance. 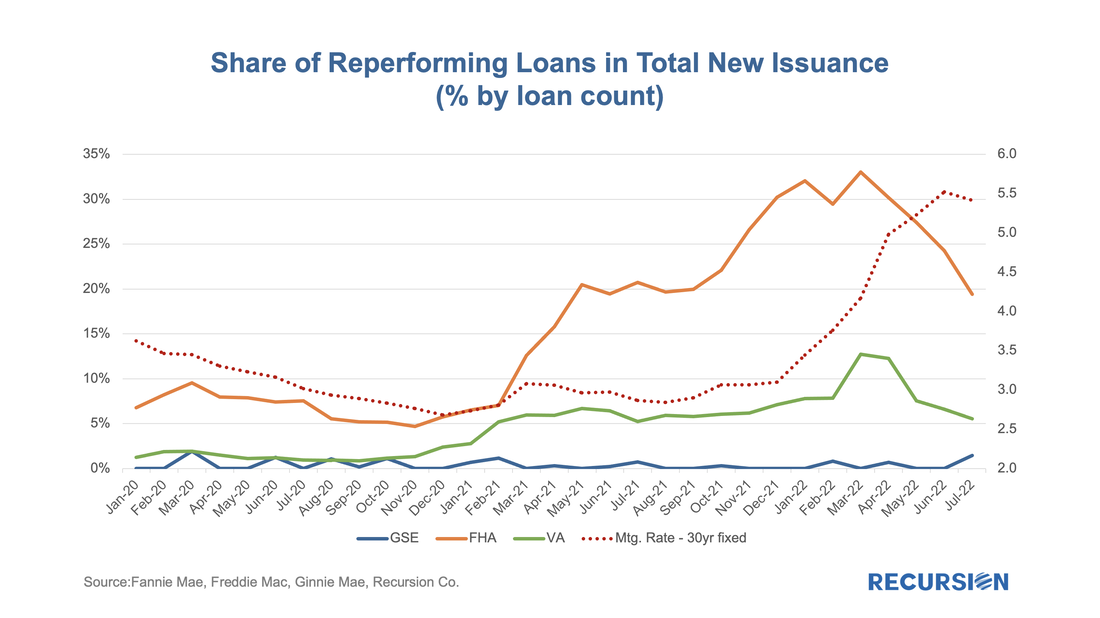 With the 30-year mortgage rate surging to a 13-year high near 5 ¼% and the FHFA purchase-only house price index at a record-high 19.42% in February (edging out the prior record of 19.39% in July 2021), we are in an unprecedented environment in the mortgage market. As such, it makes sense to update our analysis of the trend in issuance updated through April. Of particular interest in this regard are the FHA and VA programs. Let’s start by looking at FHA. By loan count, there were 107,500 FHA loans issued in GNM pools in April, with a decline of over 1/3 from the same month a year earlier. One special interest is the evolution of the share of issuance by loan purpose: 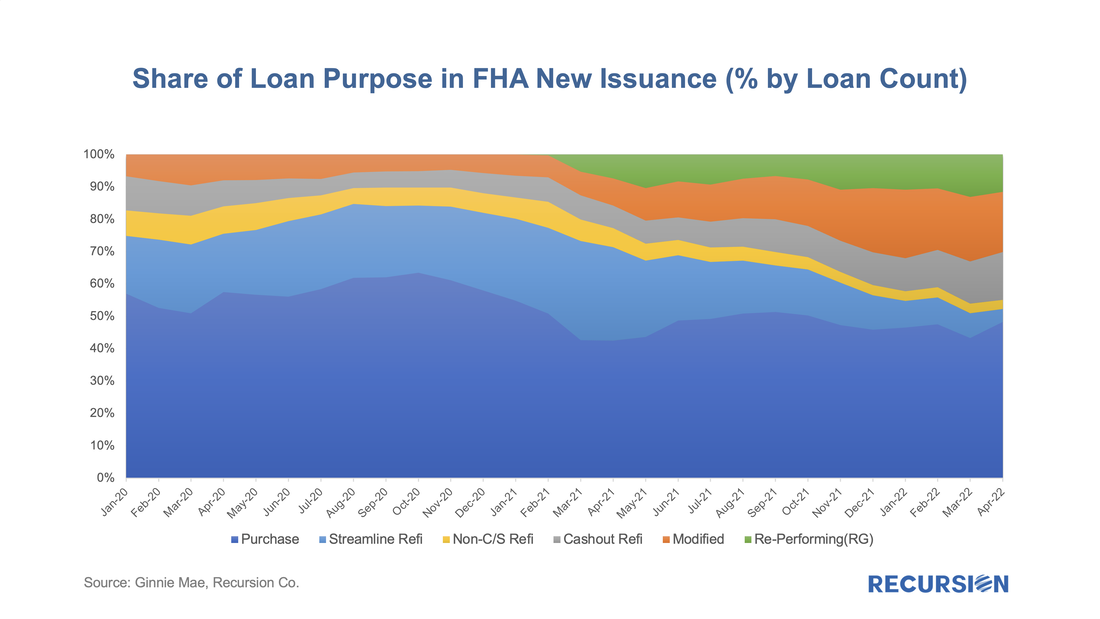 In a recent post[1], we discussed the disposition of loans that are exiting forbearance programs. In the Ginnie Mae programs, many loans bought out of pools have received modifications or other workouts, and then redelivered to Ginnie Mae pools. However, we have historically observed that there are more loans bought out than re-delivered, even considering the time needed for the workout. As it turns out, there are other market-based outlets for these loans, which is more evident at the issuer level than in aggregate. Below find a chart of buyout and securitization activities within Ginnie Mae program for Lakeview, the third-largest Ginnie Mae servicer as of April 2022. 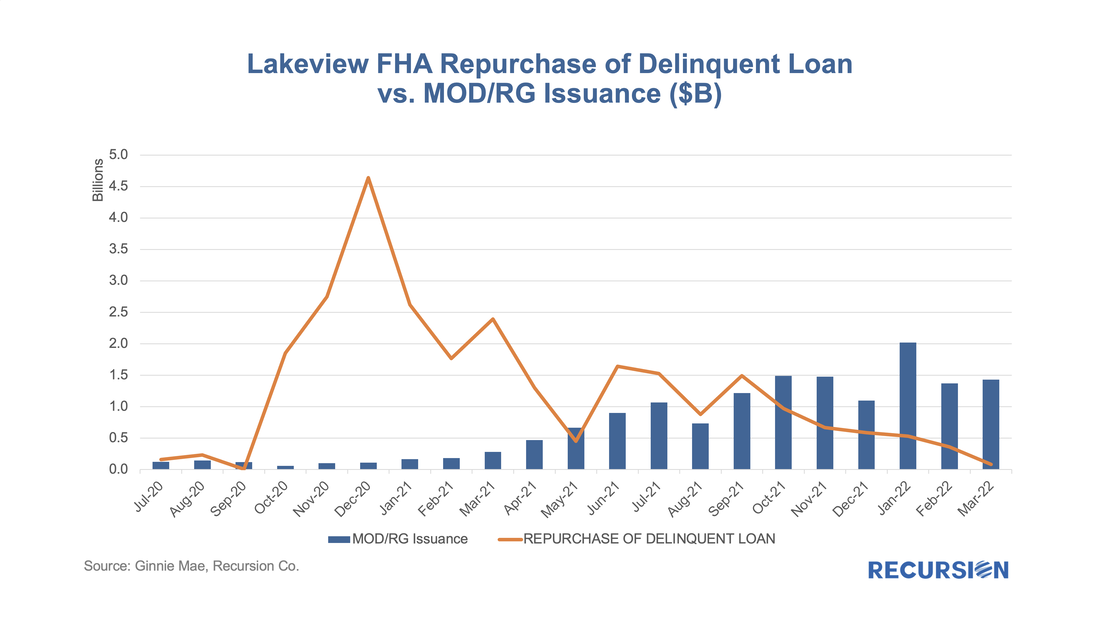 |
Archives
July 2024
Tags
All
|
 RSS Feed
RECURSION |
|

Copyright © 2022 Recursion, Co. All rights reserved.