|
With the 30-year mortgage rate surging to a 13-year high near 5 ¼% and the FHFA purchase-only house price index at a record-high 19.42% in February (edging out the prior record of 19.39% in July 2021), we are in an unprecedented environment in the mortgage market. As such, it makes sense to update our analysis of the trend in issuance updated through April. Of particular interest in this regard are the FHA and VA programs. Let’s start by looking at FHA. By loan count, there were 107,500 FHA loans issued in GNM pools in April, with a decline of over 1/3 from the same month a year earlier. One special interest is the evolution of the share of issuance by loan purpose: 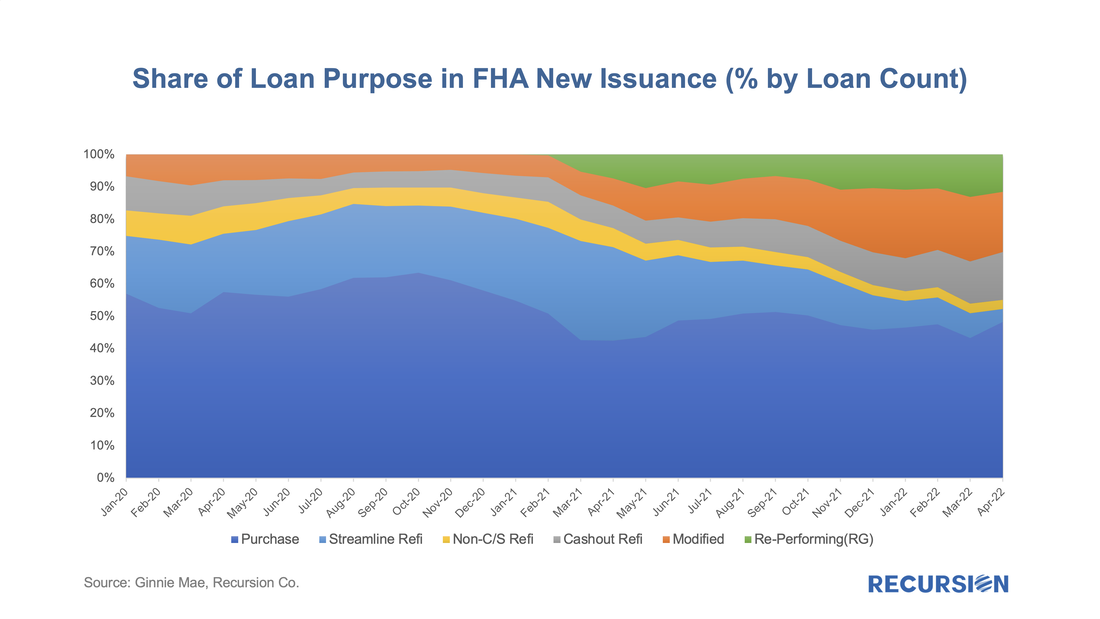 The largest share is from purchase mortgages which have comprised a steady share near 50% over the past year. But there are remarkable trends in the category of reperforming loans (RG and Mod pools) and refis. In terms of reperforming loans, the share of RG and MOD loans together in April came to almost a third of total issuance for the fifth consecutive month. Even more dramatically, streamline and non-C/S refis fell to a remarkable combined share of 7% from 35% last April. Most striking of all is the doubling in the share of cashout refis from 7% in April 2021 to 15% last month. So far, the surge in home prices has dominated that in interest rates in terms of consumer incentives for this product. Insofar as deliveries in April represent closings in February or March, we know that these trends continued, and it will be very interesting to watch this data over the next couple of months. For comparison purposes, we turn next to VA loans: 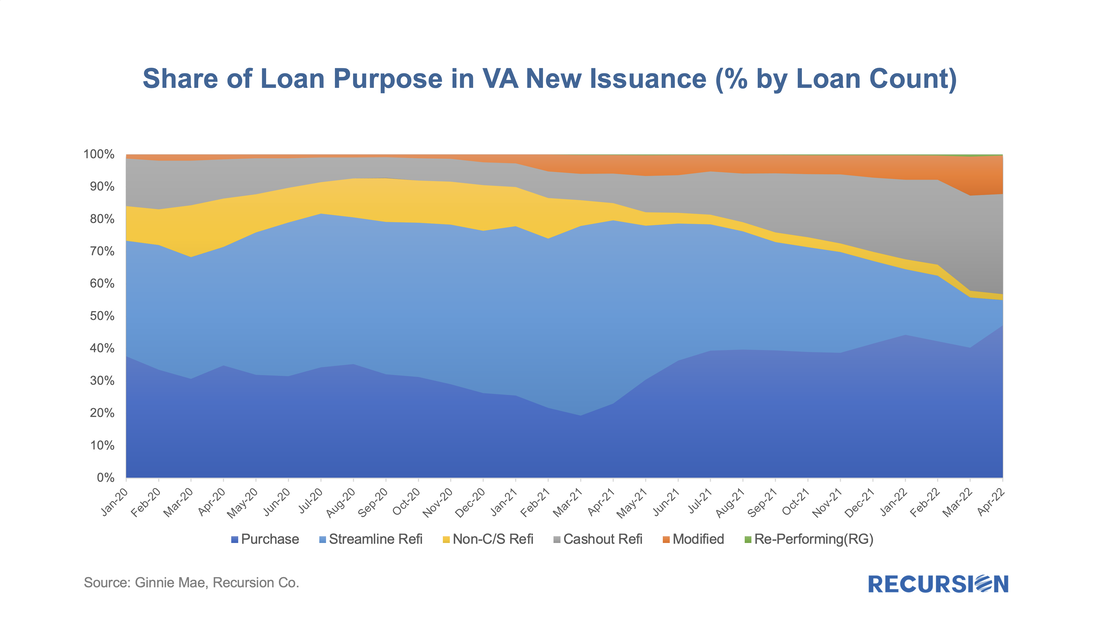 In this case, there were 63,500 VA loans securitized in VA pools in April, a 3-year low. This is a drop of over 57% from a year earlier. The first take-away is how dominant the refi market has been for VA in recent years. In March 2021, the combined share of streamline and Non-C/s Refis stood at 67% compared to 37% for FHA! Interestingly at present, the purchase share for VA is very close to that for FHA, near 50%. Reperforming loans have increased but stand at a modest 12% of issuance in April compared to well less than half that figure for FHA. But the most remarkable figure is in the category of cashout refis, which stood at 31% of April deliveries! VA borrowers are clearly more sensitive to home prices than interest rates in their lending decisions than are FHA borrowers. Once again, we see how big data in the cloud can shed light on consumer and lender behaviors in an unprecedented market environment. As we reach further into the unknown, such tools will be essential for strategic decision-making across private and public market participants. Recursion is a preeminent provider of data and analytics in the mortgage industry. Please contact us if you have any questions about the underlying data referenced in this article. |
Archives
July 2024
Tags
All
|
 RSS Feed
RECURSION |
|

Copyright © 2022 Recursion, Co. All rights reserved.