|
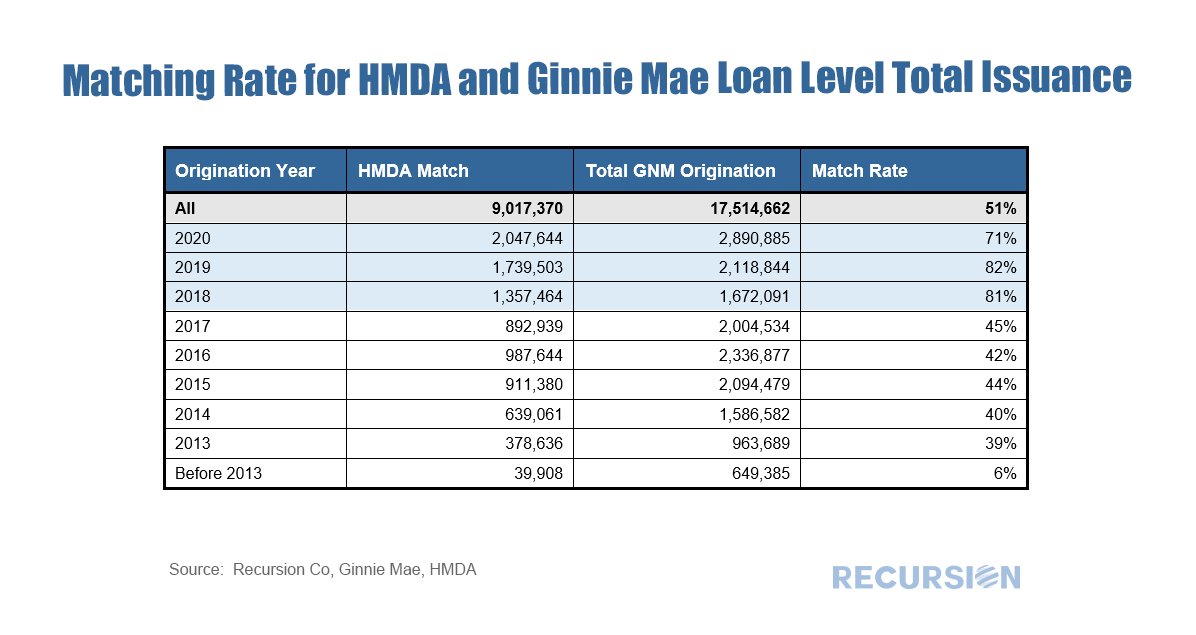
In a previous post, we mentioned the Recursion Matched data set[1], which uses a proprietary algorithm to match the loans provided in the monthly Agency loan tapes, with HMDA data. This allows for a broad analysis of loan performance (delinquency and prepayment rates) in terms of both underwriting standards (credit score, DTI, LTV) with demographic and household economic characteristics (income, race, gender, etc). We are always working to improve our algorithm, below find the match rates for Ginnie Mae loans over the 2013-2020 period. HMDA has released more characteristics in recent years, allowing for a greater matching rate.
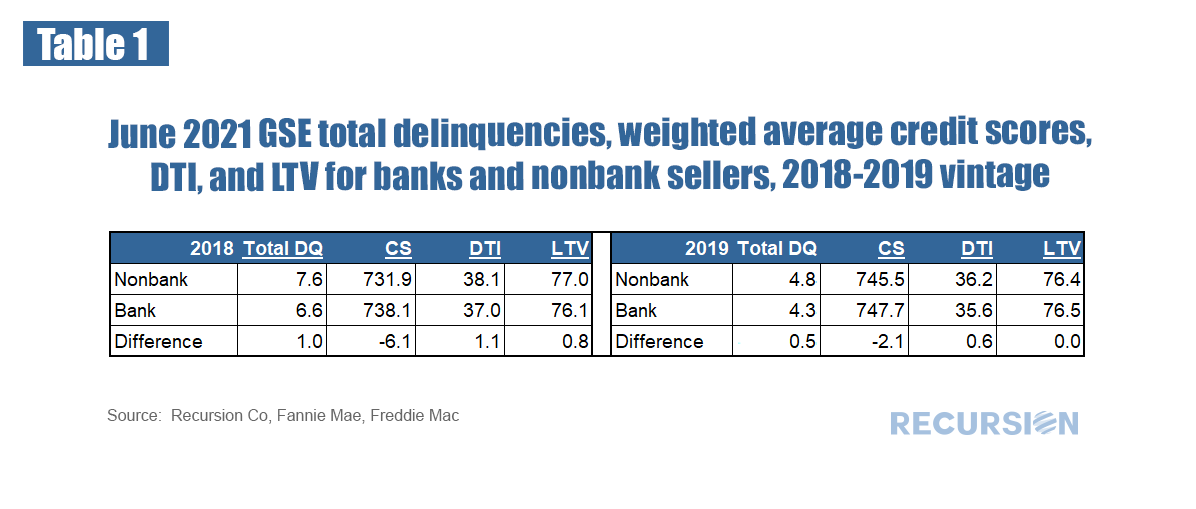
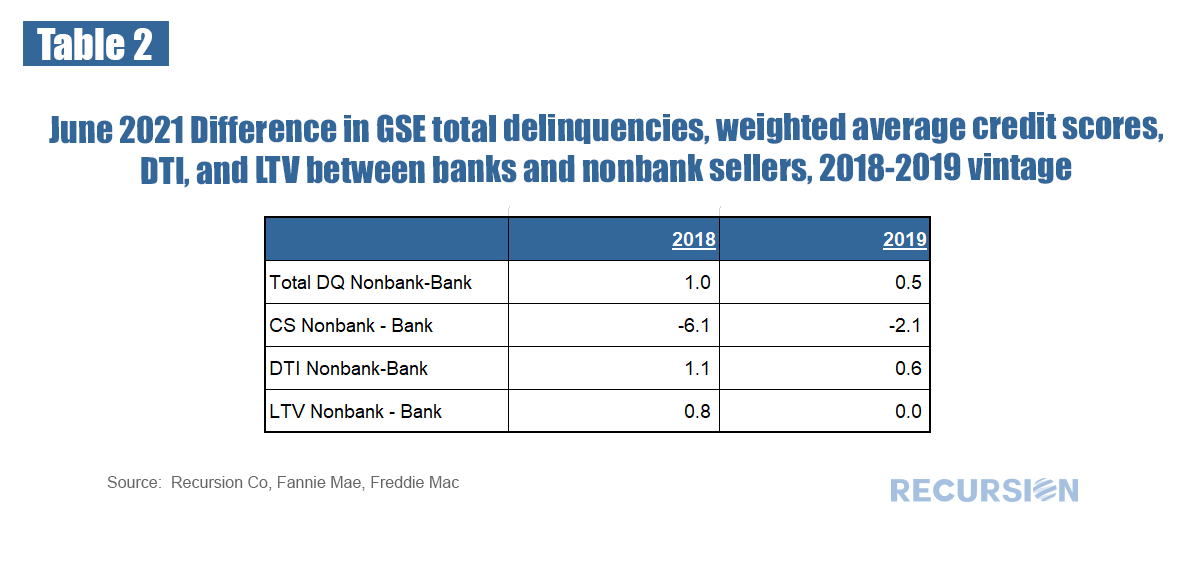
We received the first loan-level performance data for the GSE’s a few months ago, so it’s about time to see what tentative observations can be drawn from this new data set. As a popular theme for this blog is the bank/nonbank share this seems a good place to start. In general, we have noticed that nonbank DQ’s tend to be higher than those for banks, and that this distinction is correlated with the relatively more generous credit terms available in the nonbank sector. Below find a table that demonstrates this for 2018 and 2019 vintage mortgages: This can be summarized:
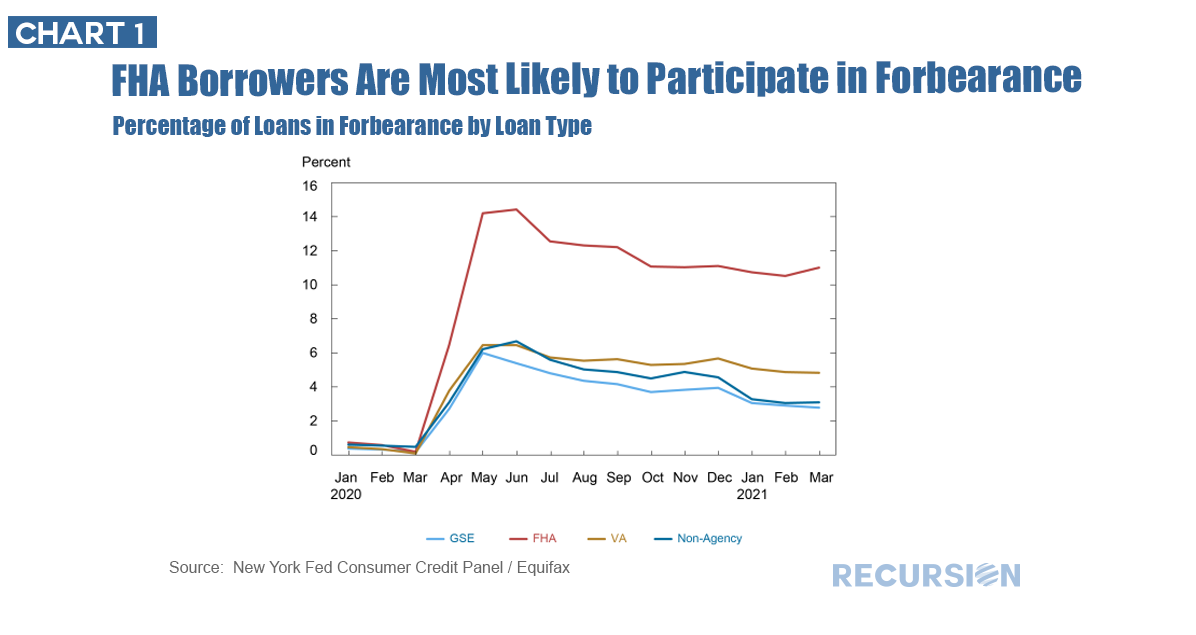
In a recent Liberty Street Economics blog post, researchers at the New York Federal Reserve discussed the background and landscape of mortgages qualifying for Covid forbearance under the CARES Act[1].
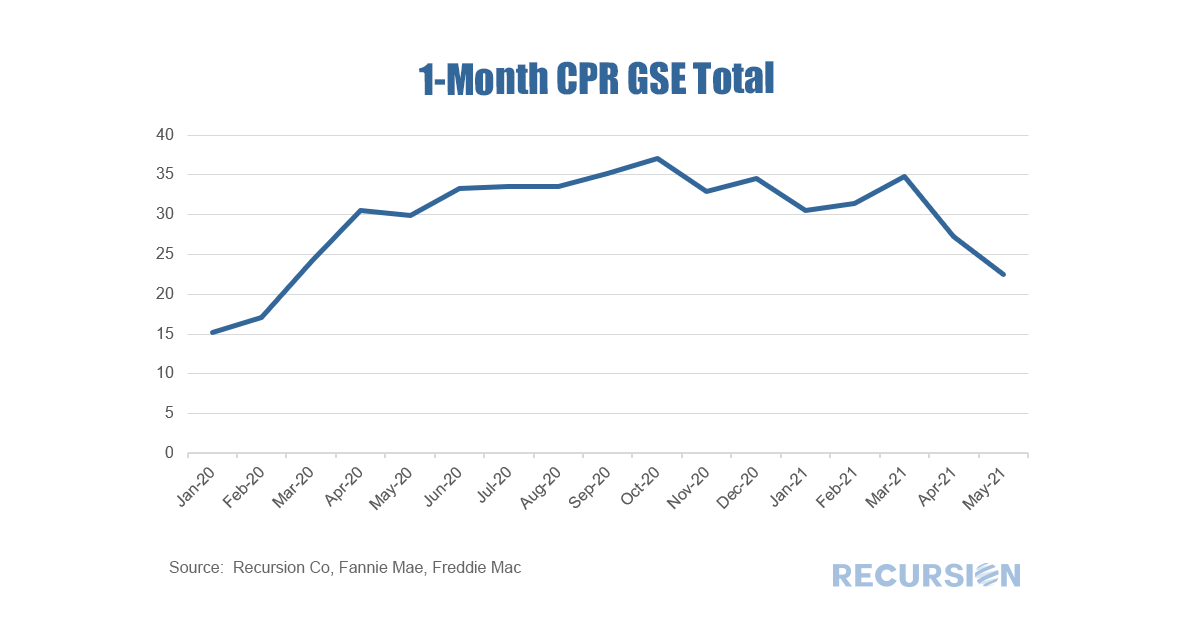
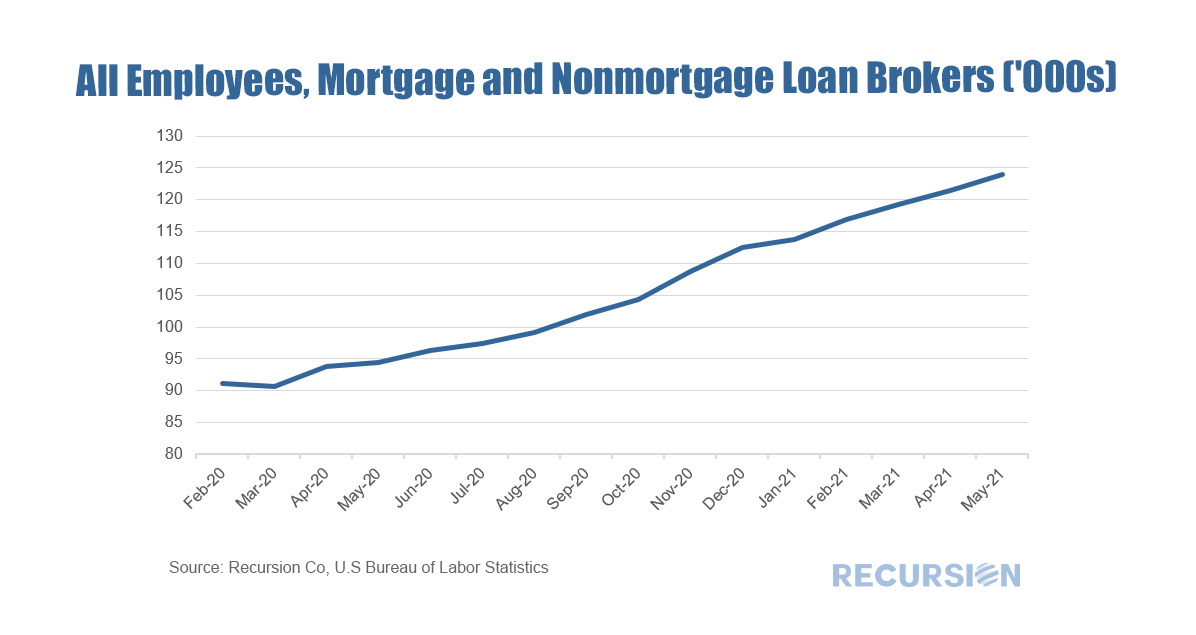
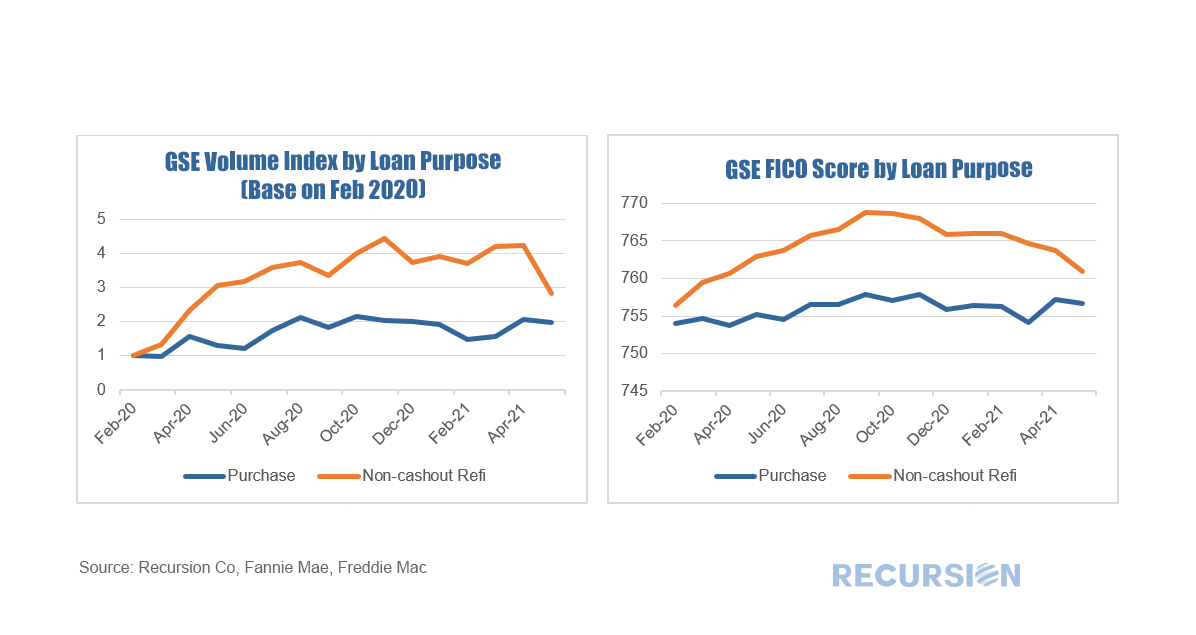
We received the monthly GSE data download for the June book of business over the weekend and prepayment speeds dropped for the second consecutive month, with the 1-month CPR printed 22.4, the low posted since 17.1% was reached in February 2020 just before the onset of the pandemic. Mortgage rates are of course the key driver here, but other issues matter as well, notably lending capacity. With the onset of the pandemic and the associated loosening of monetary policy and spike in demand for housing away from dense locations, the mortgage industry became overwhelmed. Originators were busy hiring and increased their capacity over the past 18 month to deal with the long period of refinancing activity. However, as prepayment speeds slow down, it appears that the capacity building may be overshooting. In response, originators have started to lower their underwriting standards to create enough volume to fully utilize the capacity. Traditionally, the industry fine-tunes its production through tweaking its credit standards to keep its pipeline as full as possible. This is occurring now notably for refinance mortgages: What we can see is that purchase demand remains strong, with the swing product being refinance mortgages. It is evident that lenders are trying to smooth out refinance production with countercyclical credit tightening and loosening. As credit scores are higher than was the case in the pre-pandemic period there is room to ease further, but the ultimate extent is highly uncertain.
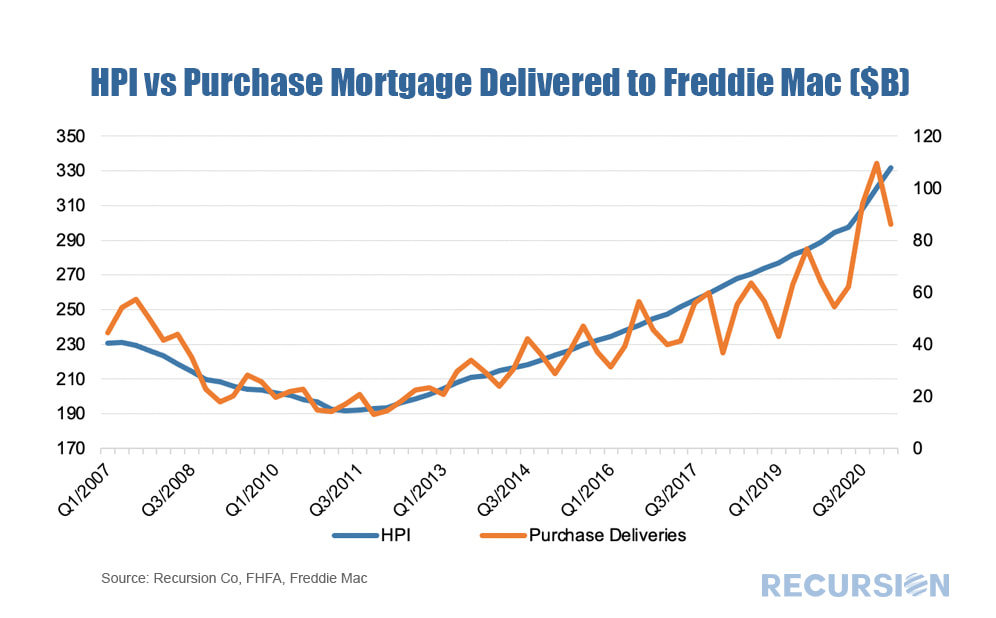
Recently, the Federal Reserve released its May 2021 Financial Stability Report[1], with a particular emphasis on asset valuations. Valuations are raised as a concern as “Prices of risky assets have generally increased since November with improving fundamentals, and, in some markets, prices are high compared with expected cash flows”. While not cited as a matter of high alarm the report commented that “House price growth continued to increase, and valuations appear high relative to history.”
On May 25, FHFA released the purchase-only house price index for March, showing a record-high growth rate of 13.9%, far above the bubble-era peak of 10.7% attained in 2005[2]. Housing fundamentals are of course supportive with mortgage rates below 3% and economic activity rebounding as vaccine optimism spreads. The unique factor now in housing is the impact of the pandemic on preferences for housing away from density and towards suburban and smaller-urban centers. This new fundamental can easily be seen via booming housing demand during the pandemic as measured here by purchase mortgage deliveries to Freddie Mac[3]. |
Archives
July 2024
Tags
All
|
RECURSION |
|
Copyright © 2022 Recursion, Co. All rights reserved.

 RSS Feed
