|
We received the first loan-level performance data for the GSE’s a few months ago, so it’s about time to see what tentative observations can be drawn from this new data set. As a popular theme for this blog is the bank/nonbank share this seems a good place to start. In general, we have noticed that nonbank DQ’s tend to be higher than those for banks, and that this distinction is correlated with the relatively more generous credit terms available in the nonbank sector. Below find a table that demonstrates this for 2018 and 2019 vintage mortgages: 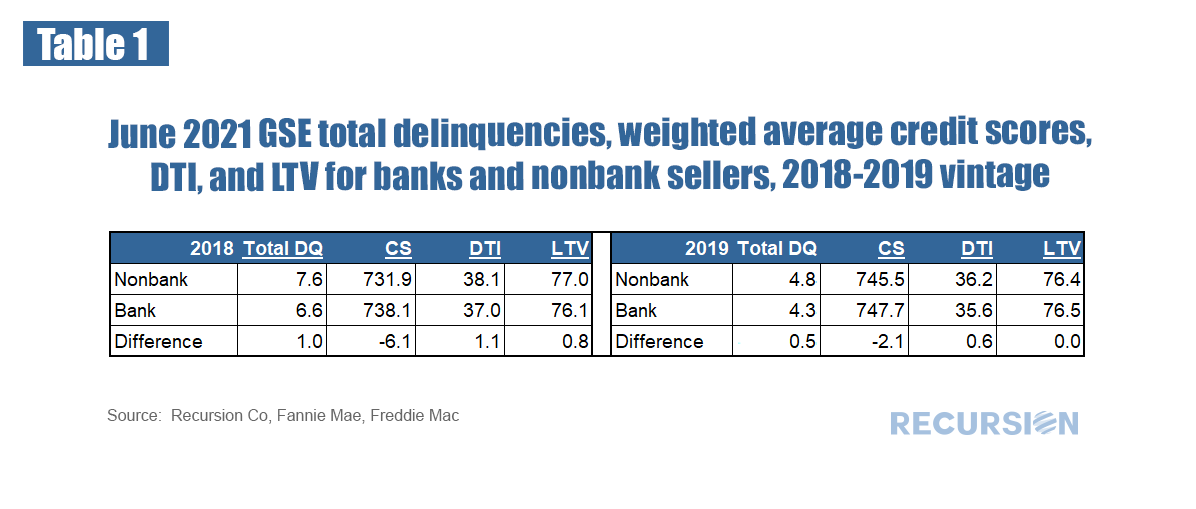 This can be summarized: 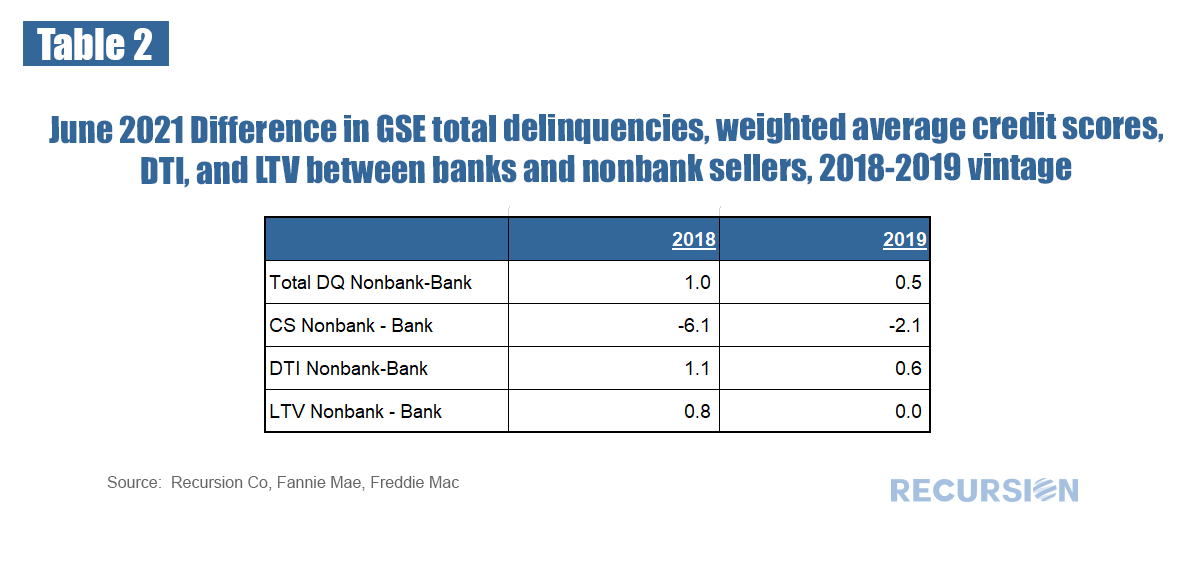 Higher DQ’s for nonbanks relative to banks is associated with looser relative underwriting standards for nonbanks regarding credit score, DTI and LTV, with the exception of LTV for the 2019 vintage. An additional potential consideration to explain the performance difference has to do with underwriting quality. That is, in any given credit bucket do banks outperform nonbanks? There are many ways to slice this data to get to this issue, but as a first try let’s break down performance into credit score buckets and look at performance and distribution of market volumes across these categories for the two vintages. 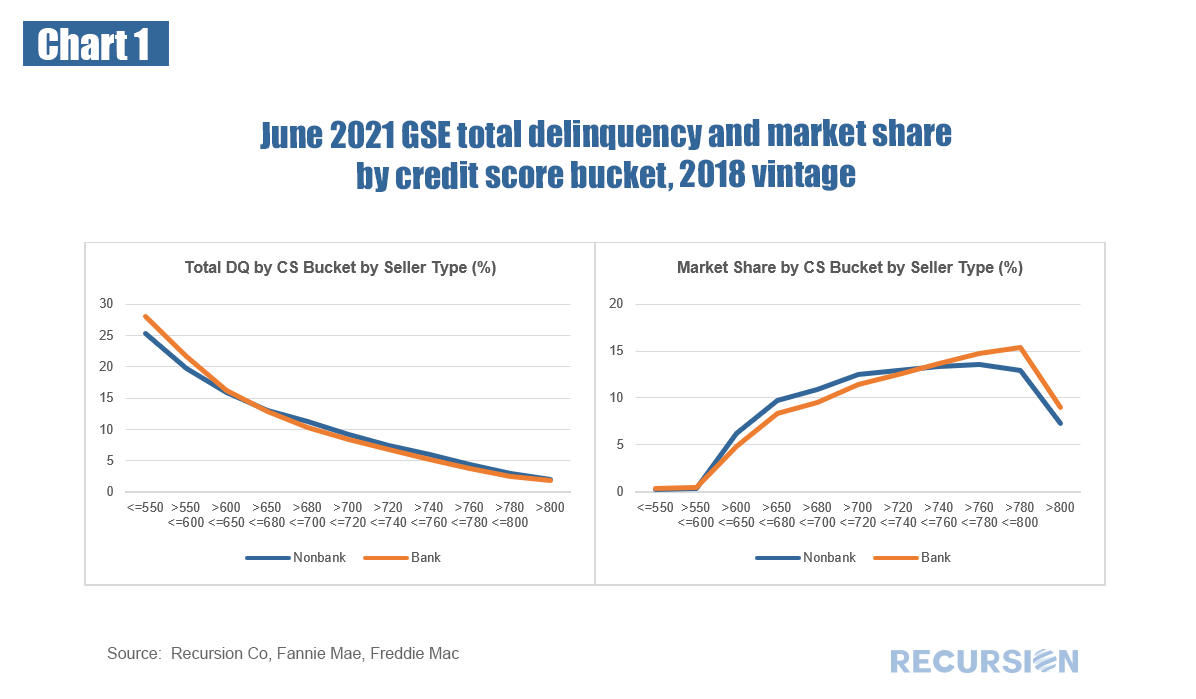 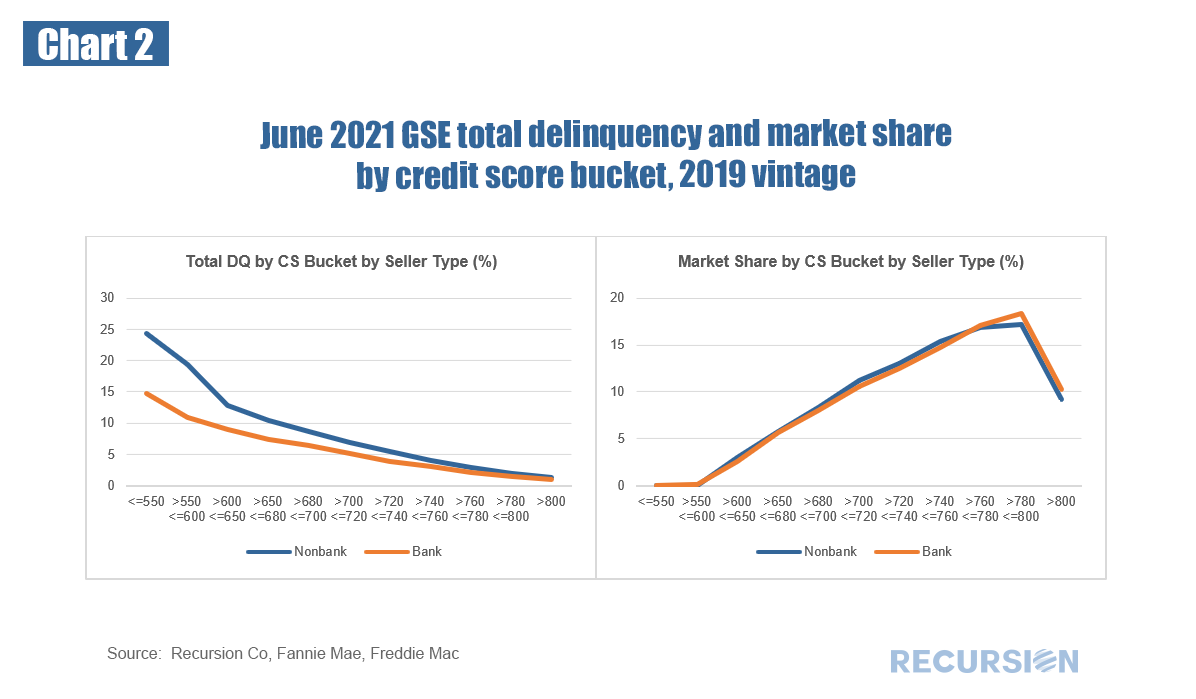 Both vintages are interesting in their own right but even more notable are the differences between the two years. In 2018, nonbanks had a higher share of their mortgage production in the credit score range of 620-740 while banks focused on higher credit score borrowers. This was somewhat offset by worse performance on the part of banks at the very lowest credit category relative to nonbanks.
By 2019, the distribution of credit scores had become nearly identical across the two seller types, but nonbanks distinctly underperformed banks at the low end of the credit distribution. The tentative takeaway here is that the performance difference over time between banks and nonbanks reflects changes in market conditions. 2018 was a high mortgage rate year, so to gain share, nonbanks looked to the lower credit score cohorts to enhance their businesses. But at least at the very risky tail of the distribution, they were more careful. 2019 saw the start of a slide in mortgage rates, implying there was plenty of business across borrower segments, so nonbanks could grow by using their technological advantage and lower regulatory costs to their advantage without having to rely on a larger share of low-credit quality borrowers. The pace of growth may have been such that performance at the low end started to slip. |
Archives
July 2024
Tags
All
|
 RSS Feed
RECURSION |
|

Copyright © 2022 Recursion, Co. All rights reserved.