|
In a recent Liberty Street Economics blog post, researchers at the New York Federal Reserve discussed the background and landscape of mortgages qualifying for Covid forbearance under the CARES Act[1]. 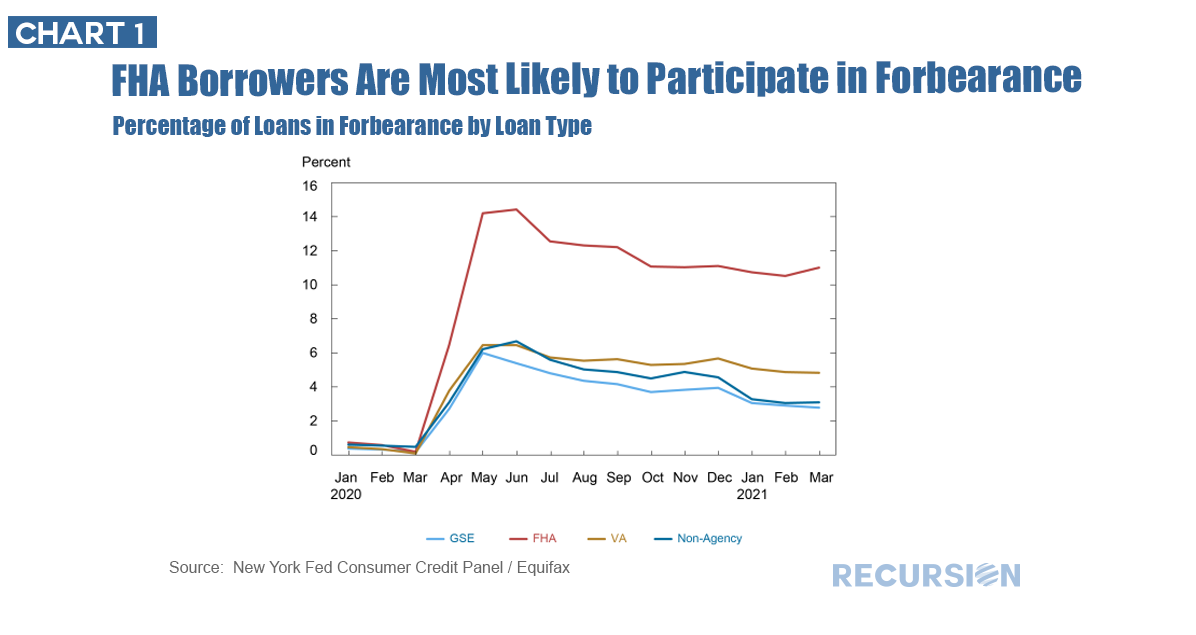 In our own recent post, we pointed out how our Agency loan tape data could be used to benchmark the findings presented by the central bank on the subject of first-time homebuyers[2]. We noted in particular that the data available from the Agencies (Fannie Mae, Freddie Mac and Ginnie Mae) consists of about 80% of the 5 million purchase loans originated in 2020, (or close to 4 million loans) while the Fed 5% sample would consist of about 250,000 mortgages. Forbearance analysis can be benchmarked in a similar fashion, with the important distinction that in this case we are talking about the stock of outstanding loans, rather than the flow associated with new production. This distinction creates interesting analytical challenges. First, the outstanding number of all mortgages at the end of Q1 was about 80.4 million, according to the NY Fed[3]. So a 5% sample would be about 400K loans. Our number of loans from the agency tape is about 36million. Chart 2 below shows forbearance rates by category based on the agency data (note we have no non-agency data on this basis): 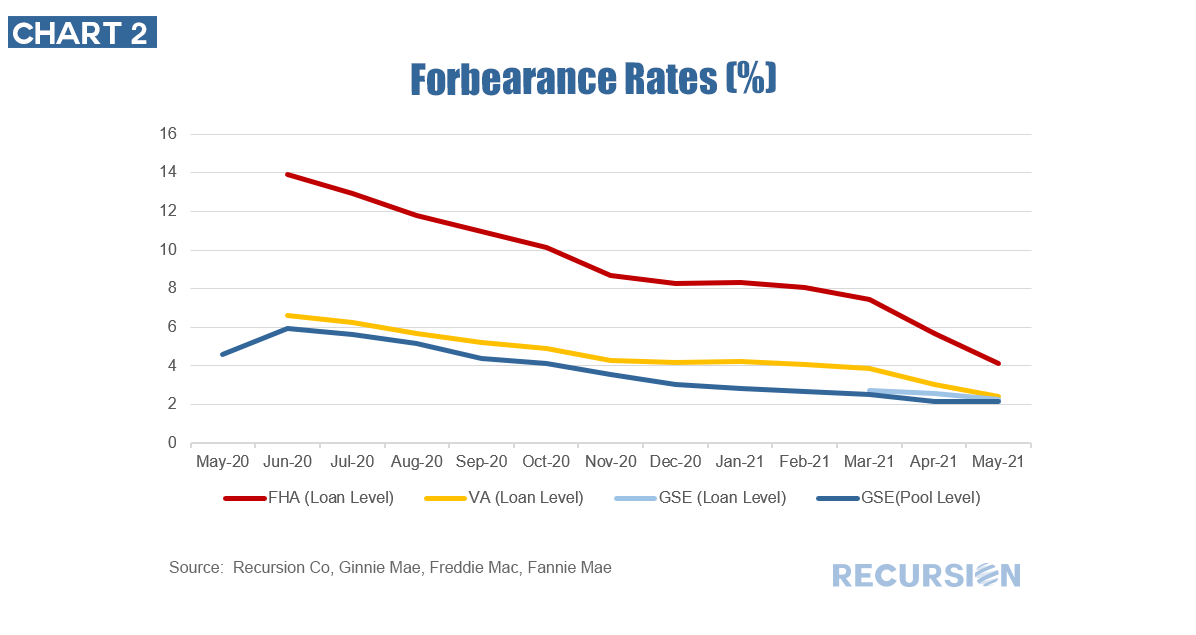 *This can be duplicated using the above three queries Some explanation is in order here. First, consider the case of the GSEs. In this case we have two lines. The blue line, which comes from pool-level disclosures, shows the forbearance rate for the Enterprises falling from about 6% last June to a little more than 2% in May 2021. The green line comes from loan-level disclosures, which only go back to March 2021. It tracks the blue line closely. From Chart 1, we see the 5% sample falling from 6% to about 3% in March, following our pool-level trend with modest differences. Second, for VA loans, our loan-level data drops from 7% last June to 2% in May 2021. Chart 1 shows a similar rate for June 2020 but a much slower rate of decline after that than we show in Chart 2. Finally, there is the case of FHA. In both ours and the Fed’s data, the rate last June was near 14%, but ours drops off much faster from that point. What’s up here? The key difference in this case is that the loans in agency pools are generally bought out once they have been delinquent for more than three months. In the case of Government programs (FHA and VA) this transaction is conducted by the servicers. For the GSE’s, it is conducted by the Enterprises themselves. Forbearance, however, breaks this relationship as loans in these programs are not viewed as “delinquent” from the point of view of automatically triggering buyouts. As servicer and Agency buyers tend to face very different incentives, and it is not surprising that there is a significant difference in the activity between the various programs: 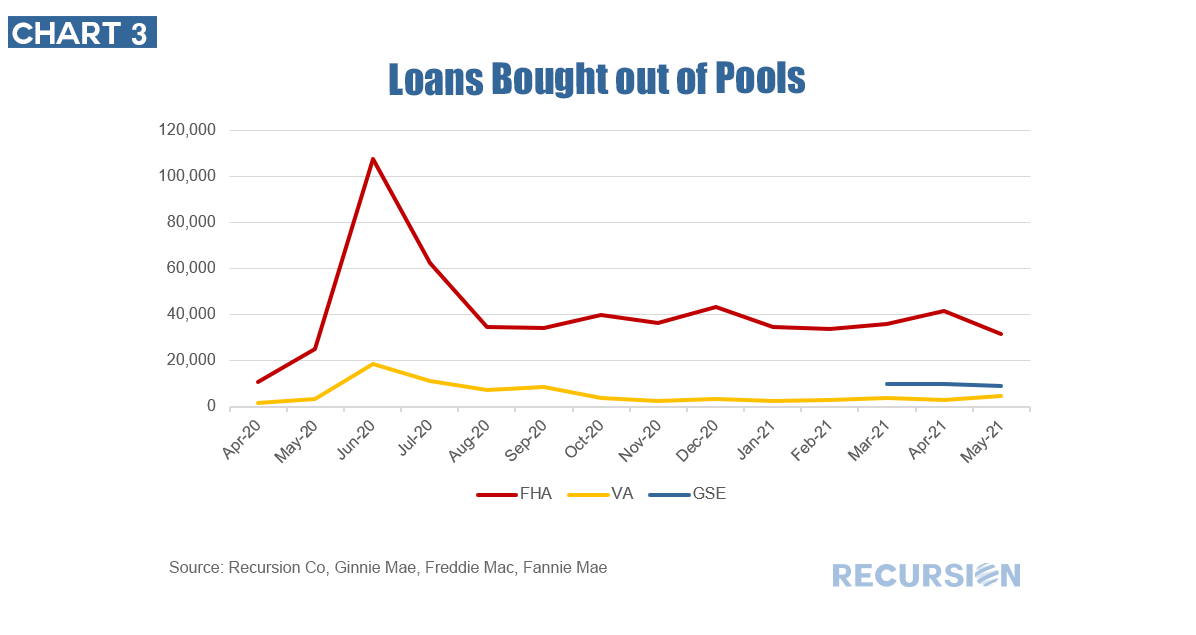 *This can be duplicated using the above two queries Clearly, many more loans are bought out of FHA pools than either VA or GSE pools. Adjusted for book size, FHA loans are being bought out at about 4.7 times the rate of VA loans and about 13.8 times that of GSE loans. As we lose visibility on loans once they are bought out, the pool level data become less representative of the total market the more this activity takes place. Since there are relatively few buyouts from GSE pools, it’s easy to see why the two approaches are closer for this category. This may not continue once forbearance starts to run out. Does this mean that the Government data from the 5% sample must be taken at face value? Well no, there is yet another dataset. We have written previously about the FHA Neighborhood Watch data[4] which provides a full picture of all outstanding FHA loans. Performance data is provided and our view of forbearance rates from this source is contained in Chart 4: 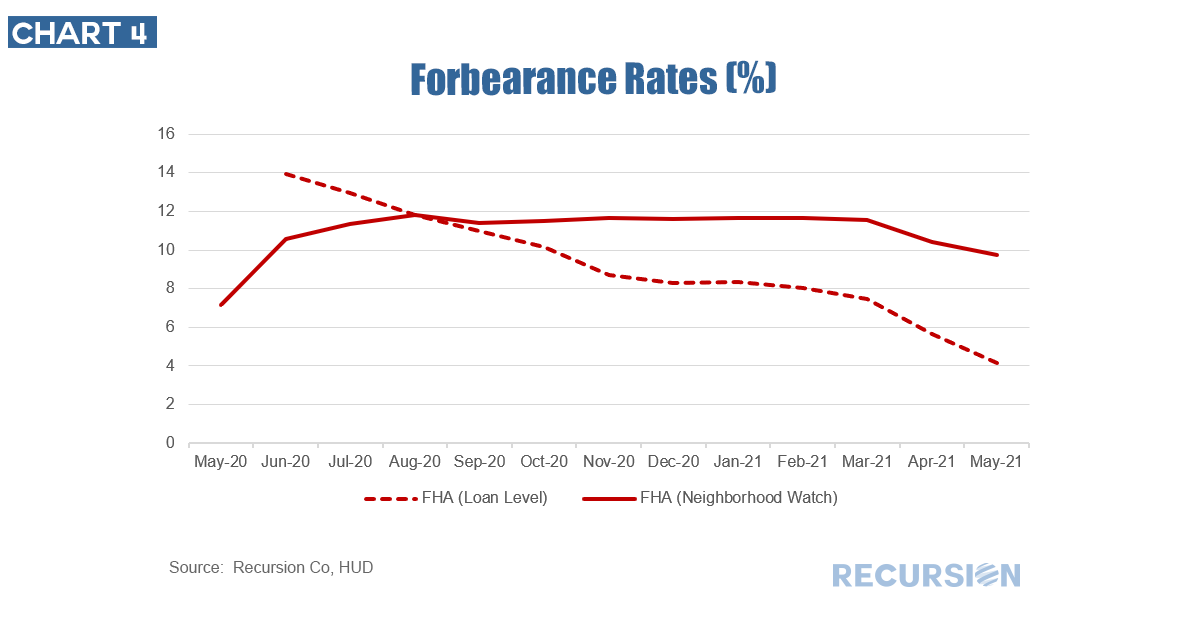 Interestingly, forbearance rates from the Neighborhood Watch data in the early period of the pandemic were less than those in both the Ginnie Mae pools (chart 2) and 5% sample data (chart 1). Moreover, the Neighborhood Watch forbearance rate was very steady for the July 2020-March 2021 period near 12% before declining modestly beginning in April this year. This is intuitive given the sharp rise in unemployment that occurred when Covid-19 first struck, and that the program was originally designed to last for 12 months. The point here is that the complexities inherent in the mortgage market are such that no sample may be considered authoritative by assumption. The act of benchmarking is very useful in providing insights, and in fact essential for market participants and policymakers to gain confidence in the analysis that is conducted based on it. The sample technique employed by the Fed is very useful in terms of the breadth of data contained in the file pulled for each borrower. In particular, it contains demographic data and information on other debts besides home mortgages. The Agency data is notable for timeliness and a great wealth of underwriting data for each borrower. Recursion is working hard to supplement the Agency data with information from other sources, and the results will be the subject of future posts. [1] https://libertystreeteconomics.newyorkfed.org/2021/05/keeping-borrowers-current-in-a-pandemic.html
[2] https://www.recursionco.com/blog/benchmarking-first-time-home-buyers [3] https://www.newyorkfed.org/microeconomics/hhdc.html. Presumably, this number is scaled up from their 5% sample. [4] https://www.recursionco.com/blog/partial-claims |
Archives
July 2024
Tags
All
|
 RSS Feed
RECURSION |
|

Copyright © 2022 Recursion, Co. All rights reserved.