|
Recently, researchers at the Federal Reserve published a blog about trends in first time home buyers (FTHB)[1]. They utilize a dataset that is a 5% sample of credit files from a credit bureau. It appears from their analysis that there was a bit fewer than 5 million loans originated in 2020, so it would seem they are using a sample of around 250,000 loans. It is natural to ask how their measure of first-time home ownership compares with our calculation using Agency loan level delivery data consisting of over 4 million loans for that year. To start, we can look at the trend of purchase mortgage delivery for the past seven years: 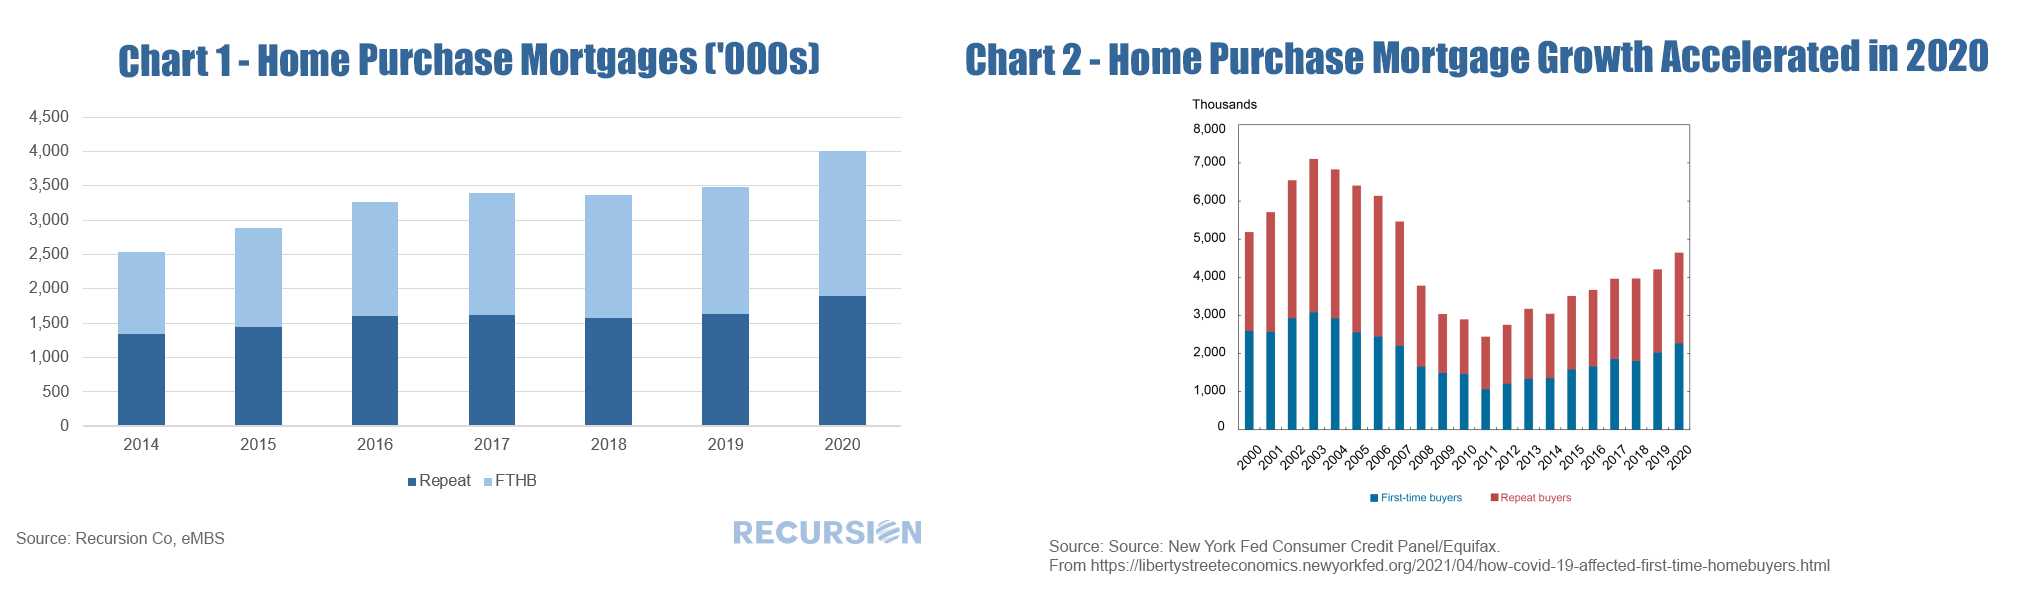 And second, we can compare estimates of first-time homeownership: 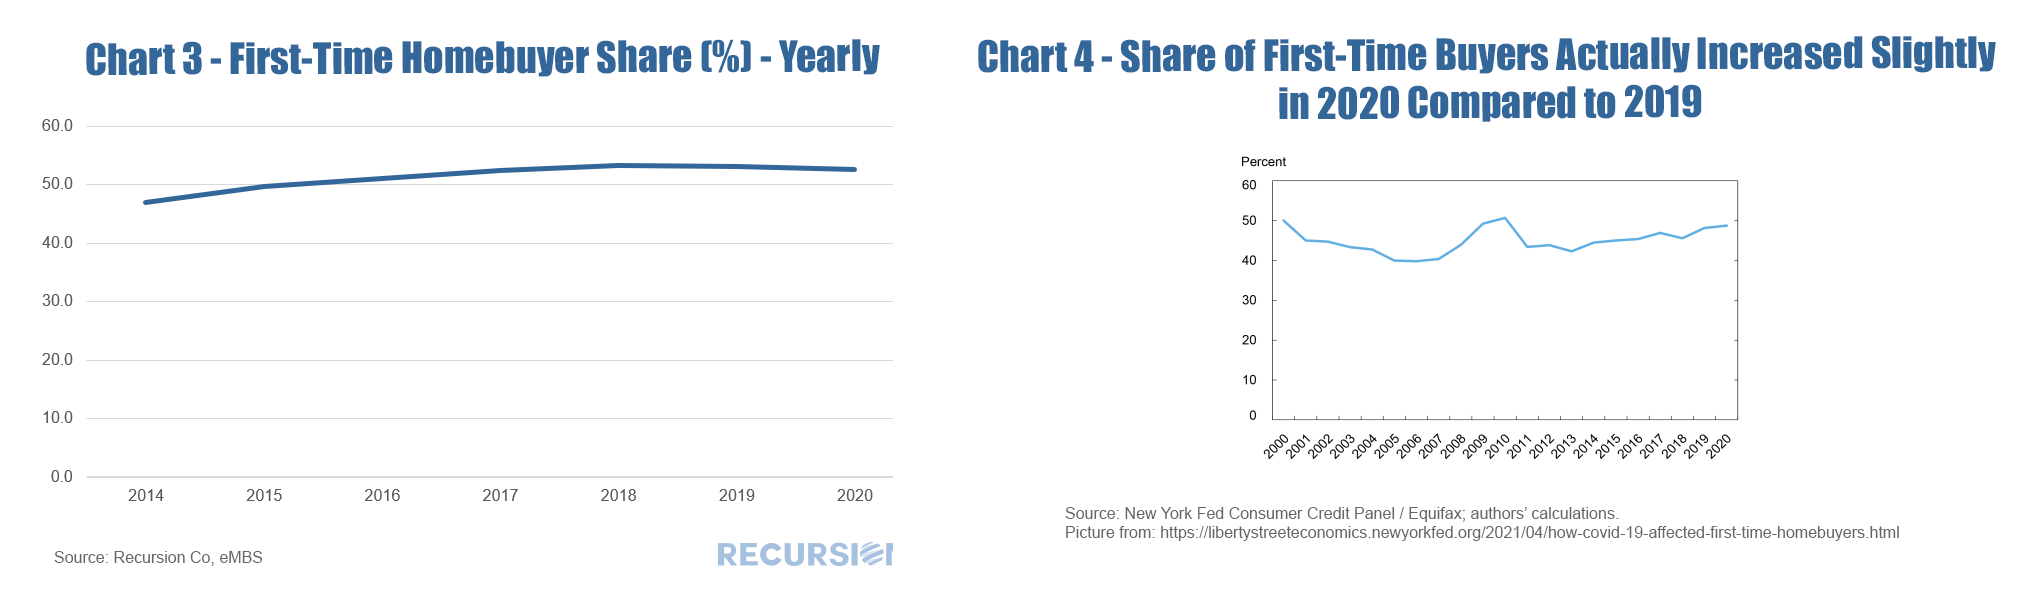 There are several distinctions to be made between the two data sets that are worth pointing out. First, the loan level delivery data only goes back through 2014 on an annual basis. Second, the Agency delivery data does not include loans originated but held on investor balance sheets, including any non-QM loans. A third difference is that the Fed researchers consider FTHB to be the first-ever mortgage file for a household while the Agencies consider a household to be “first-time” if they have not owned a house in more than three years. The number of loans delivered to the Agencies in 2020 increased by considerably more (15.1%) in Chart 1 than that from the credit bureau (10.5%) in Chart 2, which does not reflect a difference in the growth in the total number of loans originated, but rather an increase in the share of originated loans delivered to the Agencies. During Covid, investors preferred to hold mortgages with insured credit risk. This can be seen in the sharp decline seen in the “not sold” category from the recent 2020 release of HMDA data. 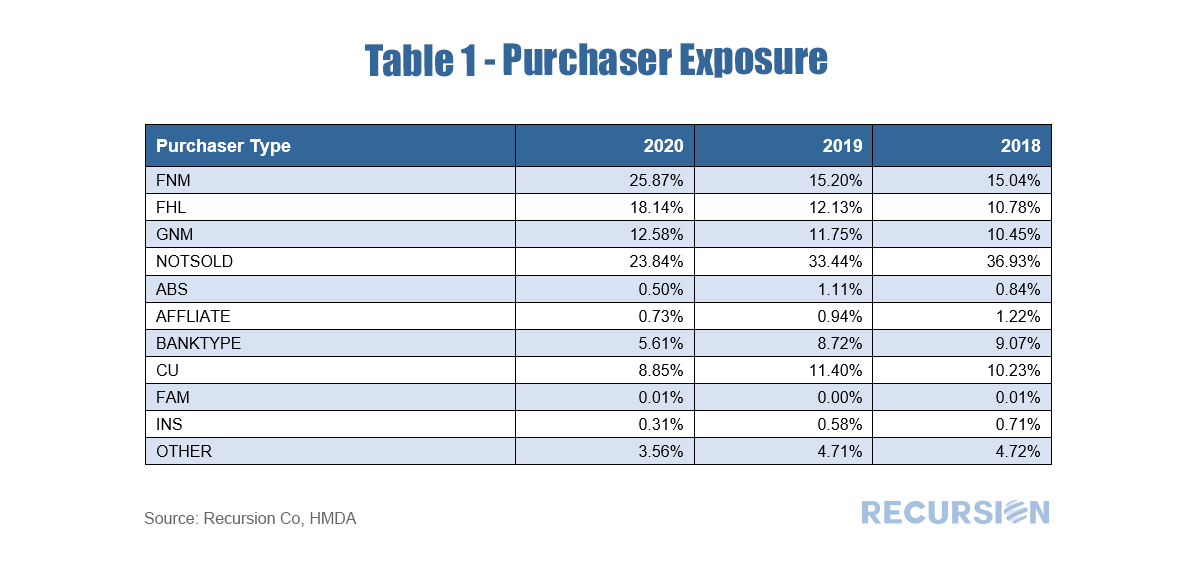 The share of FTHB in our data is slightly higher than in the Fed report, which may be due to a low FTHB share in segments such as Jumbos and non-QM loans not included in our datasets. But a key difference is that our FTHB share declined slightly in 2020 from the prior year (52.5% from 53.1%) while it rose slightly in the Credit Bureau data (48.8% from 48.2%). A rigorous attribution of the difference is beyond the scope of this note, but a few comments based on the composition of our delivery data can be made. First, in our data, the decline in the first-time homebuyer share can be attributed to a rise in the market share of conforming loans with lower FTHB shares at the expense of GNM loans with higher FTHB shares[2]. Second, our data comes in monthly so we can look a bit at the dynamics within the year: 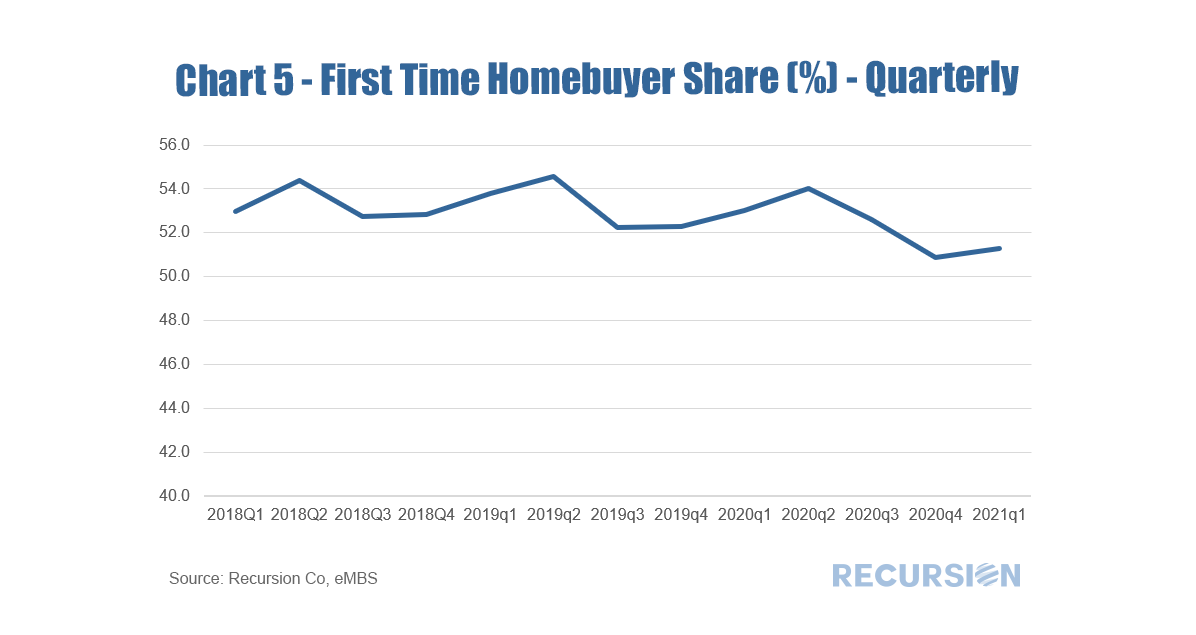 Interestingly, we show the FTHB share picked up in a normal seasonal pattern in 2020 Q2 and Q3, when the pandemic hit with full force. However, in Q4 the share declined to pre-pandemic levels, and rebounded only slightly in the first half of this year. It will be very interesting to monitor these trends going forward. |
Archives
July 2024
Tags
All
|
 RSS Feed
RECURSION |
|

Copyright © 2022 Recursion, Co. All rights reserved.