|
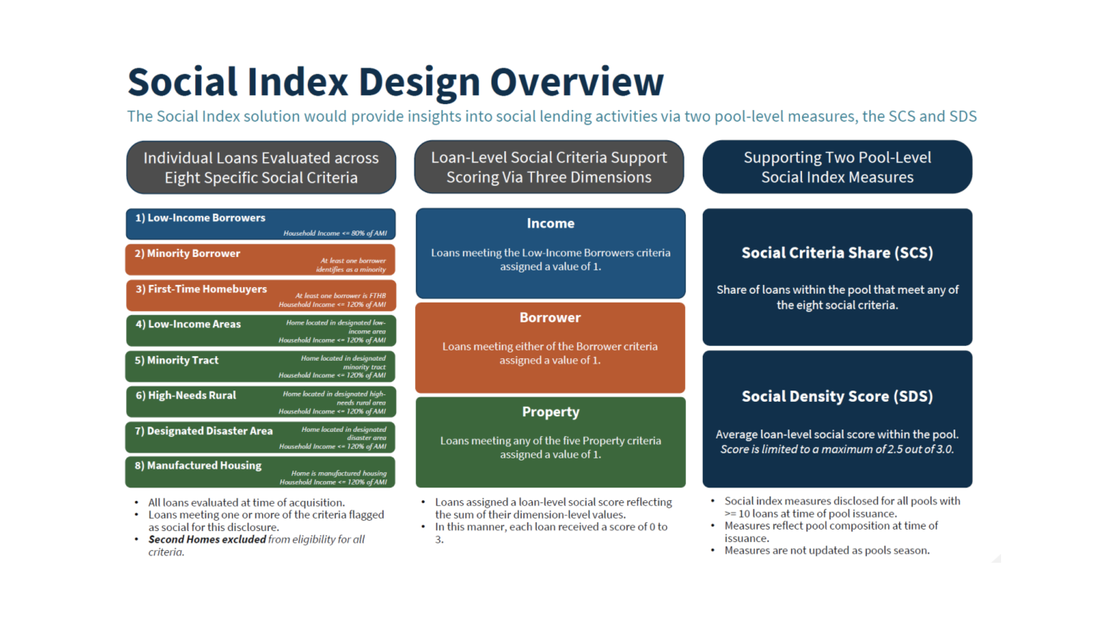
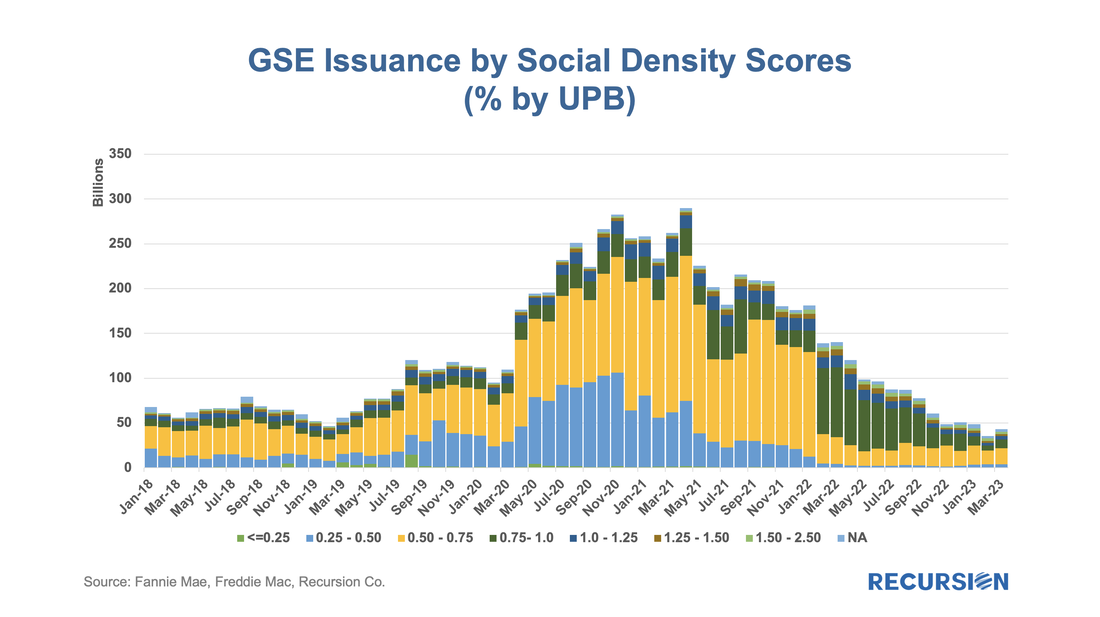
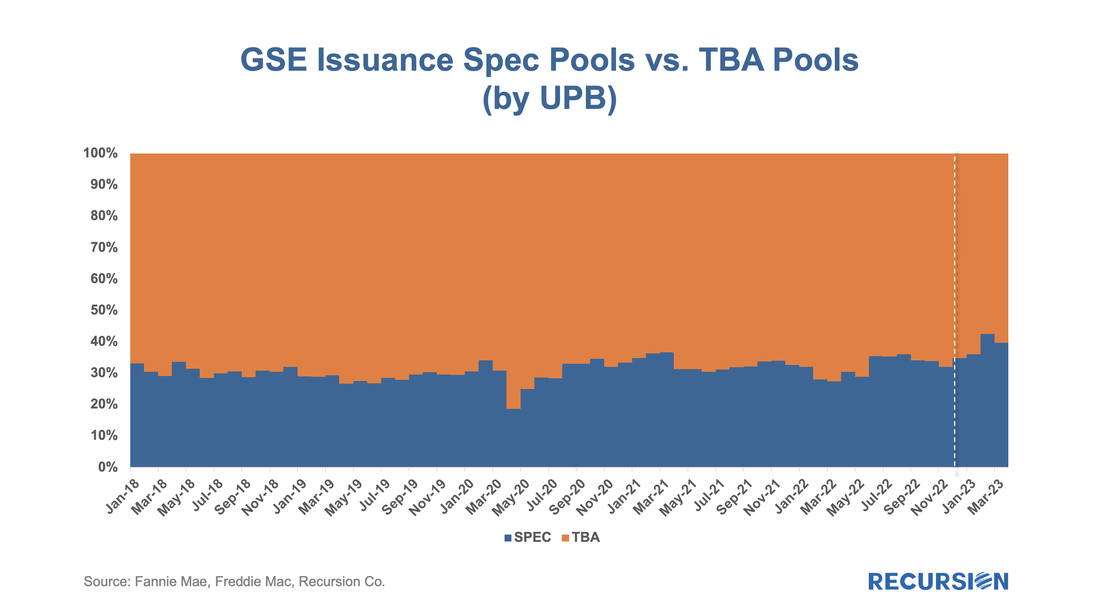
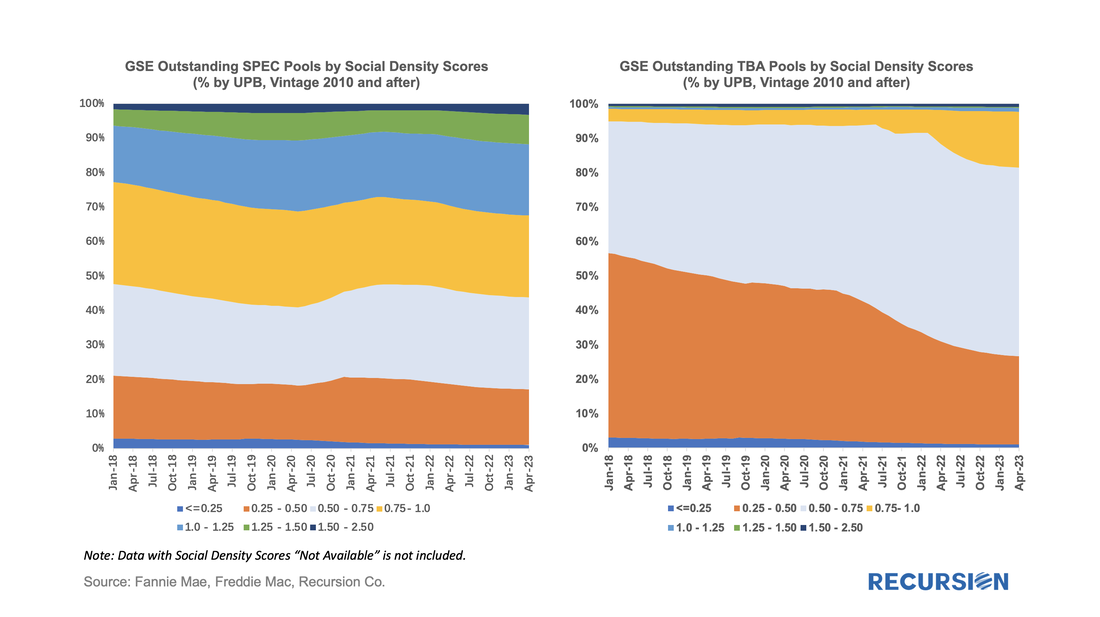
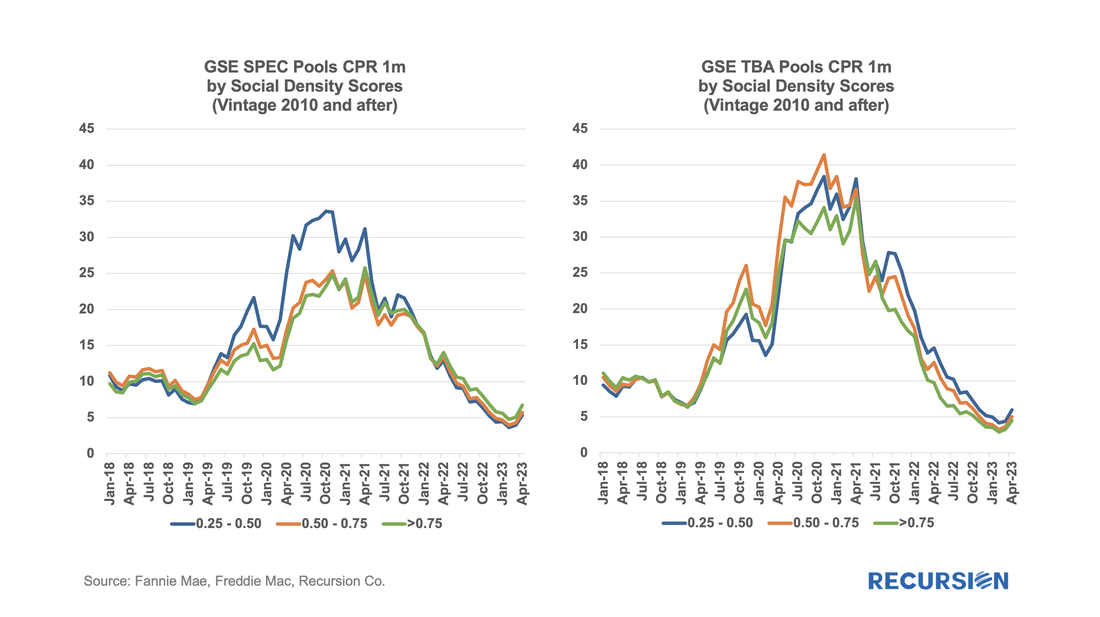
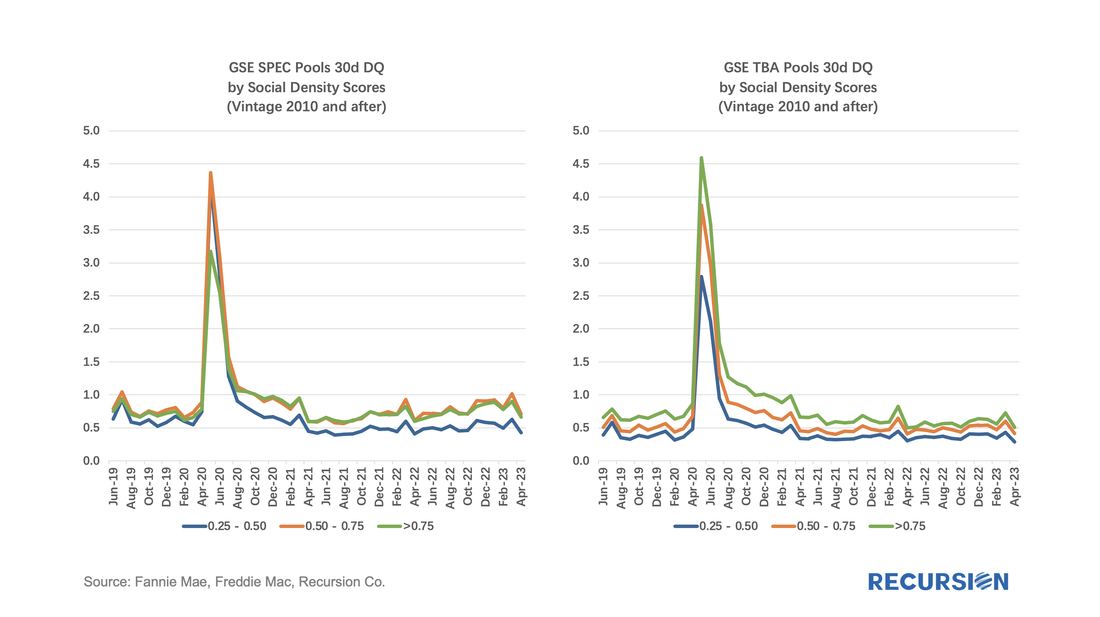
Since the end of last year, the Government Sponsored Enterprises have released so-called “Social Score” Indexes that are made to appeal to ESG investors. Both Fannie Mae and Freddie Mac produce scores at the pool level based on a variety of social metrics. The following methodology summary comes from Fannie Mae[1] (Freddie Mac has adopted the same methodology as Fannie Mae’s): As can be seen in the above graphic, the pools are scored based on eight specific social criteria across three dimensions to create two distinct scores for each pool. Here, we focus exclusively on the Social Density Score (SDS) which is assigned to pools based on the average score of loans in the pool but capped at a score of 2.5. In this note, we are not addressing the potential social impact of this program, but rather the impact on the MBS market itself. The following chart shows time series of the distribution of SDS scores of GSE issuance[2] over time. We think about the market impact as the difference in the distribution of social scores between TBA and Spec pools. Spec pools are those pools with desirable characteristics that can sell for a premium in the mortgage bond market. The remaining universe that trades cheaply is often delivered to TBA contracts. Recursion defines the Spec pool universe according to industry standards. Under this framework, the share of Spec pools out of all pools has been quite consistent historically at just below 1/3 of issuance, but the share has modestly increased since the social scores were first disclosed last November, reaching a record 43% in February 2023: And the distribution of the two types of pools by social score ranges over time looks quite different: The difference is quite stark. In general, the spec pools have a distinctly greater share of high social score pools than TBA pools, which is generally expected. Now we want to ask what the implications of this are in terms of pool performance. First, we look at prepayments: Interestingly, prepayments for spec pools with scores greater than 0.5 are substantially lower than those for TBA. For the lowest social score bucket, 0.25-0.50, the difference between Spec pools and TBA pools are much smaller. Finally, we look at delinquencies: Here, the pattern is more nuanced with higher DQs for TBA pools in the high range of social scores but otherwise lower. There is much more to do here, but the evidence so far is that the release of this data is correlated with a decline in the relative issuance of TBA vs. spec pools. Whether this is due to the superior prepayment performance of spec pools or the growing influence of ESG investors remains to be seen. But as TBA is the benchmark MBS product, there is an important question to be addressed about the impact of ESG on the liquidity of this market. [1] See https://capitalmarkets.fanniemae.com/single-family-social-index under “Methodology”.
[2] There are modest differences in Social Density Scores distribution across the two GSEs. |
Archives
July 2024
Tags
All
|
RECURSION |
|
Copyright © 2022 Recursion, Co. All rights reserved.

 RSS Feed
