• HOME
  • solutions
    • RECURSION ANALYZERS
    • Mortgage Company Data
    • Recursion DataCloud
    • Customized Solutions
  • BLOG
  • CLIENT LOGIN
    • Recursion Analyzers
  • ABOUT US
    • OVERVIEW
    • OUR TEAM
    • News & Events >
      • Recursion In News
      • Recursion Data Citations
  • CONTACT
RECURSION CO
  • HOME
  • solutions
    • RECURSION ANALYZERS
    • Mortgage Company Data
    • Recursion DataCloud
    • Customized Solutions
  • BLOG
  • CLIENT LOGIN
    • Recursion Analyzers
  • ABOUT US
    • OVERVIEW
    • OUR TEAM
    • News & Events >
      • Recursion In News
      • Recursion Data Citations
  • CONTACT
BLOG

The LMBI Flag

3/3/2023

 
On February 9, Ginnie Mae announced a new Low-Moderate Income Borrower (LMBI) disclosure[1] “in response to investor interest in having greater transparency into Ginnie Mae mortgages in pools, in particular as part of meeting Environmental, Social, and Governance (ESG) investment mandates”.

“The new disclosures capture the number of underlying loans made to LMI borrowers, the percentage of LMI loan count of total loan count, the unpaid principal balance (UPB) of LMI loans in the mortgage-backed security (MBS), and the percentage of LMI UPB of total MBS UPB.”

“LMI households are classified according to the Federal Financial Institutions Examination Council (FFIEC) Median Family Income Report Tables[2]​​ corresponding with the time of loan origination. These disclosures are being provided at the aggregate pool level for Federal Housing Administration (FHA) and U.S. Department of Veterans Affairs (VA) loans originated beginning in 2012.”

In other words, grist for the Recursion mill. First, we look at the share of Ginnie vintage 2012 and later pools that consist of loans for which more than 50% are LMBI borrowers:
Picture
RUN UNDERLYING QUERY
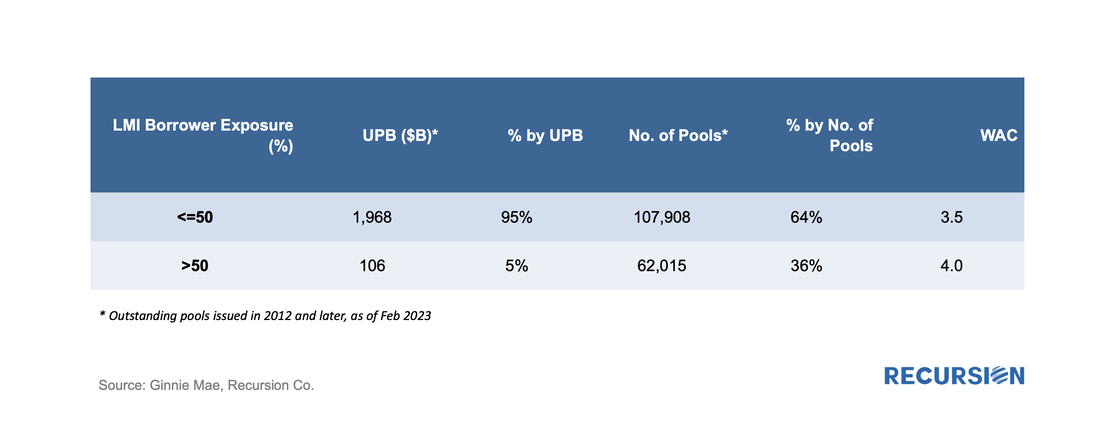
Loans to LMBI borrowers consist of just 5% of loans by UPB, but 36% of pools have a majority of loans in this category. The WAC for these pools is higher at 4.0% than 3.5% for pools where lower-income borrowers make up less than half of the UPB of loans.
Picture
RUN UNDERLYING QUERY
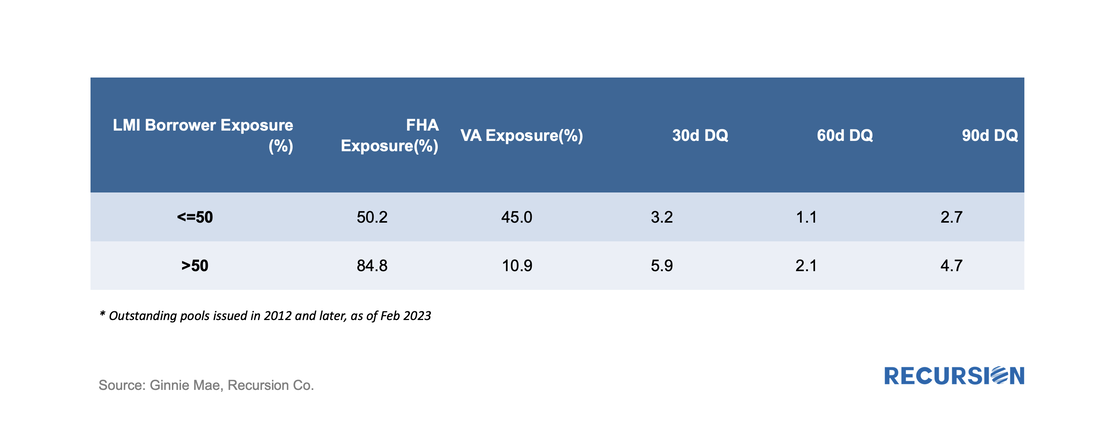
​Pools with a majority of loans made to LMBI borrowers consist of 85% FHA borrowers and 11% VA loans. The performance of these pools tends to be worse than pools where LMBI borrowers make up less than half the loans.
 
In order to benchmark this data, we set out to compare it to a similar calculation based on HMDA data. There are some subtle points to be dealt with in performing this calculation. First, HMDA data are originations data, while the pool data are based on deliveries, which happen with a lag. We can adjust for this to some extent because we have the originations year for loans in the pool data. For HMDA, our calculation states that a loan is taken out by an LMBI borrower in a GNM program if their median income as a share of tract median income is less than 80%.
Picture
RUN UNDERLYING QUERY 1
RUN UNDERLYING QUERY 2
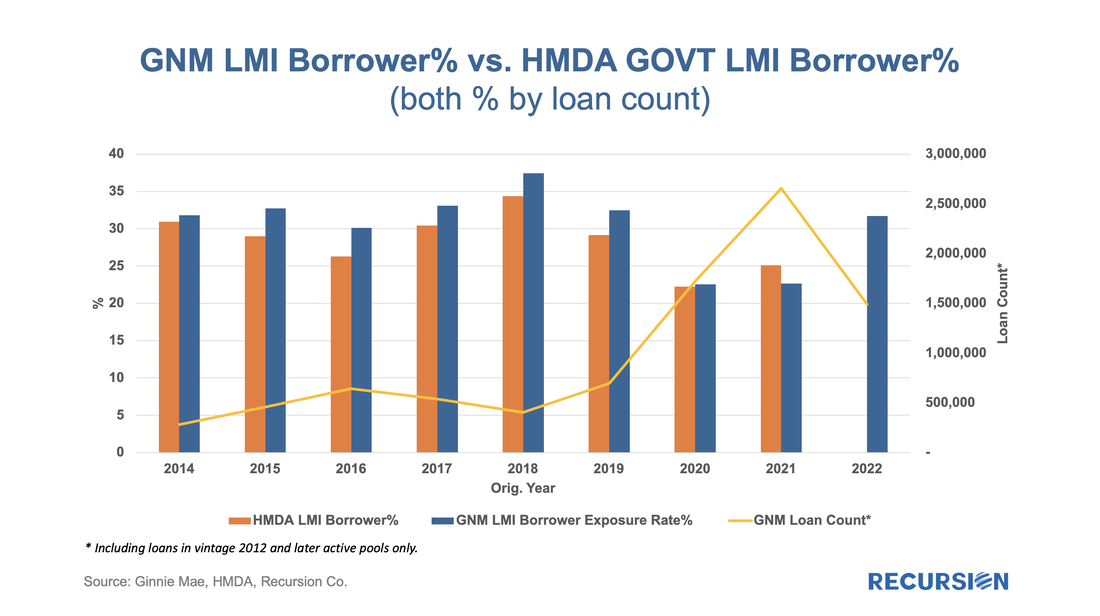
​A fairly remarkable correlation. It will be very interesting to see what the HMDA figure for 2022 is when the data is released in the coming months.
​
A question that arises immediately is what drives the pattern of smaller shares in 2020 and 2021. We overlay the bars with a line tracking the number of GNM loans. There is a suggestive negative correlation, indicating that periods of booming mortgage growth tend to be led by higher-income households. But this is hardly conclusive, and a great more work stands to be done to explain these patterns. Another possibility is that % of LMI/LMBI is much higher for purchase loans and 2020/2021 volumes are driven by refi waves.

[1]https://www.ginniemae.gov/newsroom/Pages/PressReleaseDispPage.aspx?ParamID=272
[2] https://www.ffiec.gov/Medianincome.htm

    Archives

    March 2023
    February 2023
    January 2023
    December 2022
    November 2022
    October 2022
    September 2022
    August 2022
    July 2022
    June 2022
    May 2022
    April 2022
    March 2022
    February 2022
    January 2022
    December 2021
    November 2021
    October 2021
    September 2021
    August 2021
    July 2021
    June 2021
    May 2021
    April 2021
    March 2021
    February 2021
    January 2021
    December 2020
    November 2020
    October 2020
    September 2020
    August 2020
    July 2020
    June 2020
    May 2020
    April 2020
    March 2020
    February 2020
    May 2019
    March 2019
    February 2019

    Tags

    All
    Affordability
    ARM
    Bank\Nonbank
    Borrower Assistant Plan
    Cash Window
    Climate Change
    CMBS
    CMO
    Conforming Loan
    Conventional Loan
    COVID 19
    CPR\CDR\CRR\CCR
    Credit Score\DTI\LTV
    CRT\CAS\STACR
    Delinquency
    Early Buyout
    Early Payment Default
    ESG
    ET Pools
    Fannie Mae
    Fed
    FHA
    FHFA
    Forbearance
    Foreclosure
    Foreign Investor
    Freddie Mac
    Ginnie Mae
    Green Loans
    HECM
    HELOC
    HMDA
    HUD
    LMI
    Manufactured Housing
    Modified Loans
    MSR
    Multifamily
    Occupancy Type\NOO
    Partial Claim
    Payoff
    PIW
    Prepayment
    Purchase Loans
    Recursion In News
    Refi Loans
    Reperforming
    RG Pools
    Rural Housing
    Single Family
    Special Eligibility Program
    TBA Market
    TIC
    TPO
    UMBS
    US Treasury
    VA

RECURSION

SOLUTIONS ​
Recursion Analyzers
​
Mortgage Company Data
Recursion DataCloud
Customized Solutions


ABOUT US  ​
Overview
​Our team
CLIENT LOGIN   ​
Recursion Analyzers

CONTACT

224 West 30th St., Suite 303, New York, NY 10001
Contact Us

Picture
Copyright © 2022 Recursion, Co. All rights reserved.​
  • HOME
  • solutions
    • RECURSION ANALYZERS
    • Mortgage Company Data
    • Recursion DataCloud
    • Customized Solutions
  • BLOG
  • CLIENT LOGIN
    • Recursion Analyzers
  • ABOUT US
    • OVERVIEW
    • OUR TEAM
    • News & Events >
      • Recursion In News
      • Recursion Data Citations
  • CONTACT