• HOME
  • solutions
    • RECURSION ANALYZERS
    • Mortgage Company Data
    • Recursion DataCloud
    • Customized Solutions
  • BLOG
  • CLIENT LOGIN
    • Recursion Analyzers
  • ABOUT US
    • OVERVIEW
    • OUR TEAM
    • News & Events >
      • Recursion In News
      • Recursion Data Citations
  • CONTACT
RECURSION CO
  • HOME
  • solutions
    • RECURSION ANALYZERS
    • Mortgage Company Data
    • Recursion DataCloud
    • Customized Solutions
  • BLOG
  • CLIENT LOGIN
    • Recursion Analyzers
  • ABOUT US
    • OVERVIEW
    • OUR TEAM
    • News & Events >
      • Recursion In News
      • Recursion Data Citations
  • CONTACT
BLOG

The Occupancy Type Flag – I

5/12/2021

 
With house prices soaring to new highs on the back of pandemic-related household relocations and sub 3% mortgage rates, the natural question is how far these trends can continue. While we have no crystal ball for calling market tops and bottoms, we feel we can gain some insight into market dynamics by looking into the composition of demand.
​
The GSE’s provide us with the ability to peer into this composition through the “Occupancy Type” flag, which consists of three types: owner-occupied, second homes and investor properties. Here we look at the share of all purchase mortgages from the last two types:
Picture
Run Underlying Query
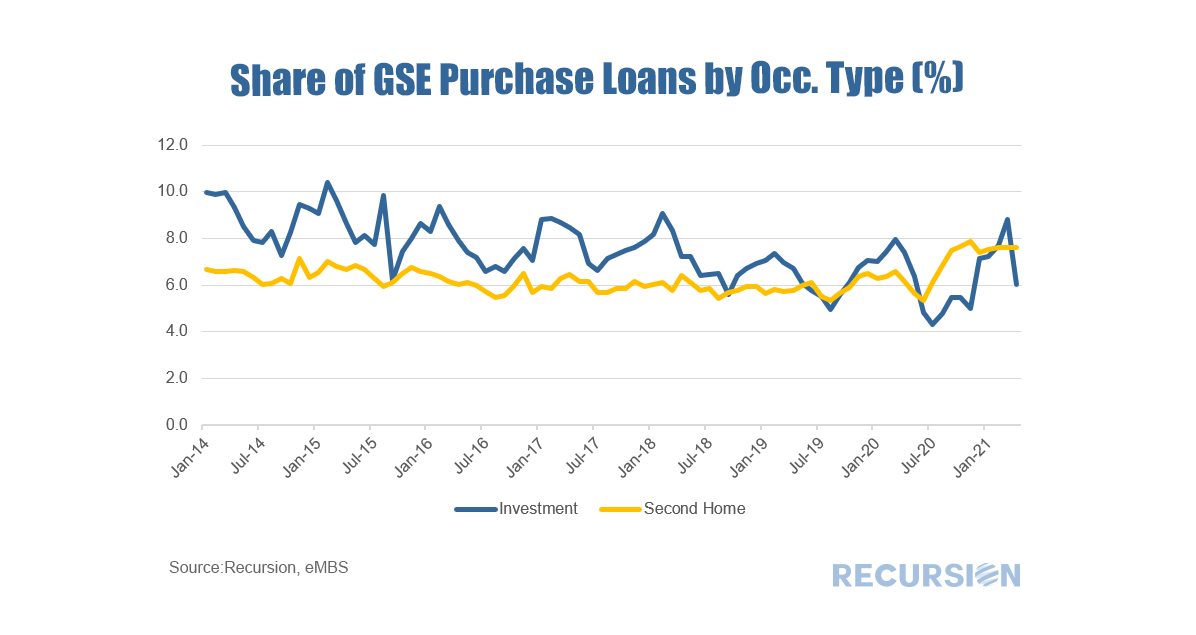
A couple of points jump out right away. First, from 2014-2019 the second home share of delivered purchase loans to the GSE’s was pretty steady around 6% of the total market. The share of investor loans in contrast was in trend decline from near 10% to about half that in 2019. This is in line with the trend increase in house prices over that time. Investor shares are seasonal, essentially peaking during the winter months when the owner-occupied market is quietest.

Of course, things changed in 2020 and the onset of the Covid-19 Pandemic.
​
Below find the same chart 2019-April 2021 with an overlay of the Yr/Yr change in the purchase-only FHFA house price index:
Picture
Run Underlying Query
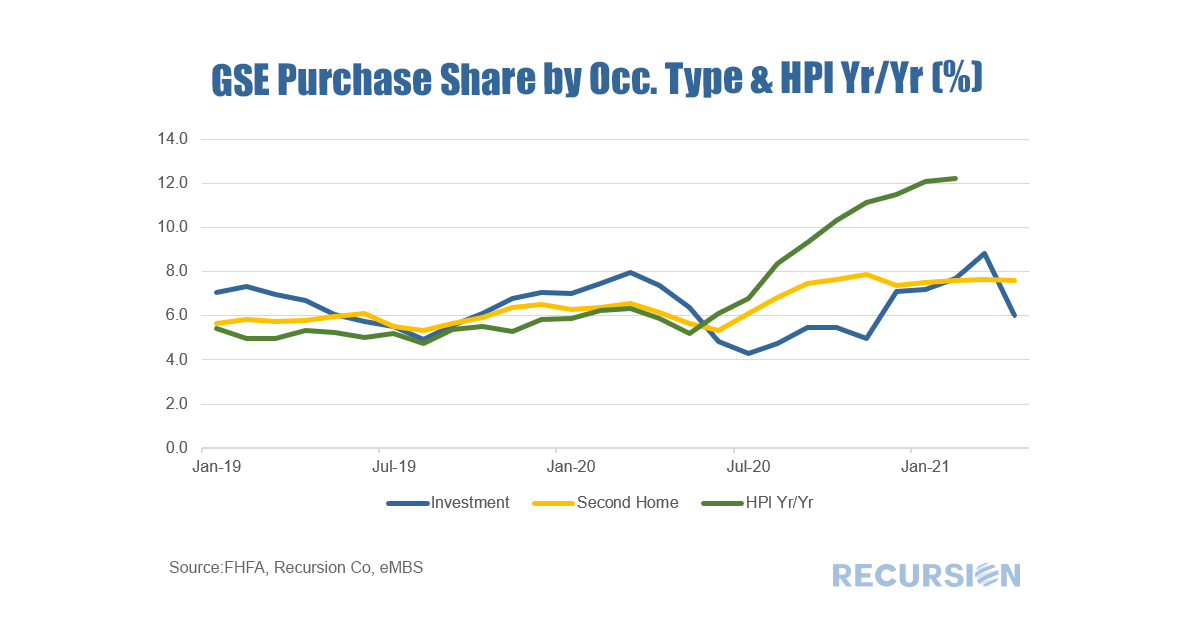
The dynamics here are quite interesting. After a long run of a 6% market share, second homes jumped to an 8% share and held steady, boosted by low rates and a desire among wealthy urban households to have a spare place to go with more room.

The activity of investors is particularly eye-catching. The long-turn downtrend took the investor share of the market to a seven-year low near 4.3% in July 2020 (recall that this data is deliveries, so the home sales behind these occurred largely in May-June that year). Boosted by low rates and a keen sense of market trends, this share more than doubled to 8.8% in March this year. Interestingly, in April the share dropped by 2.8% to 6.0%, the second-biggest monthly decline since 2014 (the share fell by 3.6% in September 2015 to 6.2%). Whether this is the normal seasonal pattern or a new trend developing whereby the smart money is taking profits, remains an open question.

The next post will look at the policy implications of these trends.

    Archives

    March 2023
    February 2023
    January 2023
    December 2022
    November 2022
    October 2022
    September 2022
    August 2022
    July 2022
    June 2022
    May 2022
    April 2022
    March 2022
    February 2022
    January 2022
    December 2021
    November 2021
    October 2021
    September 2021
    August 2021
    July 2021
    June 2021
    May 2021
    April 2021
    March 2021
    February 2021
    January 2021
    December 2020
    November 2020
    October 2020
    September 2020
    August 2020
    July 2020
    June 2020
    May 2020
    April 2020
    March 2020
    February 2020
    May 2019
    March 2019
    February 2019

    Tags

    All
    Affordability
    ARM
    Bank\Nonbank
    Borrower Assistant Plan
    Cash Window
    Climate Change
    CMBS
    CMO
    Conforming Loan
    Conventional Loan
    COVID 19
    CPR\CDR\CRR\CCR
    Credit Score\DTI\LTV
    CRT\CAS\STACR
    Delinquency
    Early Buyout
    Early Payment Default
    ESG
    ET Pools
    Fannie Mae
    Fed
    FHA
    FHFA
    Forbearance
    Foreclosure
    Foreign Investor
    Freddie Mac
    Ginnie Mae
    Green Loans
    HECM
    HELOC
    HMDA
    HUD
    LMI
    Manufactured Housing
    Modified Loans
    MSR
    Multifamily
    Occupancy Type\NOO
    Partial Claim
    Payoff
    PIW
    Prepayment
    Purchase Loans
    Recursion In News
    Refi Loans
    Reperforming
    RG Pools
    Rural Housing
    Single Family
    Special Eligibility Program
    TBA Market
    TIC
    TPO
    UMBS
    US Treasury
    VA

RECURSION

SOLUTIONS ​
Recursion Analyzers
​
Mortgage Company Data
Recursion DataCloud
Customized Solutions


ABOUT US  ​
Overview
​Our team
CLIENT LOGIN   ​
Recursion Analyzers

CONTACT

224 West 30th St., Suite 303, New York, NY 10001
Contact Us

Picture
Copyright © 2022 Recursion, Co. All rights reserved.​
  • HOME
  • solutions
    • RECURSION ANALYZERS
    • Mortgage Company Data
    • Recursion DataCloud
    • Customized Solutions
  • BLOG
  • CLIENT LOGIN
    • Recursion Analyzers
  • ABOUT US
    • OVERVIEW
    • OUR TEAM
    • News & Events >
      • Recursion In News
      • Recursion Data Citations
  • CONTACT