|
Recently, researchers at the Federal Reserve published a blog about trends in first time home buyers (FTHB)[1]. They utilize a dataset that is a 5% sample of credit files from a credit bureau. It appears from their analysis that there was a bit fewer than 5 million loans originated in 2020, so it would seem they are using a sample of around 250,000 loans. It is natural to ask how their measure of first-time home ownership compares with our calculation using Agency loan level delivery data consisting of over 4 million loans for that year. To start, we can look at the trend of purchase mortgage delivery for the past seven years: 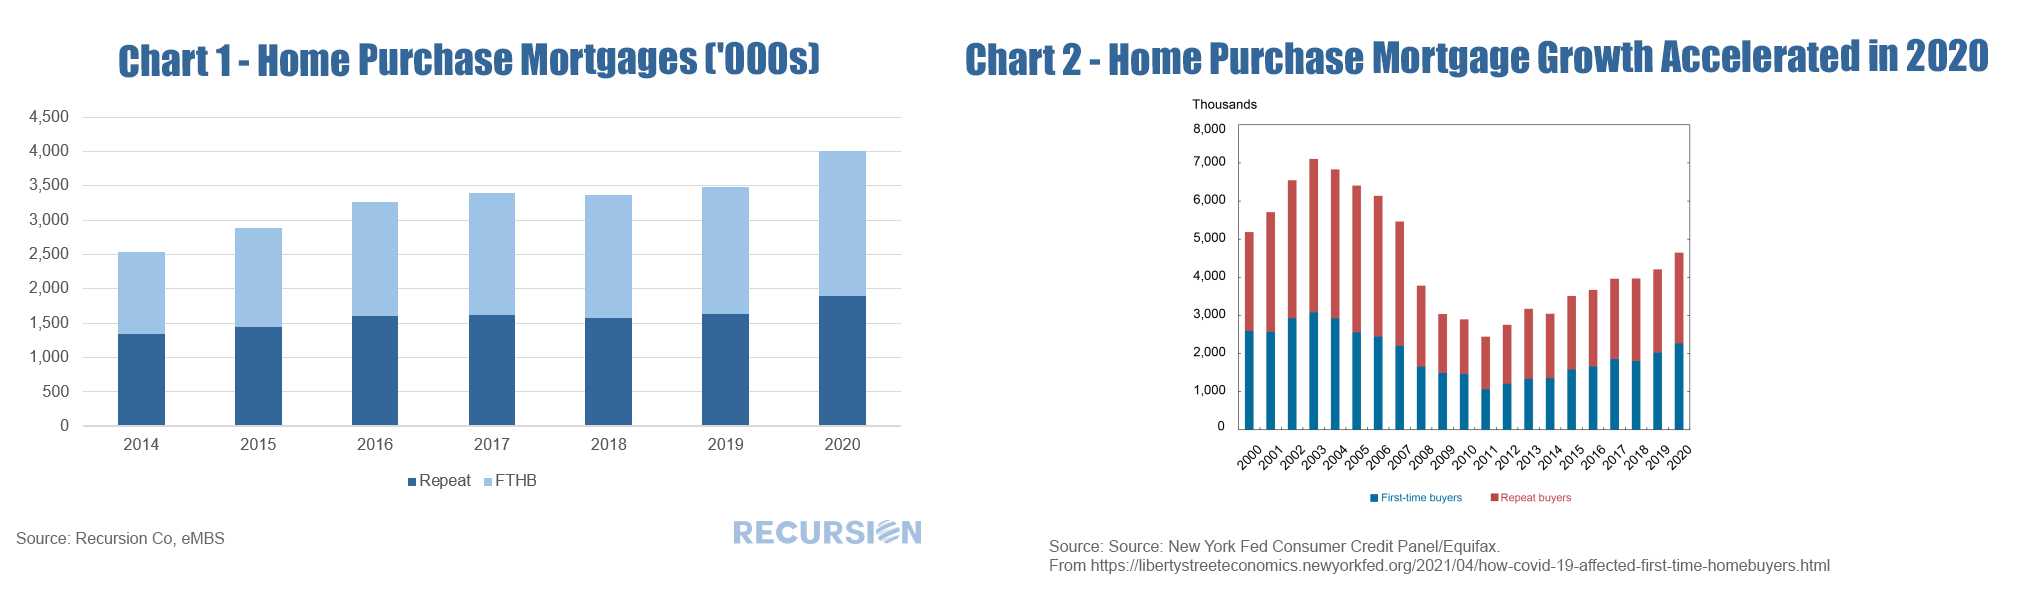 And second, we can compare estimates of first-time homeownership: 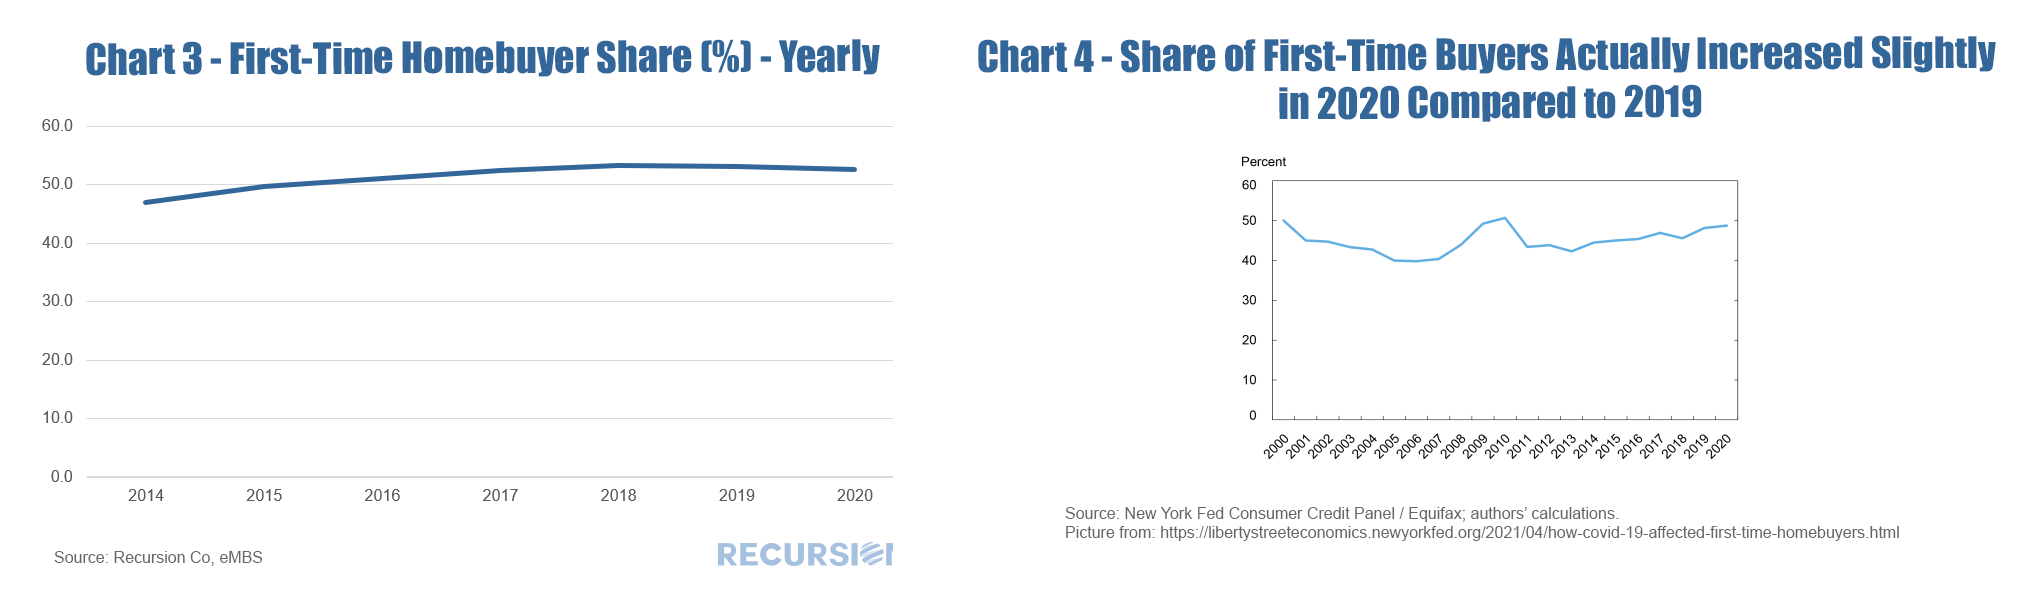 There are several distinctions to be made between the two data sets that are worth pointing out. First, the loan level delivery data only goes back through 2014 on an annual basis. Second, the Agency delivery data does not include loans originated but held on investor balance sheets, including any non-QM loans. A third difference is that the Fed researchers consider FTHB to be the first-ever mortgage file for a household while the Agencies consider a household to be “first-time” if they have not owned a house in more than three years. The number of loans delivered to the Agencies in 2020 increased by considerably more (15.1%) in Chart 1 than that from the credit bureau (10.5%) in Chart 2, which does not reflect a difference in the growth in the total number of loans originated, but rather an increase in the share of originated loans delivered to the Agencies. During Covid, investors preferred to hold mortgages with insured credit risk. This can be seen in the sharp decline seen in the “not sold” category from the recent 2020 release of HMDA data. 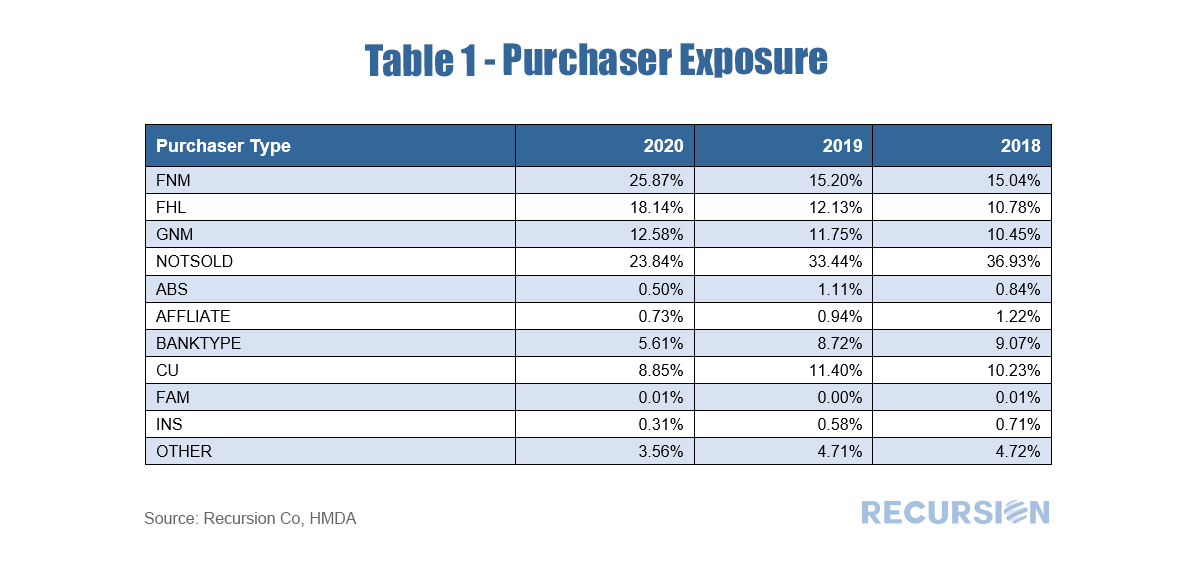 The share of FTHB in our data is slightly higher than in the Fed report, which may be due to a low FTHB share in segments such as Jumbos and non-QM loans not included in our datasets. But a key difference is that our FTHB share declined slightly in 2020 from the prior year (52.5% from 53.1%) while it rose slightly in the Credit Bureau data (48.8% from 48.2%). A rigorous attribution of the difference is beyond the scope of this note, but a few comments based on the composition of our delivery data can be made. First, in our data, the decline in the first-time homebuyer share can be attributed to a rise in the market share of conforming loans with lower FTHB shares at the expense of GNM loans with higher FTHB shares[2]. Second, our data comes in monthly so we can look a bit at the dynamics within the year: 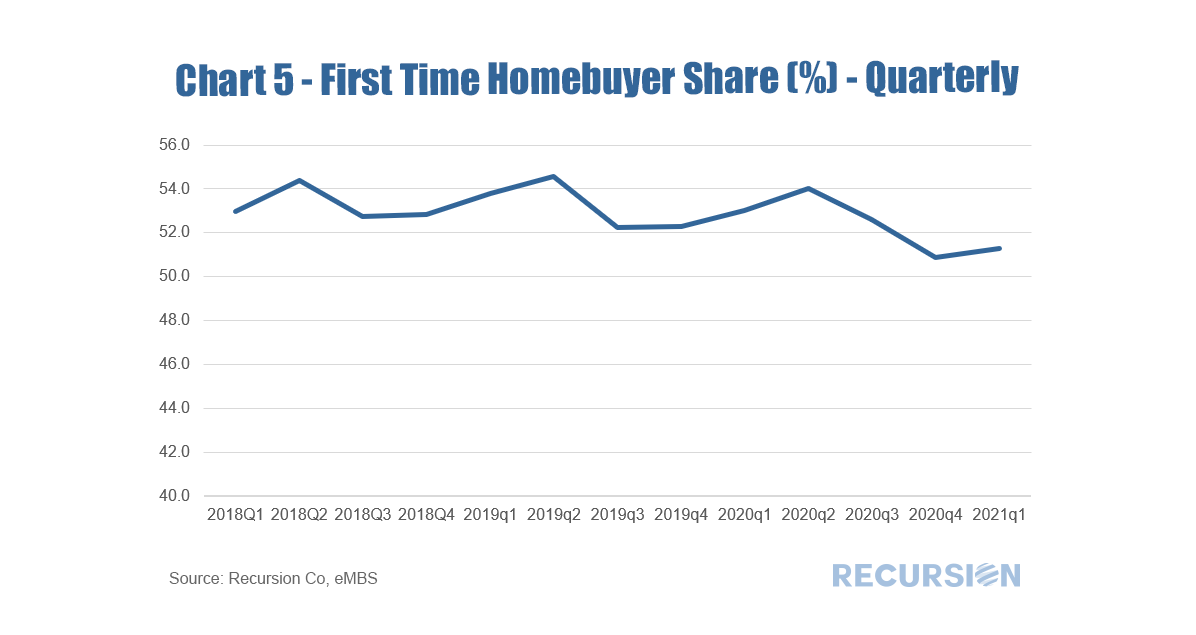 Interestingly, we show the FTHB share picked up in a normal seasonal pattern in 2020 Q2 and Q3, when the pandemic hit with full force. However, in Q4 the share declined to pre-pandemic levels, and rebounded only slightly in the first half of this year. It will be very interesting to monitor these trends going forward. The economic news in March got off on a strong note with the release of payroll employment data showing a hike of 916,000, a seven-month high. This coincided with the first anniversary of the onset of the Covid-19 Pandemic. The Cares Act forbearance program was launched at the end of March 2020 and was originally designed to last for one year. More recently, the program was extended for six months, but borrowers need to recertify their status as economically impacted by Covid every three months from the 1-year anniversary data[1]. So naturally the end of March was a time in which many borrowers had to recertify. This was a natural time for households to reassess their financial positions, setting the stage for the possibility that they could begin repaying their mortgage obligations. In fact, they did, and we saw a sizable drop in the number of loans in Covid-related forbearance[2] in April, particularly for Ginnie Mae programs: 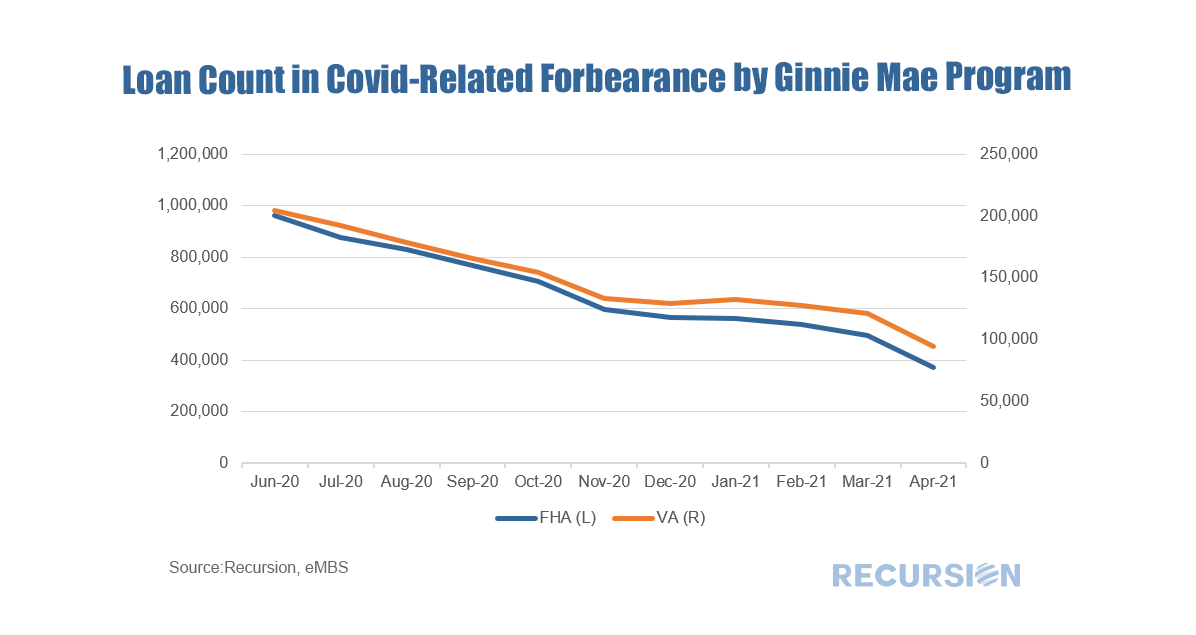 The economic fundamental driving this decline is the improvement in the labor market, and a distinct correlation can be seen between declining forbearances and unemployment: 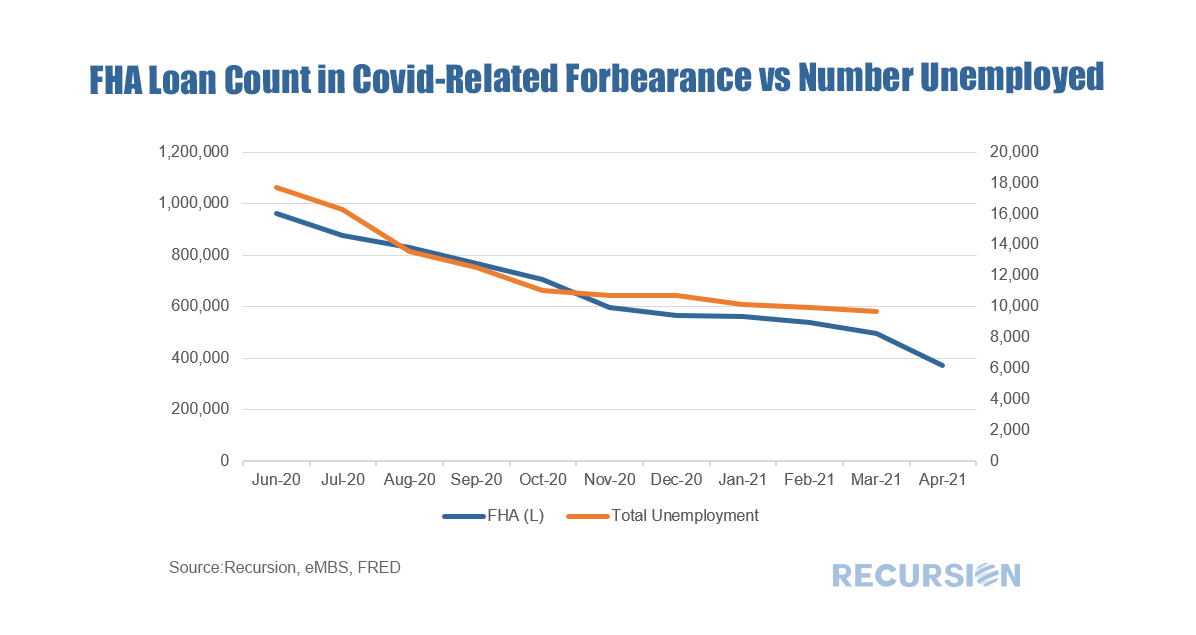 A bit more analysis is in order here. The forbearance data come from loans in agency pools, so there is always the possibility that the number of loans in forbearance decreases because some of those loans were bought out of pools by servicers. To check this, we looked at the disposition of loans in forbearance at the beginning of March that remained in pools at the beginning of April but were not in forbearance. For FHA programs the number was 111,153 loans compared to the one-month decline in the number of loans in forbearance of 125,202. For VA the similar statistic is 27,247 compared with a 26,810 decline in the number of loans in forbearance. It seems clear that improving labor market fundamentals are the primary driver of the decline in the number of loans in forbearance in these programs. To test the idea that the 12-month renewal period played an important role in this process, below we look at the loan age of those mortgages that left forbearance but stayed in pools in April. For FHA programs, the number with loan age of one month was 79,212 or 71% of the total, while for VA it was 17,863 or 66%. The next important date will be June before the program is scheduled to end at the end of September. 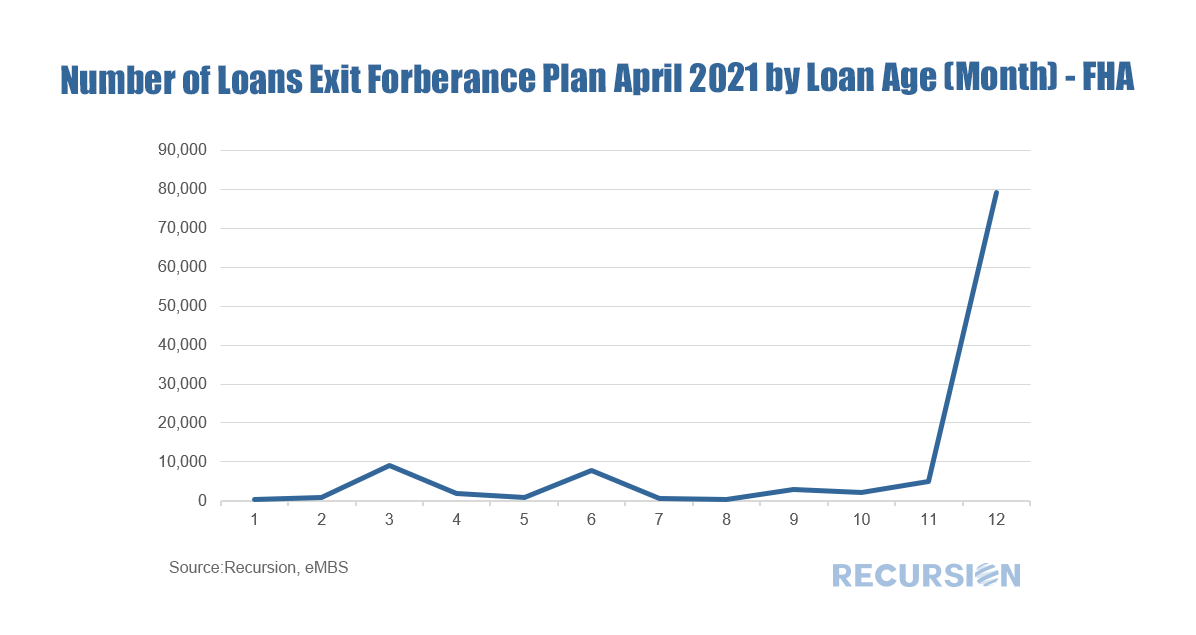 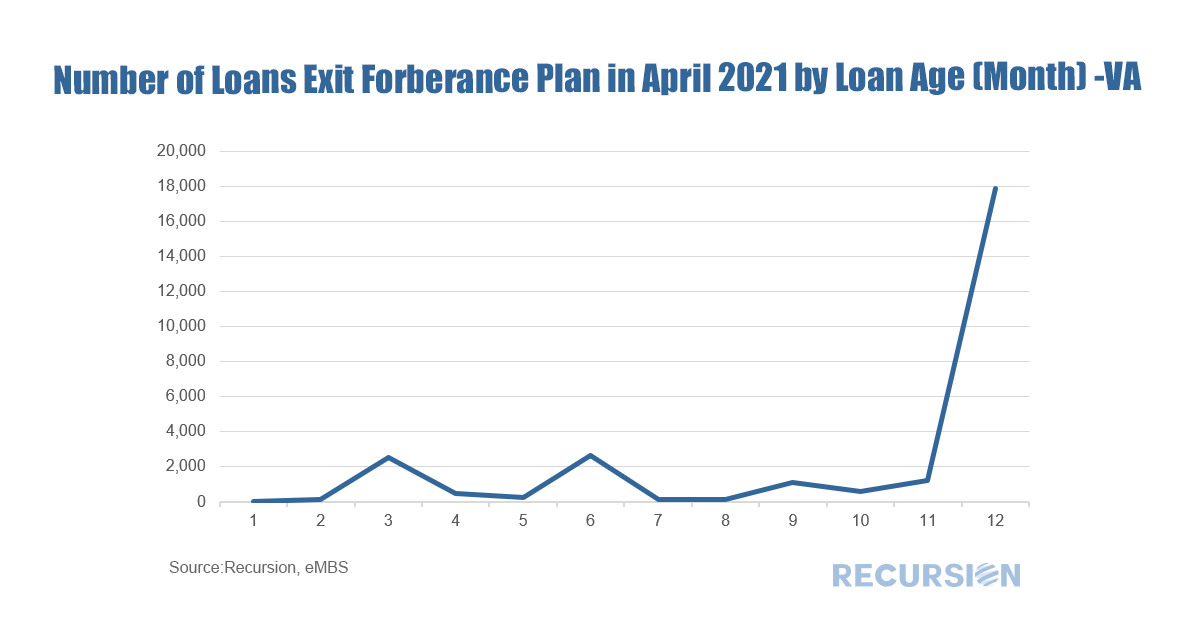 As can be seen from the above table, the vast majority of the number of loans that were recorded as in forbearance in March but not in April did not exit due to buyouts. The data do not precisely add up because other outcomes are possible, including FHA – conventional refis or sales of homes, for which we have no tracking mechanism. But the close match between cures and the declines in forbearance across programs is evidence that the main impetus is improving fundamentals. [1] https://www.consumerfinance.gov/coronavirus/mortgage-and-housing-assistance/help-for-homeowners/extend-forbearance/
[2] In this blog, we only analyze Covid-related forbearance On March 30, FHA released its Quarterly Report to Congress on FHA Single-Family Mutual Mortgage Insurance Fund Programs for Q4 2020[1]. The report shows that the MMI fund grew to $82.3 billion from $79.9 billion the prior quarter. However, the year-to-date actual net loss rate on claim activity of 35.2% is higher than the projection of 30.1% percent, as the portfolio-level serious delinquency rate increased in the quarter to 11.9%, from 11.6% percent last quarter. Consequently, Secretary Fudge in a statement indicated stated that “Given the current FHA delinquency crisis and our duty to manage risks and the overall health of the fund, we have no near-term plans to change FHA’s mortgage insurance premium pricing.”[2] As we have noted previously, the Covid-19 crisis is very distinct from the Global Financial Crisis (GFC) insofar as while both periods experienced high delinquency rates, house prices now are soaring as opposed to collapsing in the earlier crisis. 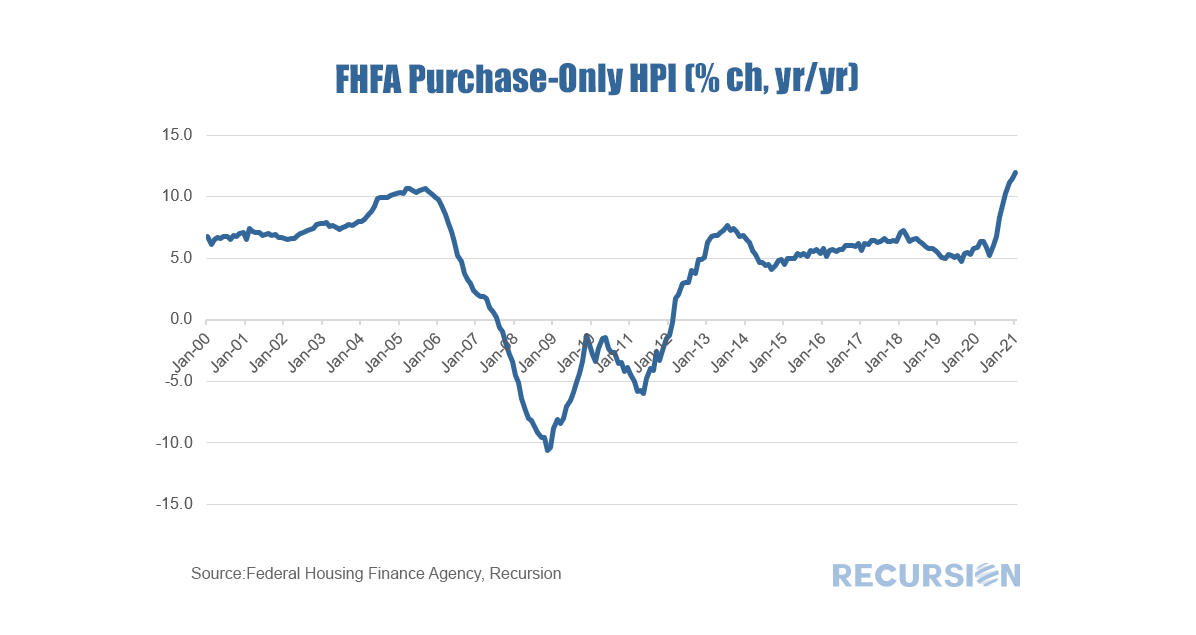 We have commented previously about housing and the “K-shaped Recovery”[1] in which home prices are booming but rent increases are decelerating. This dichotomy is highly unusual but reflects the flight of households out of dense urban environments due to the Covid-19 pandemic. With rents decelerating, it is not surprising that starts of new multifamily units have been in a trend decline over the past year. 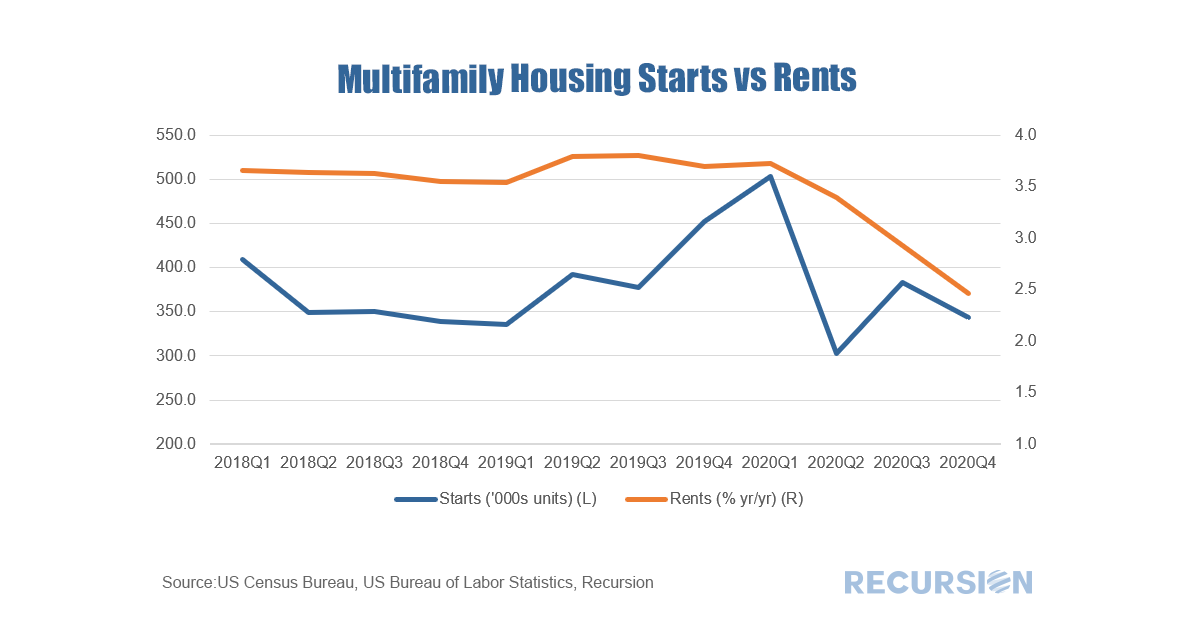 On Tuesday February 23, FHFA released its monthly purchase-only HPI for December, showing a 1.1% rise from the prior month, and a striking 11.1% increase from December 2019, the record-high annual growth rate reported since this data was first released in the early 1990s. 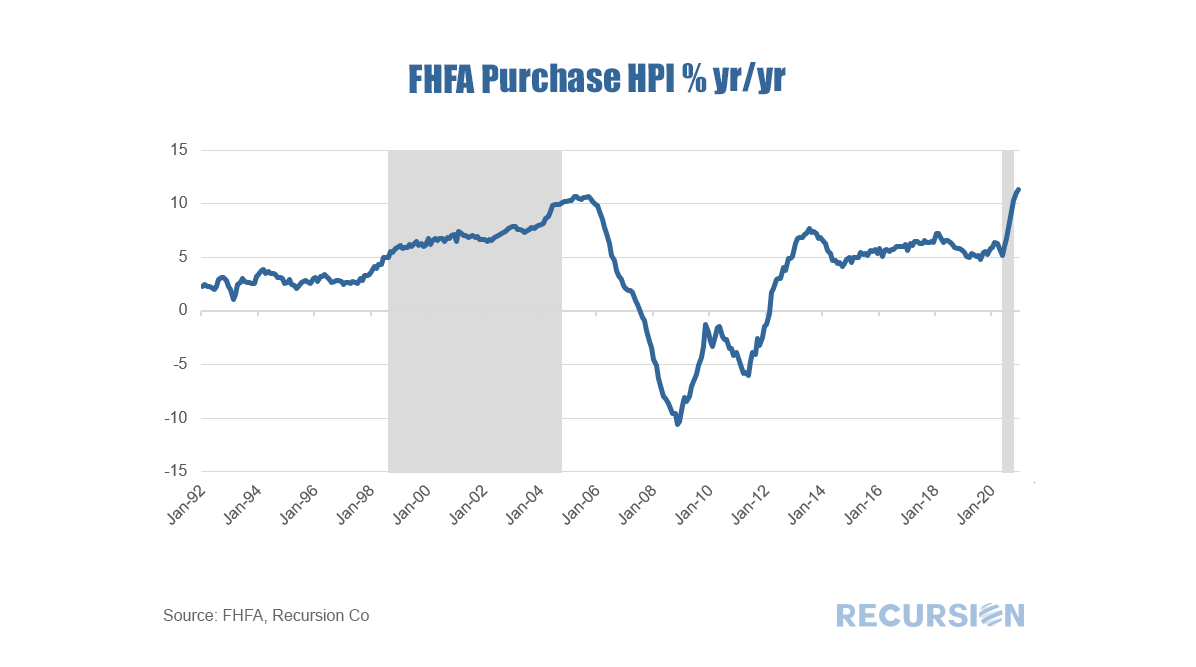 Assigning letters to economic recoveries (“V”, “L”, “U” etc.) has become a standard part of the economist’s toolkit for expressing a view on the nature of a particular forecast. The Covid-19 crisis has added a new letter to the lexicon, “K”. In a “K-shaped” recovery, some segment of the population experiences relatively strong growth, while others are left behind. Since housing tenure is an essential determinant of the distribution of household wealth, it is not surprising that we can clearly see this shape in the relative trends in house prices versus rents: 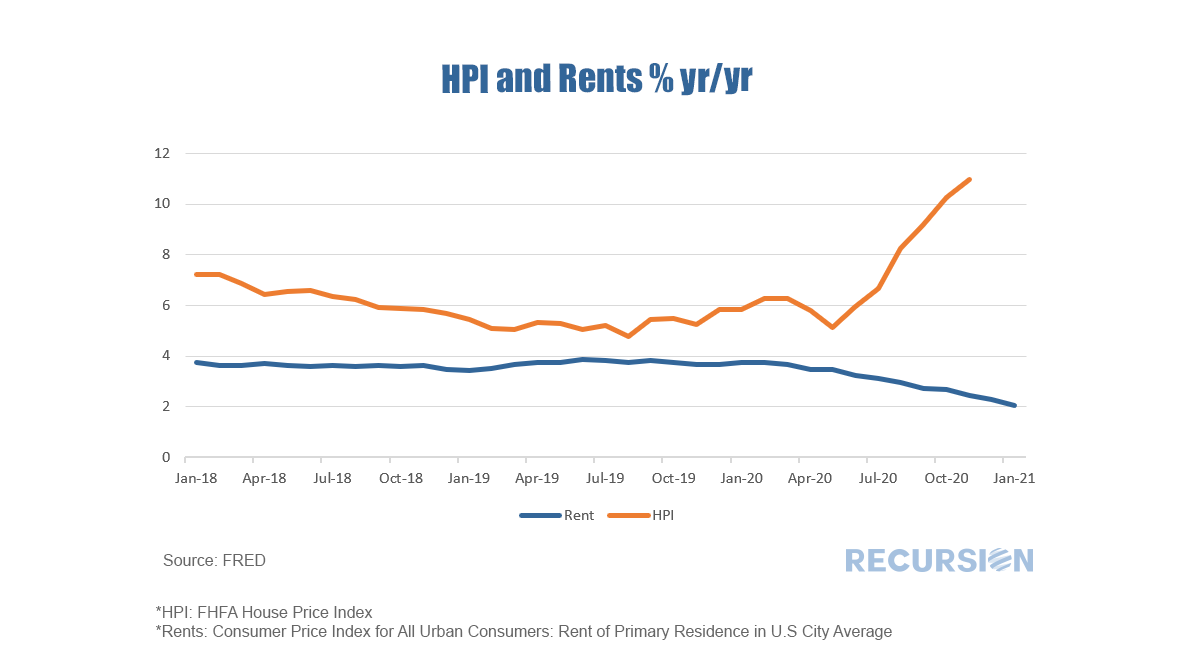 Data released last evening showed that total delinquencies for loans in Fannie Mae pools were unchanged in February at 3.6% in February, the first month that the rate did not decline since the Covid-19 Pandemic struck last spring. Notably, the same rate for Freddie Mac pools declined by 0.2% to 2.9%, the low reached since April 2020. 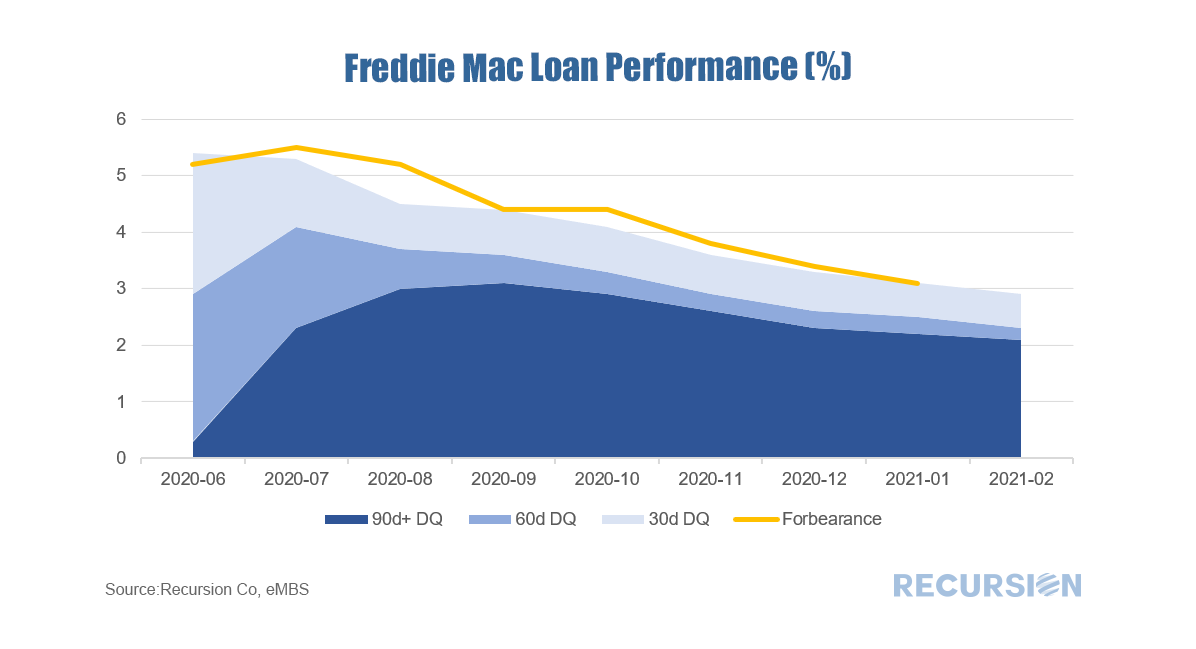 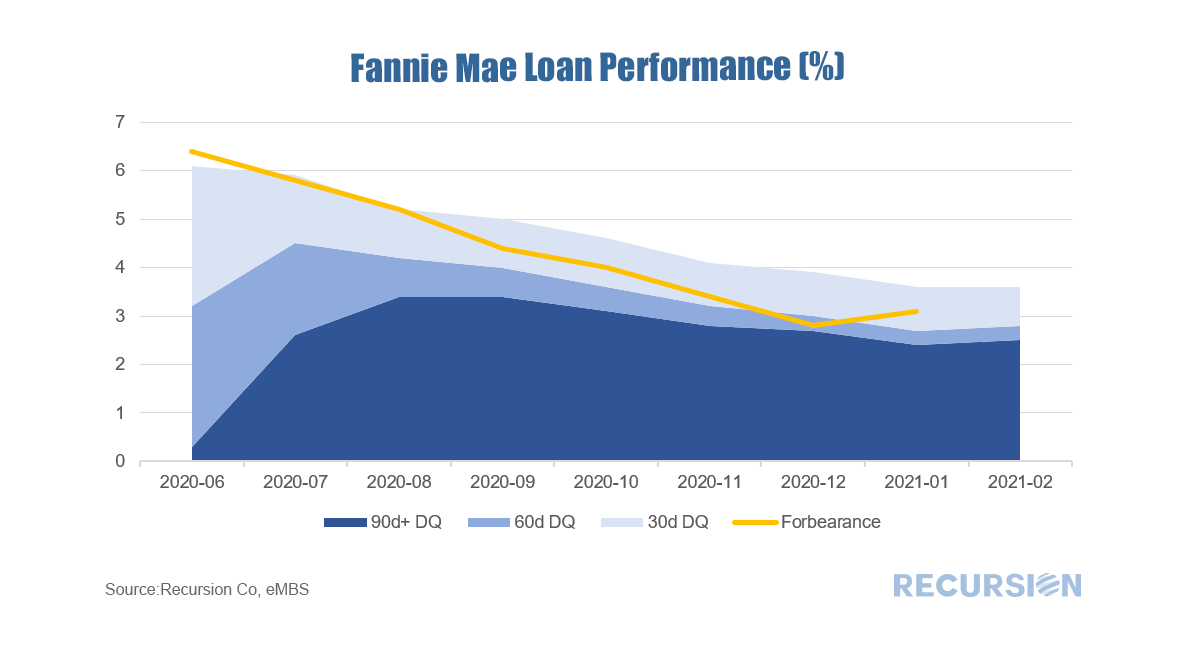 In prior posts, we commented on trends in the distribution of risk in the mortgage markets of single-family residential[1] and multifamily markets[2] from the Federal Reserve Z.1 data. This note takes a look at the commercial mortgage market[3] in a similar fashion. Other than the multi-family category, commercial mortgage for properties such as office, retail, hospitality etc is not normally in our wheelhouse at Recursion, but insofar as it is a substitute as an investment vehicle for the residential markets it is useful to take a look at trends here. Commercial mortgages (excluding multifamily) are exposed to unique risk due to COVID-19, as it is very likely offices, hotels and shopping malls will never to able to achieve the same occupancy rate as before the pandemic. 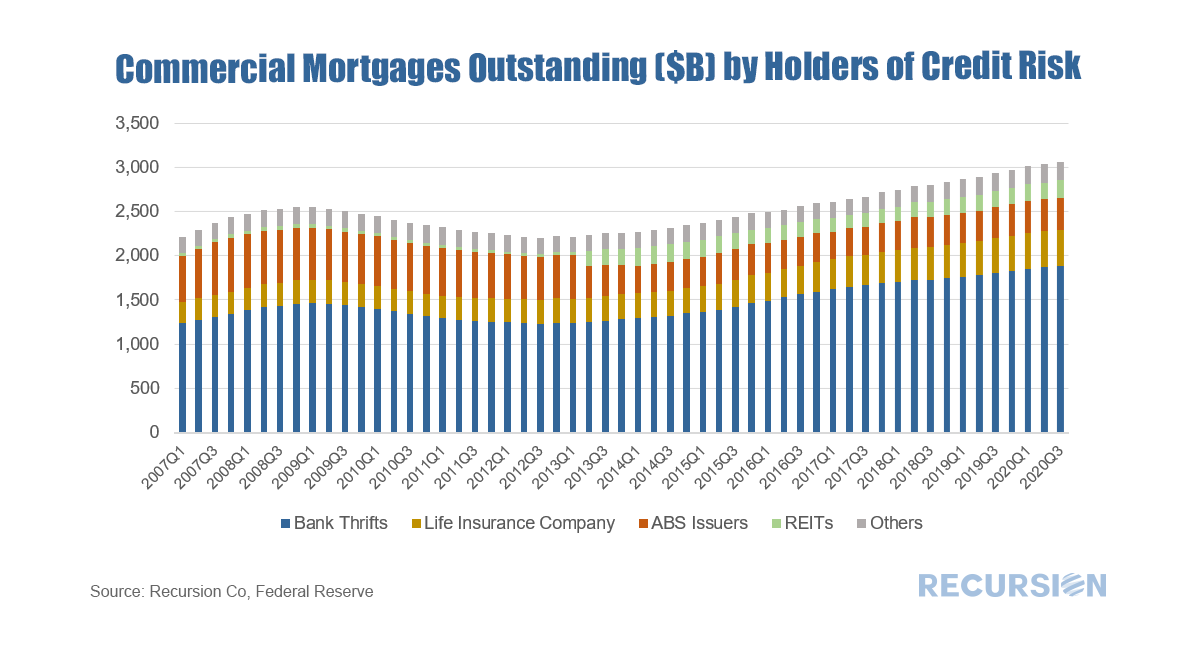 The commercial mortgages(excluding multifamily) outstanding crossed the $3 trillion threshold in Q1 2020. Of interest is that the dominant holder of this risk is banks and thrifts. Their share has been in a narrow 1% range between 61.4% and 62.5% over the past four years[4]. This observation leads naturally to the question of bank holdings across the residential and commercial categories: 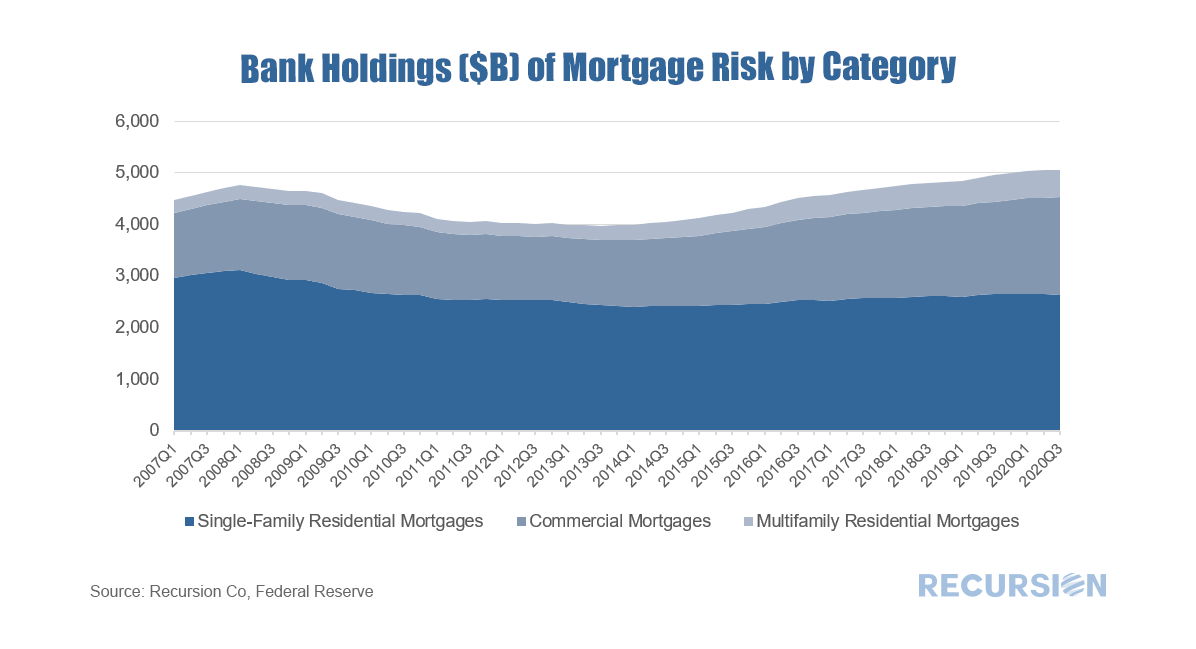 What is interesting is the steady drop in the share of single-family mortgages held on bank balance sheets over the past dozen years by about 1% per year (currently 52.1%). [5]The impact of Covid-19 on this trend appears to be quite small. Both multifamily and commercial mortgages have gained shares. It’s worth noting that banks hold sizable amounts of single-family MBS in addition to loans, on the order of $2.9 trillion [6] in Q3 2020. In this case, the agencies hold the credit risk, not the banks. There is ample room for banks to boost their holdings of residential loans, one more item to watch in the transition year 2021. [1] https://www.recursionco.com/blog/that-was-then
[2] https://www.recursionco.com/blog/big-data-and-the-multifamily-market [3] Also called “nonfarm, nonresidential” in the Federal Reserve Z.1 data [4] From Q4 2016 – Q3 2020 [5] The denominator of calculation only banks’ holdings of single-family mortgages, multifamily mortgages, and commercial (non-farm, non-residential) mortgages; It does not include the “farm” sector on the Federal Reserve Z.1 data [6] According to L.211 Agency-and GSE-Backed securities outstandings from the Federal Reserve Z.1 data |
Archives
February 2024
Tags
All
|
 RSS Feed
RECURSION |
|

Copyright © 2022 Recursion, Co. All rights reserved.