• HOME
  • solutions
    • RECURSION ANALYZERS
    • Mortgage Company Data
    • Recursion DataCloud
    • Customized Solutions
  • BLOG
  • CLIENT LOGIN
    • Recursion Analyzers
  • ABOUT US
    • OVERVIEW
    • OUR TEAM
    • News & Events >
      • Recursion In News
      • Recursion Data Citations
  • CONTACT
RECURSION CO
  • HOME
  • solutions
    • RECURSION ANALYZERS
    • Mortgage Company Data
    • Recursion DataCloud
    • Customized Solutions
  • BLOG
  • CLIENT LOGIN
    • Recursion Analyzers
  • ABOUT US
    • OVERVIEW
    • OUR TEAM
    • News & Events >
      • Recursion In News
      • Recursion Data Citations
  • CONTACT
BLOG

Covid and Climate Impact on Mortgage Delinquencies

10/22/2021

 
​Received wisdom in the mortgage market holds that distress in the mortgage market eases as the labor market improves. While there is certainly some justification for this view, in fact there are many factors that drive performance so the direct correlation with the jobs market does not always hold.
Picture
Run Underlying Query
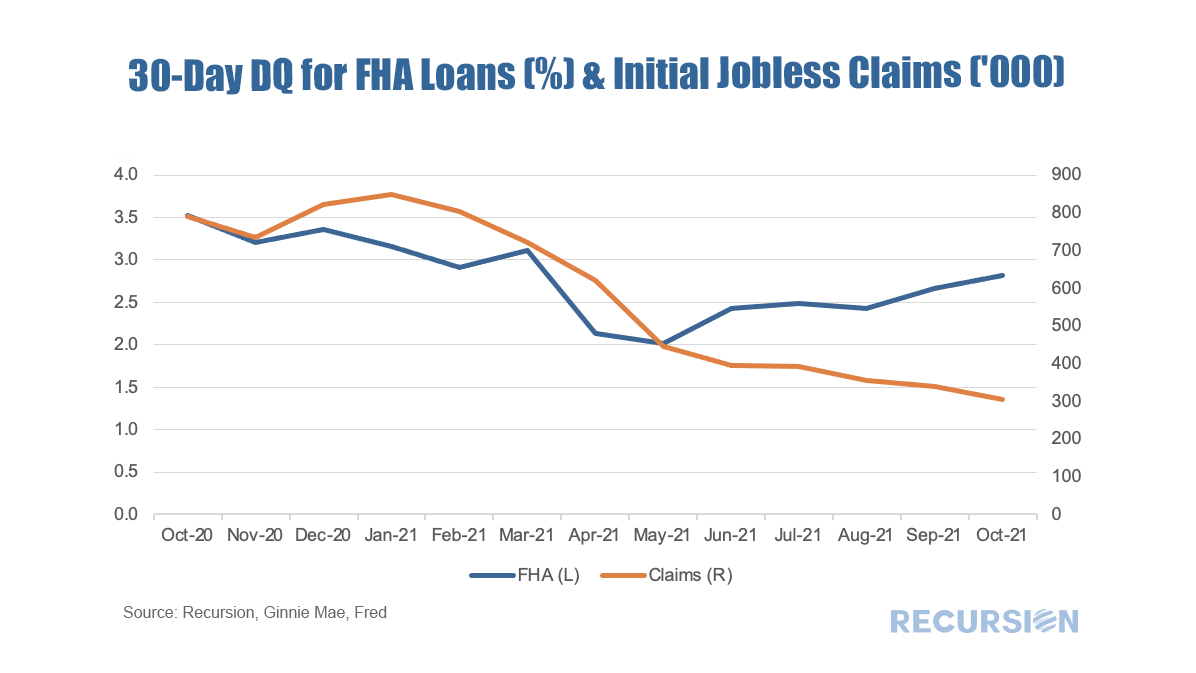
​In particular, as the labor market returns to historic norms, measured here by jobless claims, other factors may rise in importance. Looking at this chart, one factor that comes to mind is the revival in the number of Covid-19 cases after the recent trough in the second quarter.
Picture
Run Underlying Query
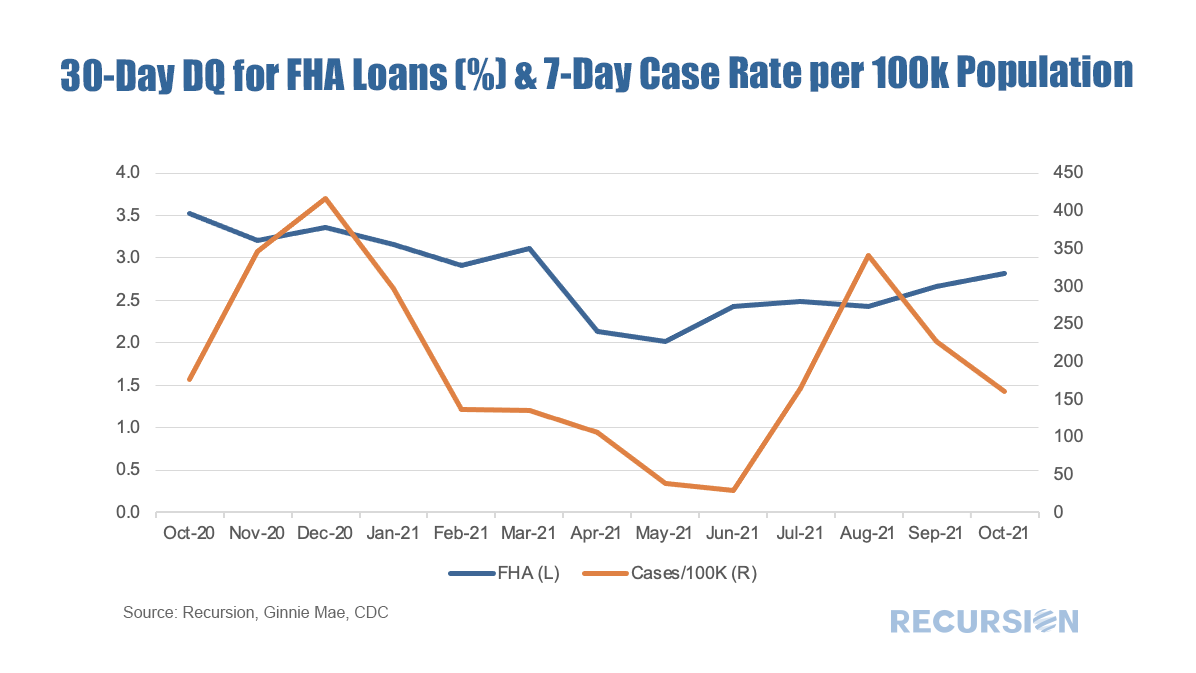
​This pattern doesn’t persist as there is there is no sign yet that the recent decline in cases has yet to be reflected in performance. Such improvement may just be a matter of time, but there is another possible explanation as Hurricane Ida smashed into Louisiana on August 28 this year, and then moved northeast towards New York and New Jersey.
​
Below find a table of the top 10 increases in the FHA 30-day DQ rate for the period from August-October 2021.
Picture
Run Underlying Query
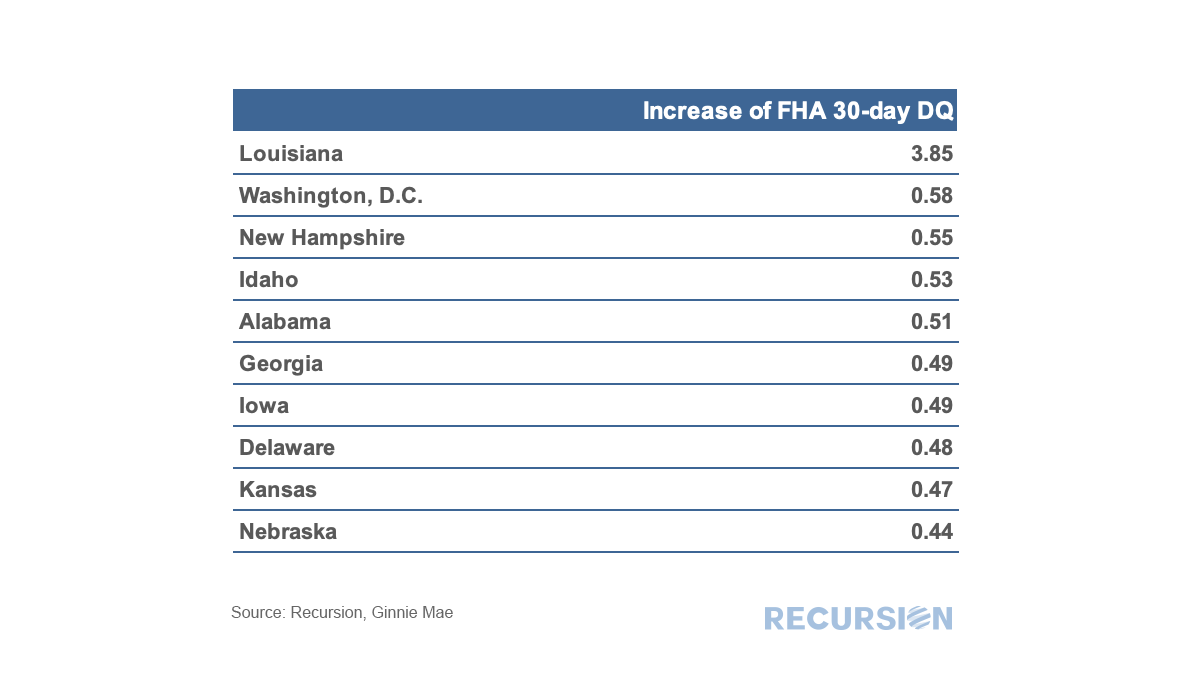
The rise in Louisiana is striking, while others on the hurricane’s path did not experience the same magnitude of impact. For example, New York and New Jersey’s DQ rate rose by 0.16% and 0.43% respectively. Only one state experienced a drop in the DQ rate during the prior two months: Vermont with a change of -0.02%. Interestingly, Vermont has the highest vaccination rate in the country of any state.
​
Finally, how can we confirm that the rise in the delinquency rate was due to Hurricane Ida? It turns out that the Ginnie programs report a breakdown in forbearance between Covid and other (non-Covid) causes. Here is the chart for Louisiana on that basis:
Picture
Run Underlying Query
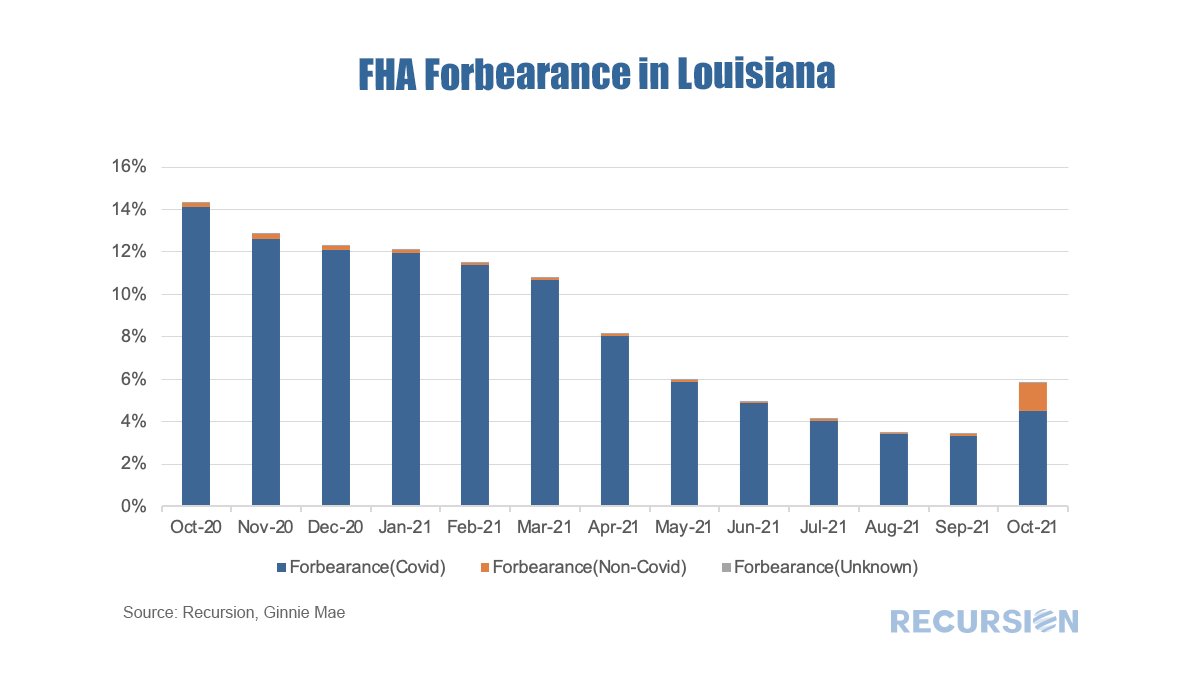
It’s interesting to note not only the rise in non-covid hurricane-related forbearance but also the increase in the Covid forbearance rate that month, indicating that other factors besides weather are at play.
​
The likely culprit in this case is the October 1 deadline for FHA borrowers to apply for forbearance that had been in place. As it turns out, HUD extended this deadline at the very end of September[1]. Some indication of how borrowers will react to this extension in coming months.

The main take-away from this exercise is the complex web of factors that drive loan performance. The economy (labor markets), weather (Hurricane Ida), the pandemic and policy all play a role. It is difficult to imagine producing a formal model that mimics these impacts with any accuracy. Instead, effective decision-making on the part of investors and policymakers needs to be founded on a deep understanding of market structure, supported by high-frequency big data in the cloud.

[1] https://www.hud.gov/press/press_releases_media_advisories/HUD_No_21_160#:~:text=A%20new%20COVID%2D19%20Forbearance,and%20the%20end%20of%20the

    Archives

    November 2022
    October 2022
    September 2022
    August 2022
    July 2022
    June 2022
    May 2022
    April 2022
    March 2022
    February 2022
    January 2022
    December 2021
    November 2021
    October 2021
    September 2021
    August 2021
    July 2021
    June 2021
    May 2021
    April 2021
    March 2021
    February 2021
    January 2021
    December 2020
    November 2020
    October 2020
    September 2020
    August 2020
    July 2020
    June 2020
    May 2020
    April 2020
    March 2020
    February 2020
    May 2019
    March 2019
    February 2019

    Tags

    All
    Affordability
    ARM
    Bank\Nonbank
    Borrower Assistant Plan
    Cash Window
    Climate Change
    CMBS
    CMO
    Conforming Loan
    Conventional Loan
    COVID 19
    CPR\CDR\CRR\CCR
    Credit Score\DTI\LTV
    CRT\CAS\STACR
    Delinquency
    Early Buyout
    ESG
    ET Pools
    Fannie Mae
    Fed
    FHA
    FHFA
    Forbearance
    Foreclosure
    Foreign Investor
    Freddie Mac
    Ginnie Mae
    Green Loans
    HECM
    HELOC
    HMDA
    HUD
    LMI
    Manufactured Housing
    Modified Loans
    MSR
    Multifamily
    Occupancy Type\NOO
    Partial Claim
    Payoff
    PIW
    Prepayment
    Purchase Loans
    Recursion In News
    Refi Loans
    Reperforming
    RG Pools
    Rural Housing
    Single Family
    Special Eligibility Program
    TBA Market
    TIC
    TPO
    UMBS
    US Treasury
    VA

RECURSION

SOLUTIONS ​
Recursion Analyzers
​
Mortgage Company Data
Recursion DataCloud
Customized Solutions


ABOUT US  ​
Overview
​Our team
CLIENT LOGIN   ​
Recursion Analyzers

CONTACT

224 West 30th St., Suite 303, New York, NY 10001
Contact Us

Picture
Copyright © 2022 Recursion, Co. All rights reserved.​
  • HOME
  • solutions
    • RECURSION ANALYZERS
    • Mortgage Company Data
    • Recursion DataCloud
    • Customized Solutions
  • BLOG
  • CLIENT LOGIN
    • Recursion Analyzers
  • ABOUT US
    • OVERVIEW
    • OUR TEAM
    • News & Events >
      • Recursion In News
      • Recursion Data Citations
  • CONTACT