|
With talk of taper at the top of the monetary policy discussion, it is worthwhile to dig a bit into the role of the Federal Reserve in the functioning of the MBS market. As is well known, the onset of the Covid-19 pandemic resulted in a resurgence of central bank purchases of Agency mortgage-backed securities (MBS). Chart 1 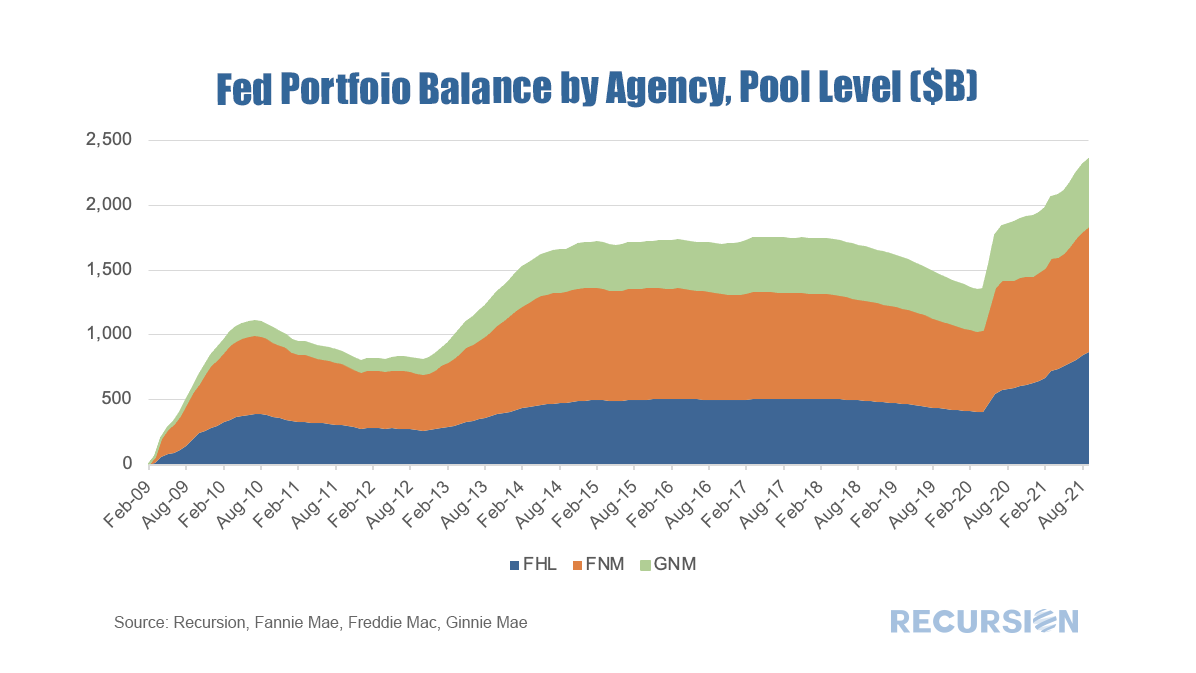 At the present time these holdings amount to more than $2.4 trillion, or about 31% of $7.8 trillion MBS outstanding. Central bank purchases are important not just because of their impact on the “Float”, the availability of particular cusips for trading and potential delivery to the TBA market. The Fed is a “buy and hold” investor, and their purchase of a pool removes it from general market trading. As the Fed is an active participant in the TBA market, their purchases reduce the universe of TBA eligible pools and makes delivery to TBA more expensive. Exactly what pools are locked up in the Fed portfolio? The answer is not actually as simple as it looks. This can be an issue when there are pools of pools, where the real portfolio can only be uncovered by tracing all the way down to the bottom of the collateral chain, with pools that are directly backed by loans. This can be quite a complicated task as the layering of these complex securities can be challenging to follow. Fortunately, we are named “Recursion” and our systems can handle these calculations, well, recursively. One straightforward exercise is to calculate the Fed lockup rate by agency using its exploded portfolio all the way down to the pools backed by loans, to see if Fed is overweighting one agency versus others. This is the picture we obtain: Chart 2 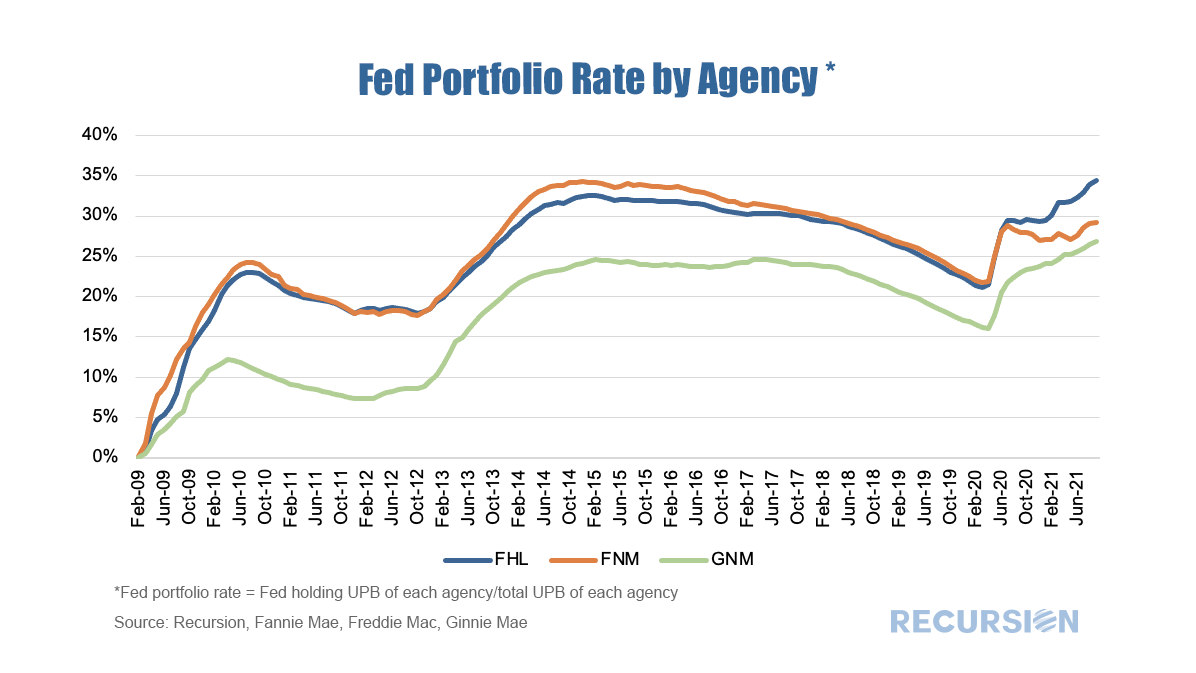 One interesting observation is that the Fed holdings of Fannie and Freddie pools are proportional to their portfolios, until Mar.2020, when the Fed shows a preference to Freddie Mac. As we know the Fed has the intention of purchasing similar shares of Fannie and Freddie, it is natural to ask what has happened? If we look at the super pool (pool backed by pools) level, the Fed is unbiased between Fannie and Freddie. It turns out that the UMBS program may result in an unintentional bias. The UMBS and Commingling In 2014 FHFA instructed the GSE’s to begin to build the infrastructure needed to launch a common MBS, known as the Uniform Mortgage-Backed Security (UMBS). Launched in 2019, investors in the TBA market bid on the price of a security with a particular coupon and maturity date and are delivered a UMBS with either Fannie Mae or Freddie Mac securities, but not both. The success of the program depends on investors being indifferent about which Agency insures the security they receive[1]. To support the program, FHFA established pool rules for the establishment of so-called “supers”, second-tier securities that allow the two agencies to provide securities to the market that contain securities of the other Enterprise as collateral. The supers are commingled. For the pool shares in Chart 1 to differ from the unpacked shares in Chart 2, it must be the case that the share of collateral from the other agency in the production of Supers by one Enterprise must differ from the share issued by the other. In fact, we can see this differential in the table below. Table 1 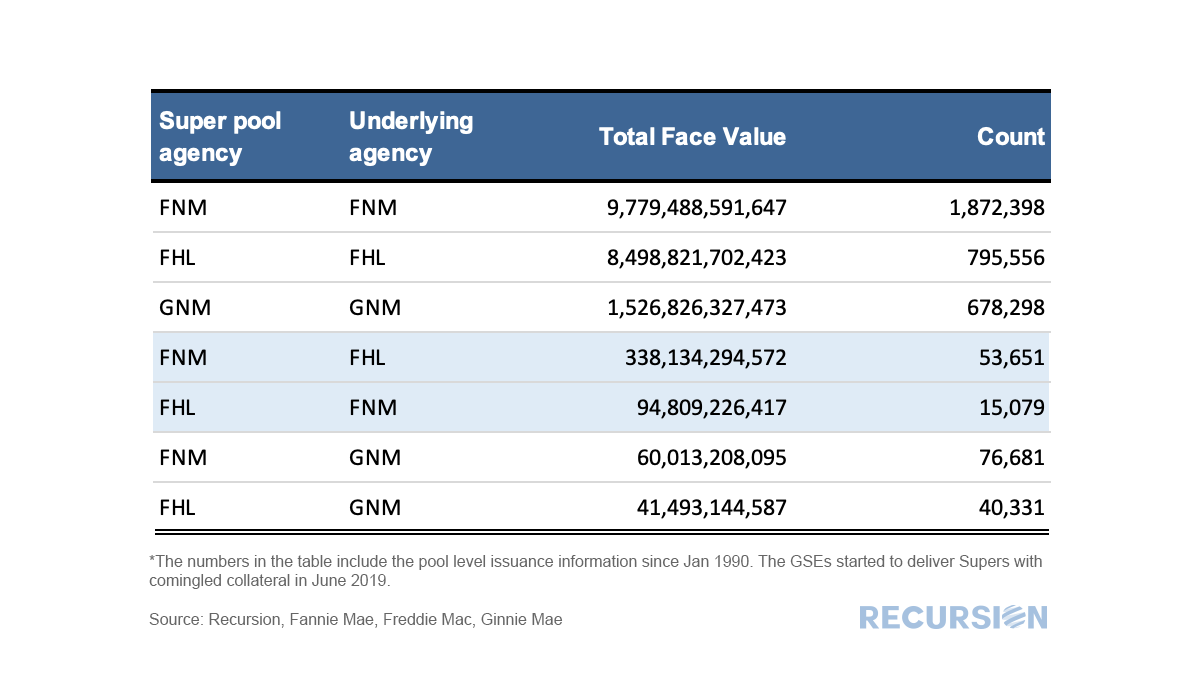 The face value amount of FHL securities used as collateral in FNM securities is over 3.5 times that the reverse since the UMBS was launched. As such, through its activity in the Supers market the share of loans delivered to Freddie Mac owned by the Fed is greater than Freddie Mac’s share of outstanding balances. Conclusion Since the launch of the UMBS in 2019, the Freddie Mac share of the GSE issuance market has shown a pronounced rise. Chart 3 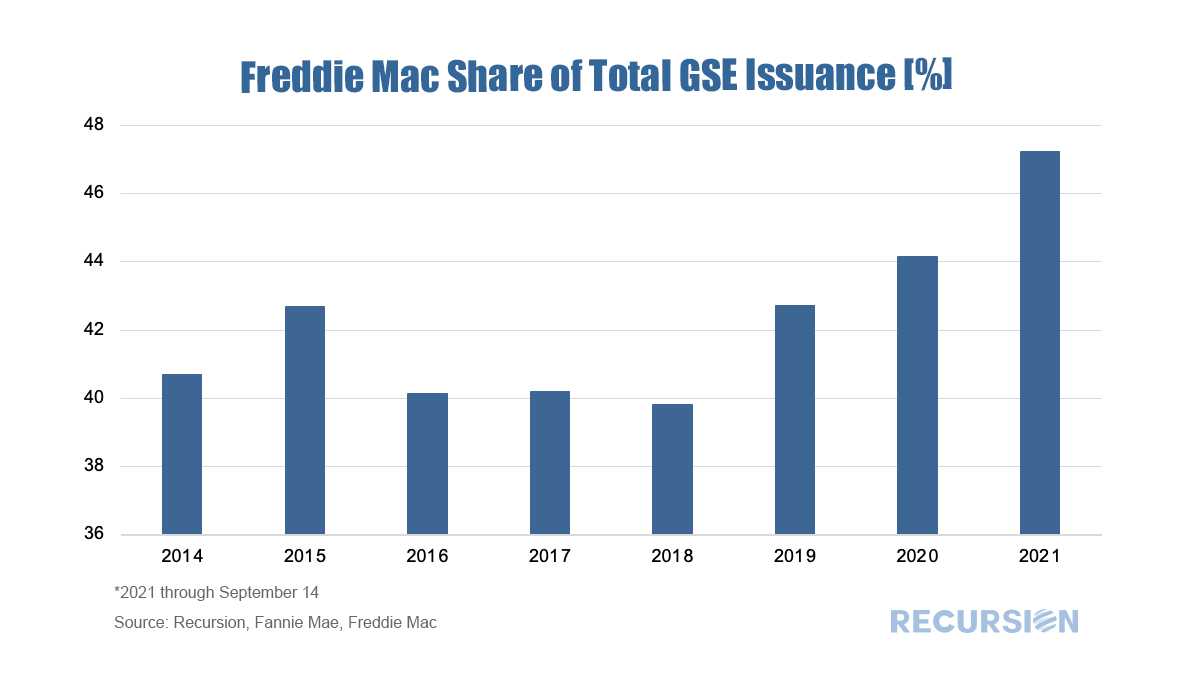 There are, of course, numerous factors behind this increase, notably the convergence of the prices of Fannie Mae and Freddie Mac securities, but there are other possible explanations including differences in the approaches to other activities such as appraisal waivers and steps taken to reduce representation and warranty risk. To these must be added the purchase behavior of the central bank. |
Archives
July 2024
Tags
All
|
 RSS Feed
RECURSION |
|

Copyright © 2022 Recursion, Co. All rights reserved.