• HOME
  • solutions
    • RECURSION ANALYZERS
    • Mortgage Company Data
    • Recursion DataCloud
    • Customized Solutions
  • BLOG
  • CLIENT LOGIN
    • Recursion Analyzers
  • ABOUT US
    • OVERVIEW
    • OUR TEAM
    • News & Events >
      • Recursion In News
      • Recursion Data Citations
  • CONTACT
RECURSION CO
  • HOME
  • solutions
    • RECURSION ANALYZERS
    • Mortgage Company Data
    • Recursion DataCloud
    • Customized Solutions
  • BLOG
  • CLIENT LOGIN
    • Recursion Analyzers
  • ABOUT US
    • OVERVIEW
    • OUR TEAM
    • News & Events >
      • Recursion In News
      • Recursion Data Citations
  • CONTACT
BLOG

The Housing Risk Landscape in Mortgage Winter: HPI, Mortgage Rates and Consumer Spending

10/17/2023

 
With home prices at record high levels and mortgage rates at their record highs since the turn of this century, it’s natural to ask if the housing market will be the source of new systemic risk. Over the past year, we have written extensively about “mortgage winter”, a condition where housing demand is held back because of affordability, while at the same time, supply is constrained by current homeowners who are locked into properties by mortgages with rates far below those available in the prevailing market. This is what economists would call a “bad equilibrium”, a state of great strains in the market that tends to persist.
​
While the housing finance industry is under great duress, the spillover to the broader economy remains limited, as for example, the labor market has held up well despite soaring borrowing costs. Within housing, the notable good economic news is that the extraordinary surge in house prices in the wake of the Covid-19 pandemic has resulted in an astounding 50% surge in the value of homeowner’s equity in real estate since Q1 2020 to over $30 trillion.
Picture
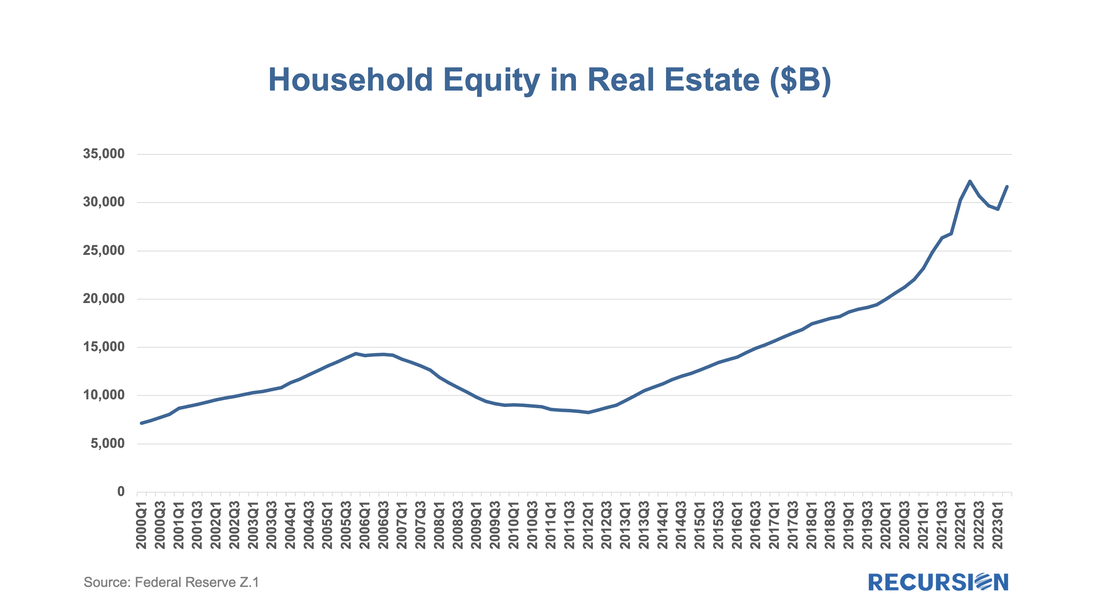
This surge served to directly support the economy over the 2020-2021 period as households extracted some of this equity for their personal spending and investment. In an article published earlier this year, researchers at the New York Federal Reserve found that households extracted about $430 billion from the second quarter of 2020 through the fourth quarter of 2021 via the refinance market[1]. Interestingly, the amount taken out was less than half of what was observed as a share of income during the housing bubble period of the early 2000s. This relatively subdued behavior may in part be the consequence of tighter lending standards in place at present compared to the earlier period.
​
The lid on the cookie jar slammed shut, however, beginning in the second half of 2022 when mortgage rates started their steep upward climb. Volumes of issuance by loan type, newly updated for the third quarter for conforming and Government loans, show this clearly:
Picture
RUN UNDERLYING QUERY-1
RUN UNDERLYING QUERY-2
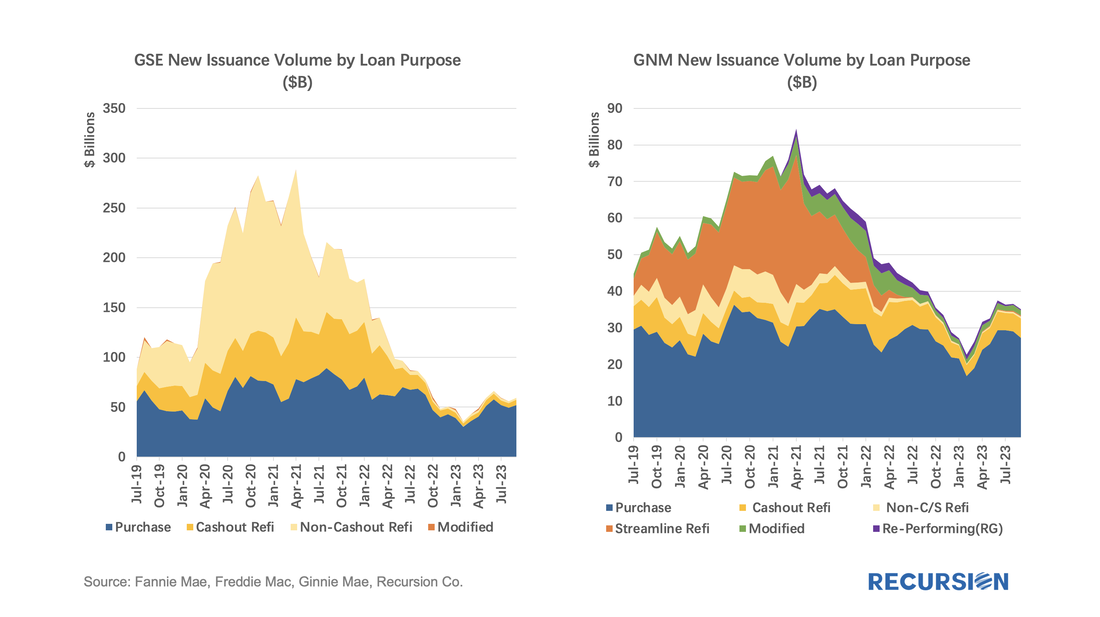
​Total volumes have collapsed since 2021, but the share of cashout refinances out of all refinances remains elevated, although at production levels far below those seen in 2021:
Picture
RUN UNDERLYING QUERY-1
RUN UNDERLYING QUERY-2
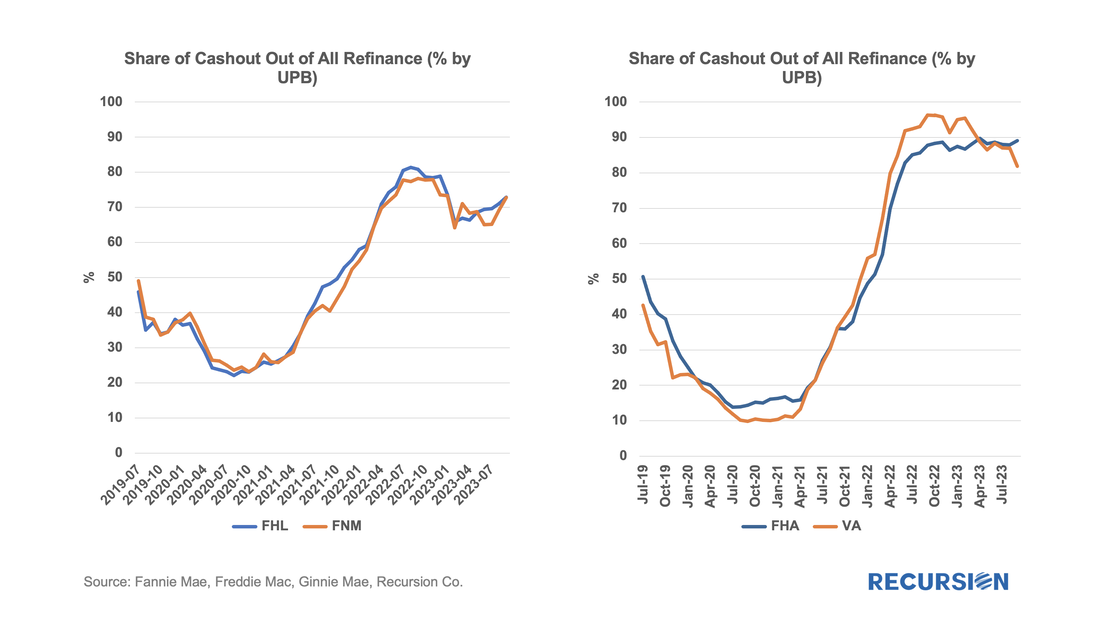
The constraint on cashout volumes is that borrowers refinance the entire remaining balance after the cash extraction at prevailing interest rates, which will be prohibitively expensive for most households. An alternative source of funds out of housing equity is second liens. In this case, borrowers only need to borrow the amount they wish to “extract” at the prevailing rate which is generally much less than the remaining loan balance. As these “seconds” are not eligible to be included in agency securities, we do not have the detailed loan-level information we have for refinance loans, but we can get an aggregate figure from the Federal Reserve Z.1 report. Below find a chart of second liens and cashout refinances on a quarterly basis, with the 30-year mortgage rate as an overlay.
Picture
RUN UNDERLYING QUERY-1
RUN UNDERLYING QUERY-2
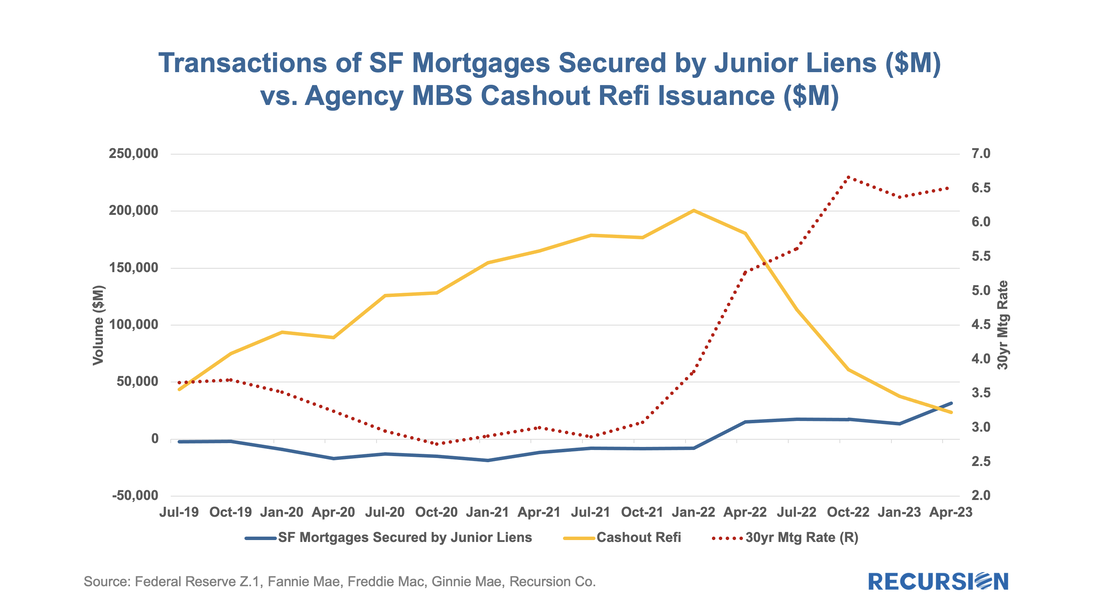
A key point to underscore in this chart is that the blue line is the new production of “seconds”, while the yellow line is the total volume of deliveries of securitized cashout refinance loans. Seconds remained subdued during the high refinance period 2020-early 2022 and have only recently started to pick up now that the refinance channel has dried up. Many banks have not offered second liens so progress on this front is slow, but impediments to new production may decline over time.
​
An interesting feature of second liens is that interest payments on these loans are generally not tax deductible, although prior to 2019 an exception was made for spending on home improvements[2]. While the tax incentive is gone at present, the idea that funds obtained from tapping home equity end up being spent on improvements remains alive. As the rate lock set in starting last year, many homeowners who wished to move up to larger properties instead found themselves improving and expanding their current homes. It seems reasonable to think that a significant portion of this increase was funded by equity extraction.
Picture
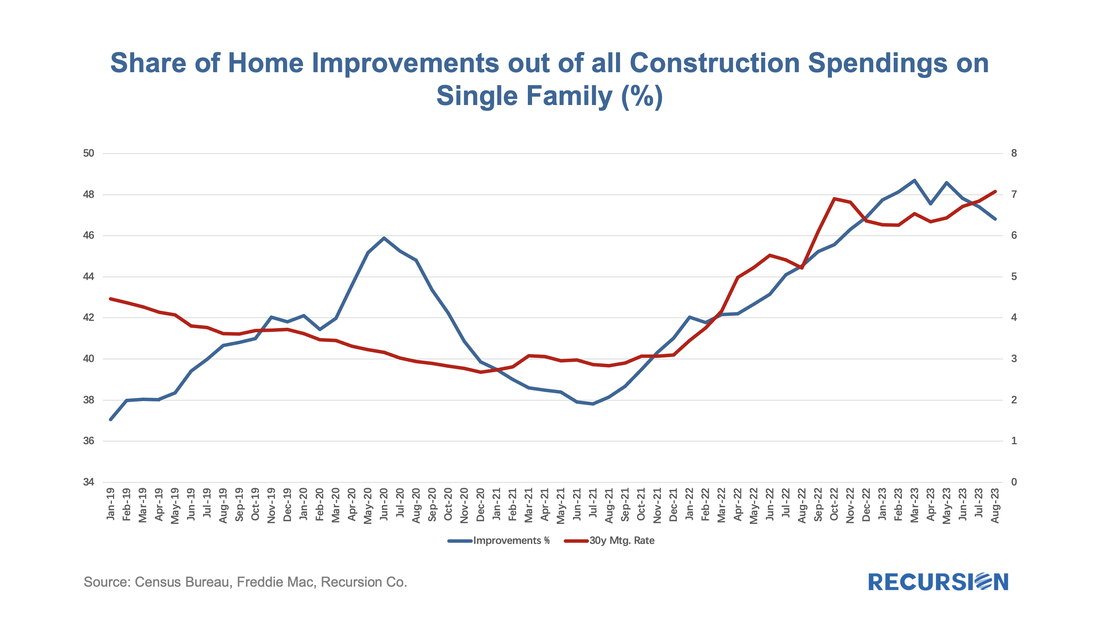
In fact, the share of spending on home improvements rose from 38% in the mid of 2021 to above 48% earlier this year, aligning with the steep climb of mortgage rate.

Where does that leave us?
​
  • “Mortgage winter”, the state in which house prices remain elevated while transactions are depressed, will persist as long as interest rates remain elevated. Given the current strength of the labor markets and the huge gap between prevailing rates and those held by a large majority of households with outstanding mortgages, this state could persist for an extended period.
  • The impact of the surge in homeowner’s equity we have seen since the onset of the pandemic tends to offset somewhat the broad economic impact of weak housing transaction volumes. This occurs directly through equity extraction, which is holding up in the second lien market while cashout refinances contract. This support is also due to an indirect “wealth effect” which boosts the confidence of homeowning consumers who are aware that they own valuable assets.
  • Consumers have not gone on a spending binge based on home equity the way they did just before the global financial crisis. Instead, they seem to have been using such funds to invest in their properties, resulting in a much less risky environment at present.
  • Strong labor markets are providing a solid backdrop for loan performance. The trend toward the use of buydowns by many borrowers peaked earlier this year, and lenders appear to have been broadly cautious about the availability of this product[3].
  • On the downside, there remains a great deal of uncertainty surrounding the impact of higher interest rates on the banking system. The market has settled down since the turbulence experienced in the first quarter, led by the collapse of SVB. But as rates reach new highs, it would not be surprising to see volatility return. A particular area of concern is commercial real estate, although the multifamily market may hold up better than other sectors[4].

[1]https://libertystreeteconomics.newyorkfed.org/2023/05/the-great-pandemic-mortgage-refinance-boom/
[2]https://www.irs.gov/faqs/itemized-deductions-standard-deduction/real-estate-taxes-mortgage-interest-points-other-property-expenses/real-estate-taxes-mortgage-interest-points-other-property-expenses-2
[3] https://www.recursionco.com/blog/a-first-look-at-buydowns
[4]https://www.recursionco.com/blog/refinance-risk-in-the-agency-multifamily-market

    Archives

    October 2023
    September 2023
    August 2023
    July 2023
    June 2023
    May 2023
    April 2023
    March 2023
    February 2023
    January 2023
    December 2022
    November 2022
    October 2022
    September 2022
    August 2022
    July 2022
    June 2022
    May 2022
    April 2022
    March 2022
    February 2022
    January 2022
    December 2021
    November 2021
    October 2021
    September 2021
    August 2021
    July 2021
    June 2021
    May 2021
    April 2021
    March 2021
    February 2021
    January 2021
    December 2020
    November 2020
    October 2020
    September 2020
    August 2020
    July 2020
    June 2020
    May 2020
    April 2020
    March 2020
    February 2020
    May 2019
    March 2019
    February 2019

    Tags

    All
    Affordability
    ARM
    Bank/Nonbank
    Bank\Nonbank
    Borrower Assistant Plan
    Cash Window
    Climate Change
    CMBS
    CMO
    Conforming Loan
    Conventional Loan
    COVID 19
    CPR\CDR\CRR\CCR
    Credit Score\DTI\LTV
    CRT\CAS\STACR
    Delinquency
    Early Buyout
    Early Payment Default
    ESG
    ET Pools
    Fannie Mae
    Fed
    FHA
    FHFA
    Forbearance
    Foreclosure
    Foreign Investor
    Freddie Mac
    Freddie Mae
    Ginnie Mae
    Green Loans
    HECM
    HELOC
    HMDA
    HUD
    LMI
    Manufactured Housing
    Modified Loans
    MSR
    Multifamily
    Occupancy Type\NOO
    Partial Claim
    Payoff
    PIW
    Prepayment
    PUD
    Purchase Loans
    Recursion In News
    Refi Loans
    Reperforming
    RG Pools
    Rural Housing
    Second Lien
    Single Family
    Special Eligibility Program
    TBA Market
    TIC
    TPO
    UMBS
    US Treasury
    VA

    RSS Feed

RECURSION

SOLUTIONS ​
Recursion Analyzers
​
Mortgage Company Data
Recursion DataCloud
Customized Solutions


ABOUT US  ​
Overview
​Our team
CLIENT LOGIN   ​
Recursion Analyzers

CONTACT

224 West 30th St., Suite 303, New York, NY 10001
Contact Us

Picture
Copyright © 2022 Recursion, Co. All rights reserved.​
  • HOME
  • solutions
    • RECURSION ANALYZERS
    • Mortgage Company Data
    • Recursion DataCloud
    • Customized Solutions
  • BLOG
  • CLIENT LOGIN
    • Recursion Analyzers
  • ABOUT US
    • OVERVIEW
    • OUR TEAM
    • News & Events >
      • Recursion In News
      • Recursion Data Citations
  • CONTACT