|
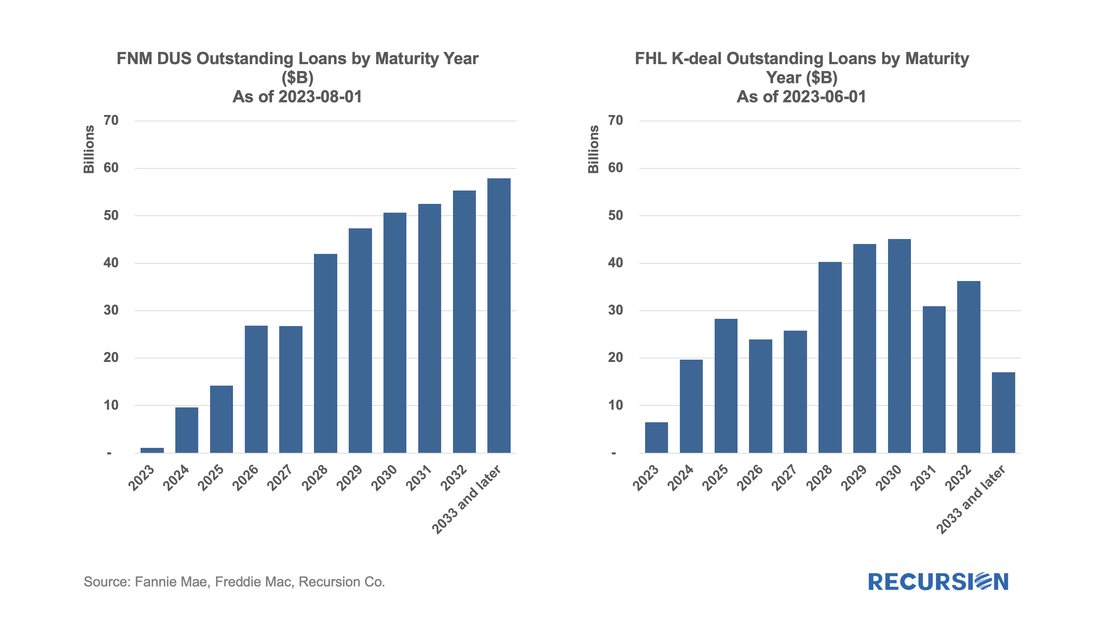
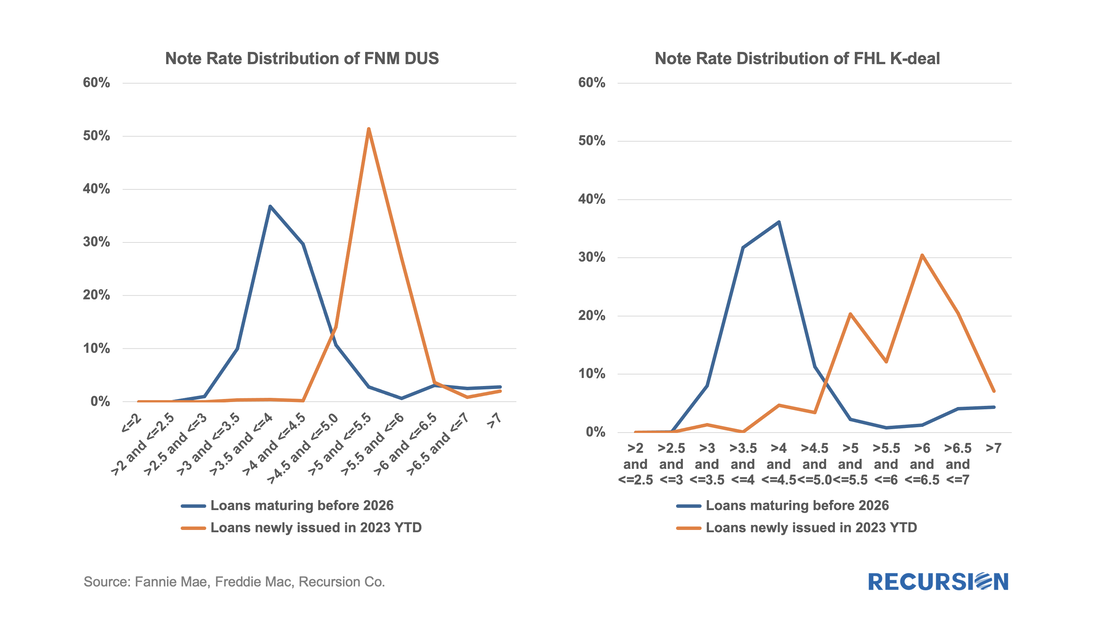
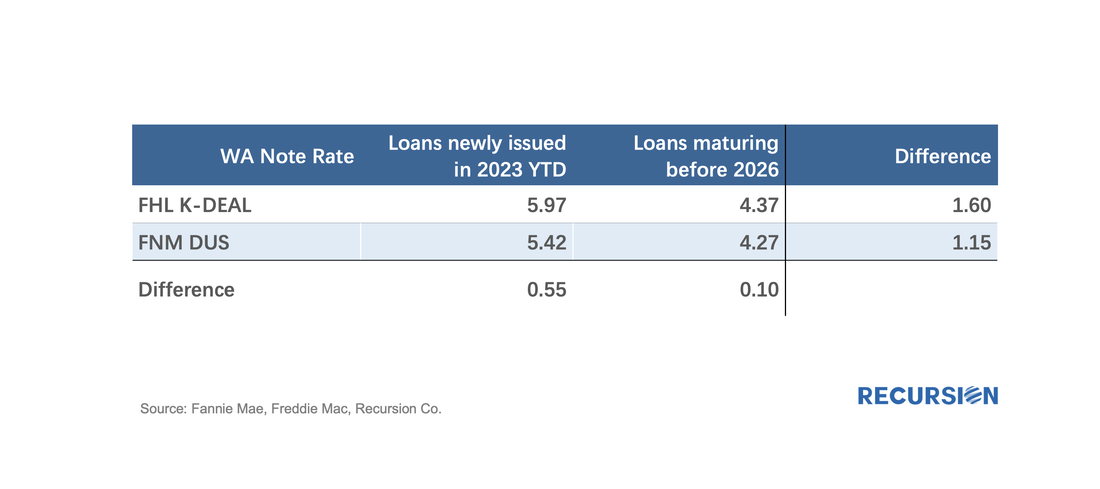
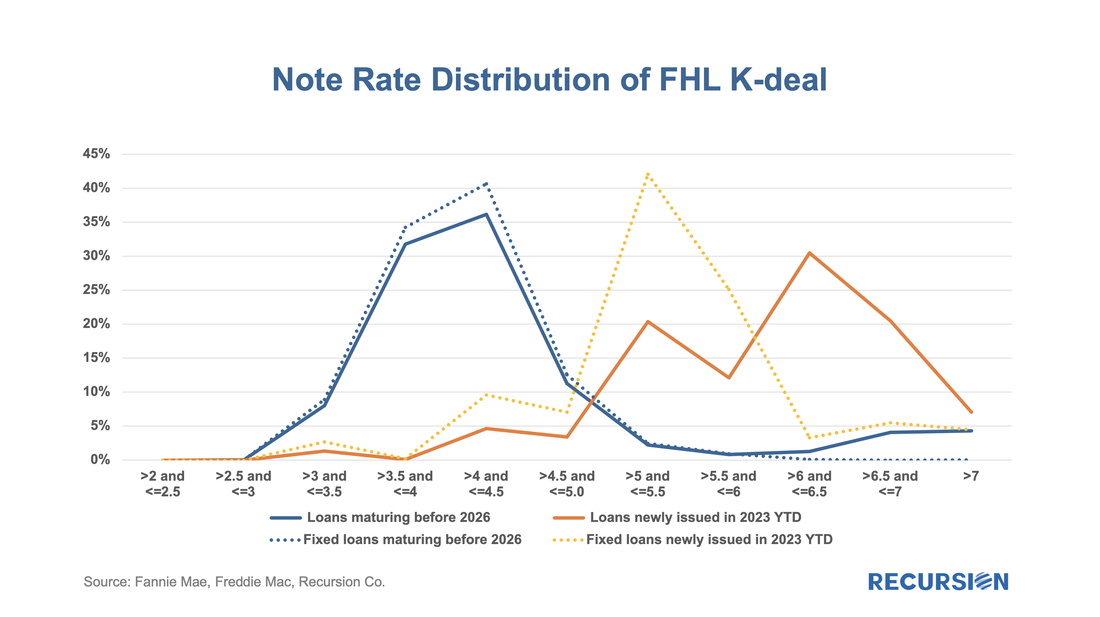
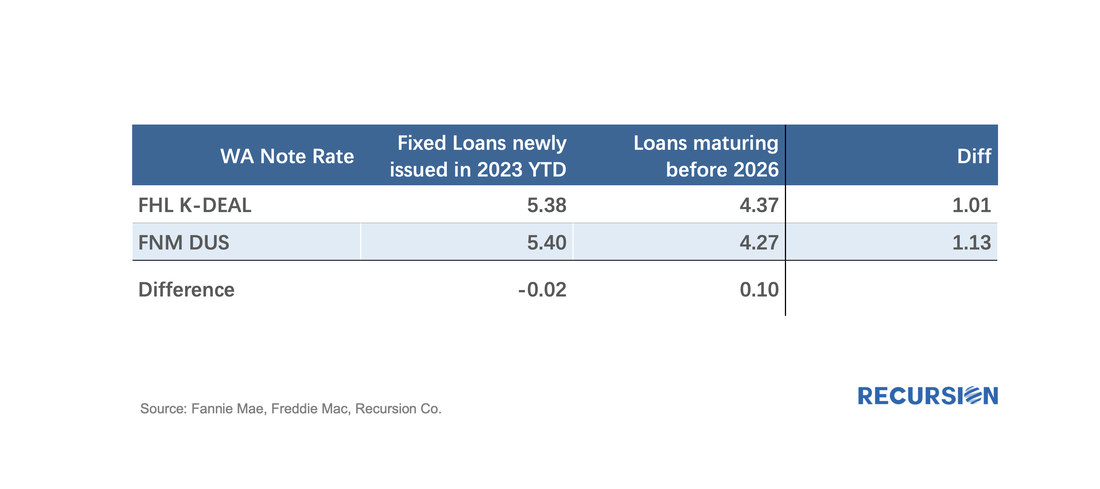
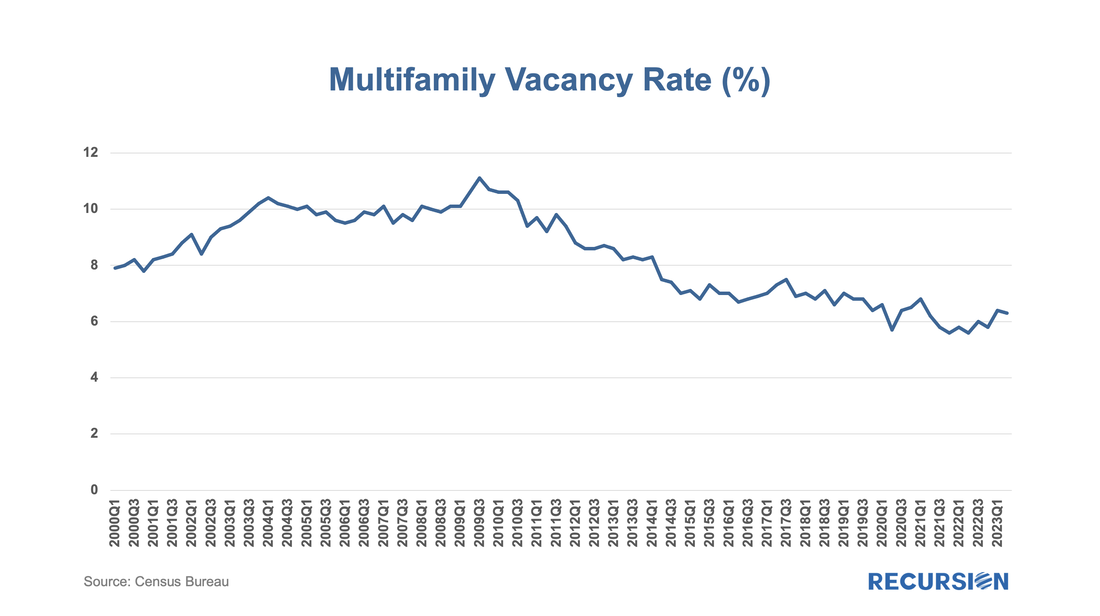
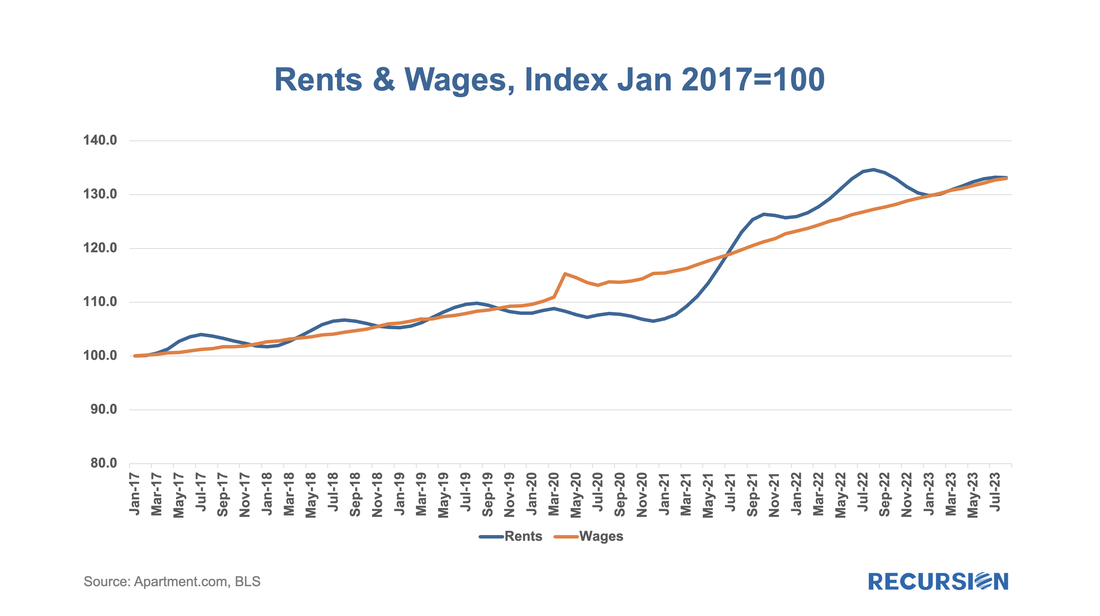
In a recent post, we discussed trends in commercial real estate outstanding debt, with an emphasis on the Agency multifamily market[1]. We mentioned that the key difference between risk sources associated with multi- and single-family debt is that the I/O structure and balloon term that predominates in multifamily loans implies that there is significant refinance risk in this market. We also previously wrote that we have collected all the loans in the major Agency multifamily books and verified that this data was consistent with the Federal Reserve’s Z.1 report[2]. We are now prepared to take some first steps at estimating the extent of this risk. To simplify things, in this note, we look just at the two major GSE multifamily programs, Freddie Mae DUS[3] and Freddie Mac K-deals[4]. To begin, as of August 1, 2023, the Fannie Mae DUS deals account for $384.5 bn or 86% of the total FNM book of $448.1 bn, while Freddie K deals account for $317.9 bn or 83% of $384.9 bn outstanding as of June 1, 2023. Superficially similar. Below find the maturities for the two programs by year starting in June 2023 for Freddie Mac and August 2023 for Fannie Mae[5]: More Freddie Mac K-deals will mature than Fannie DUS through 2025 but similar in the 2026-2028 period. In the outer years, DUS maturities continue to rise while K-deal maturities tail off. To get a sense of the potential refinance risk, we look at the rates of the maturing loans through 2025 compared to prevailing rates so far this year: Clearly the current higher level of interest rates we are experiencing this year are considerably higher than those of maturing loans across these two programs. For precision, here is a small summary table: An interesting observation is that the interest rates of loans maturing between now and 2026 are quite close between the Fannie Mae DUS and Freddie Mac K programs, at 4.3% and 4.4%, respectively. However, the distribution of loans issued this year is skewed considerably higher for K-deals at 6.0% vs. 5.4% in DUS. What explains this discrepancy? A key distinction between K and DUS deals is that the former generally consists of a much higher share of floating rate loans than do the Fannie Mae deals. YTD 2023 (through June for Freddie; through August for Fannie), floating rate Freddie K-deal loans comprised 52% of total issuance, while the same figure for DUS was just 1%. So let’s decompose the loan distributions for the Freddie Mac chart above: The fixed-rate loan distribution of fixed loans maturing through 2025 looks very similar to the total. However, the distribution of fixed loans issued this year is very different from the total. If we update the small table above and include just the fixed note rates for Freddie Mac instead of the total, we get: Here the differences are very small between agencies both for maturing loans and new issuance, which is somehow reassuring. So, GSE fixed multifamily debt is maturing, facing a 1% + increase in borrowing costs from refinancing. Is this a problem? A lot has been written in the commercial market literature about the office market apocalypse. The key distinction between offices and apartments is the difference in vacancy rates. It is estimated that the vacancy rate in offices nationally is about 20%[6], while the picture for multifamily is much less downbeat. The current rate of 6.3% is quite low based on the experience over the past 23 years. This means there may be some scope for landlords to pass along increasing borrowing costs from refinancing their debt. To what extent? One way to look at this is to what extent growth in rents and wages have diverged since the pre-Covid period: Remarkably, on an aggregate basis, the answer appears to be not very much. So, in an environment of relatively low vacancies and steady gains in wages relative to rents, it seems unlikely that modest increases in credit costs will result in broad-based financial distress for renters or landlords. Of course, this is a national average which covers a wide range of circumstances. It is quite possible that wages have lagged rents in low-income areas and that borrowing costs will be difficult to pass along either due to regulation or economics. And over time, if rates remain elevated, the maturing loans will increasingly be those that originated during the period of extremely low-interest rates, implying that refinance costs will rise. There is much more research that can be conducted here. This report barely scratches the surface of what is possible to achieve in this important area. We encourage those interested in conducting their own research to reach out and explore the power of these new tools. [1] https://www.recursionco.com/blog/ownership-of-risk-in-the-commercial-real-estate-market
[2]https://www.recursionco.com/blog/introducing-the-recursion-agency-multifamily-datasetpart-2-outstanding-balance-benchmarking [3] https://multifamily.fanniemae.com/financing-options/conventional-products/dus-mbs [4] https://mf.freddiemac.com/investors/k-deals [5] As a rule, Freddie Mac tends to hold its K-loans on balance sheet for a few months before securitizing them while Fannie Mae tends to securitize soon after origination. [6] https://www.cbre.com/insights/reports/2023-us-real-estate-market-outlook-midyear-review |
Archives
July 2024
Tags
All
|
RECURSION |
|
Copyright © 2022 Recursion, Co. All rights reserved.

 RSS Feed
