|
In a recent post, we discussed trends in the ownership of risk in the single family residential real estate market[1]. In this note, we round the picture out with an analysis of the commercial real estate market. 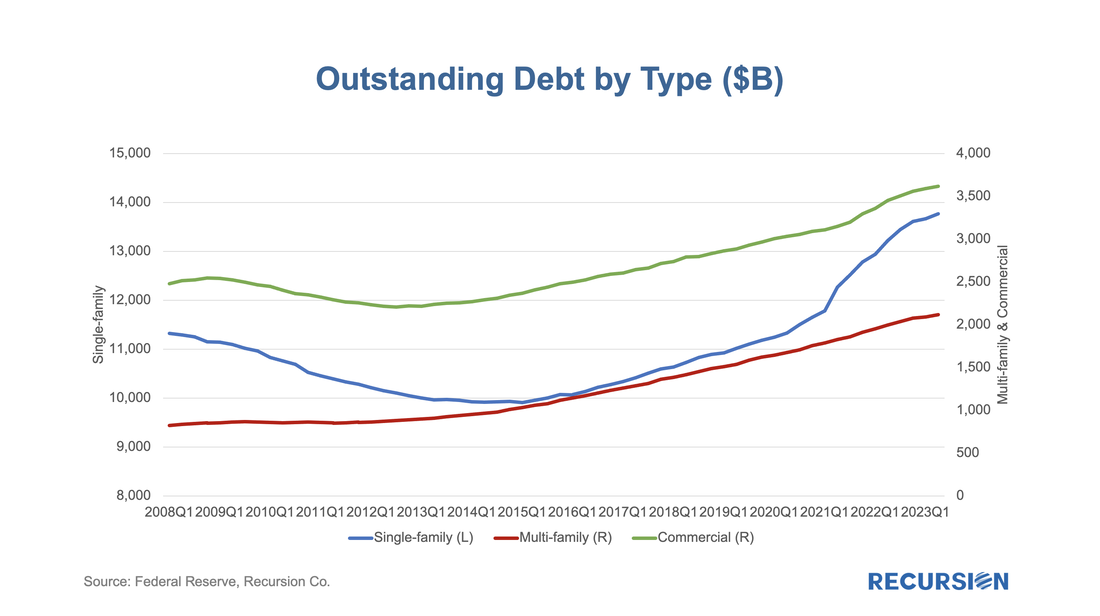 A quick observation is that the Global Financial Crisis (GFC) had a substantial impact on the outstanding value of the Residential market (-12.5% from the peak of $11.3T in Q1 2008 to the trough of $9.9T in Q1 2015.) The Commercial market was interestingly hit by a slightly bigger proportion (-13.5% from the peak of $2.6T in Q4 2008 to $2.2T in the trough of Q3 2012.) The Multifamily market, on the other hand, expanded through the entire post-GFC period, growing by about 2.6 times to $2.1T in Q2 2023. Below find the relationship between the 10-yr Treasury yield (inverted and lagged one year) and the change in the value of outstanding debt in the commercial and multifamily markets: 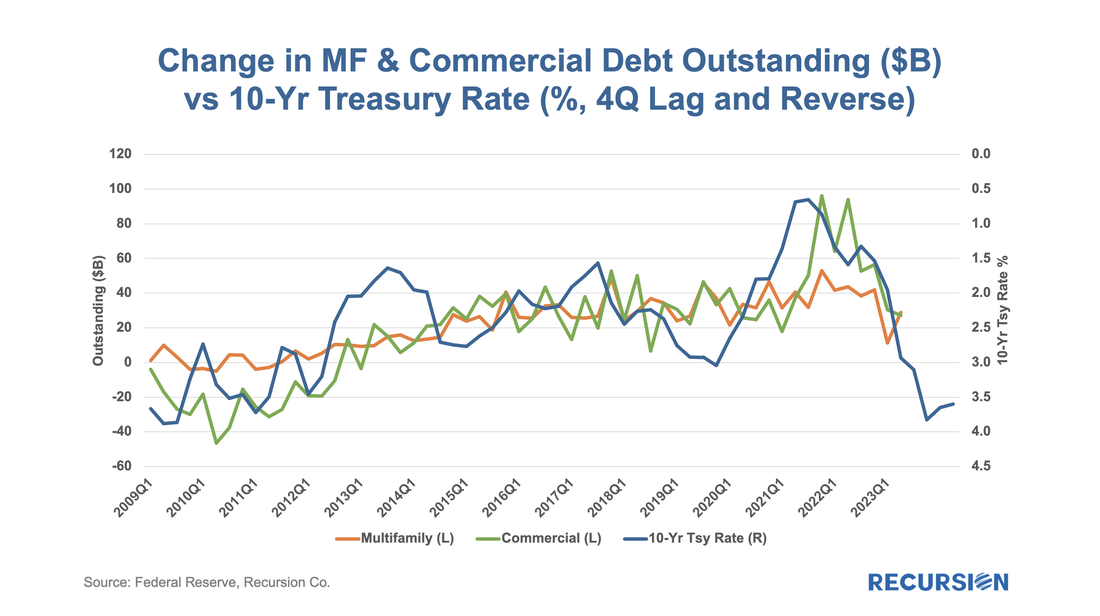 Interestingly, the record-low 10-year Treasury yields below 1.0% experienced after the onset of the COVID-19 pandemic resulted in a more pronounced boom in lending in commercial mortgages than in the multifamily market. Unfortunately, the Z.1 data does not break down this category into its components (offices, retail etc.). Over the period from 2009Q1-2023Q2, however, the correlation between the 10-yr Treasury yield and the change in multifamily and commercial debt are -0.63 and -0.69, respectively, implying an overall larger sensitivity to rate changes for commercia relative to l multifamily debt. Next, we turn to the composition of ownership of multifamily risk. 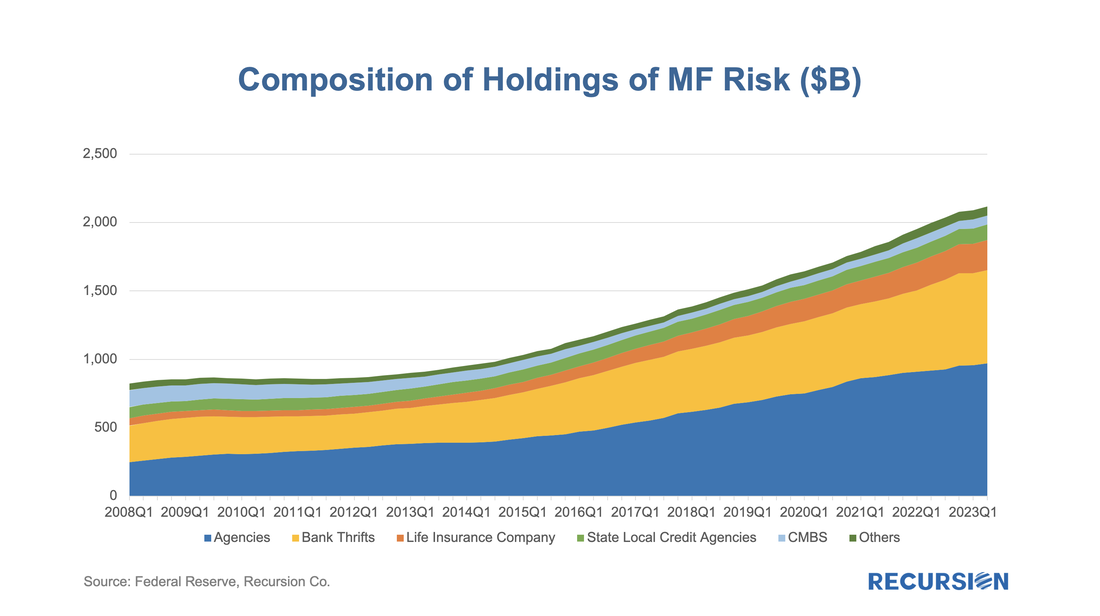 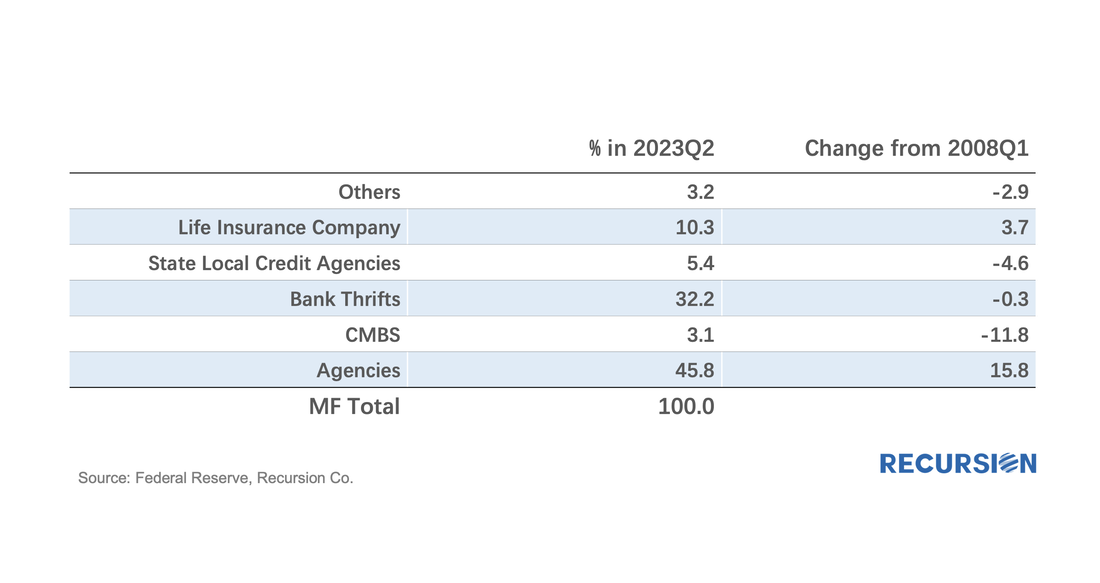 Since the onset of the GFC, the Agency share of multifamily risk has risen by 15.8% to 45.8%, with Life Insurance Companies rising by 3.7% to 10.3%. The biggest category in decline was CMBS, falling by 11.8% to 3.1%, followed by State & Local Agencies with a decline of 4.6% to 5.4%. The second biggest category, Banks and Thrifts was essentially unchanged at 32 %. The rise of the influence of the GSEs at the expense of CMBS is a subject of some debate, reflecting both an increasing policy emphasis on affordable housing and the funding advantages of the Agencies. There are a few quick observations worth mentioning. First, the aggregate agency composition of the multifamily market has been quite stable over the past few years, unlike what has occurred in the single-family space over the same period: 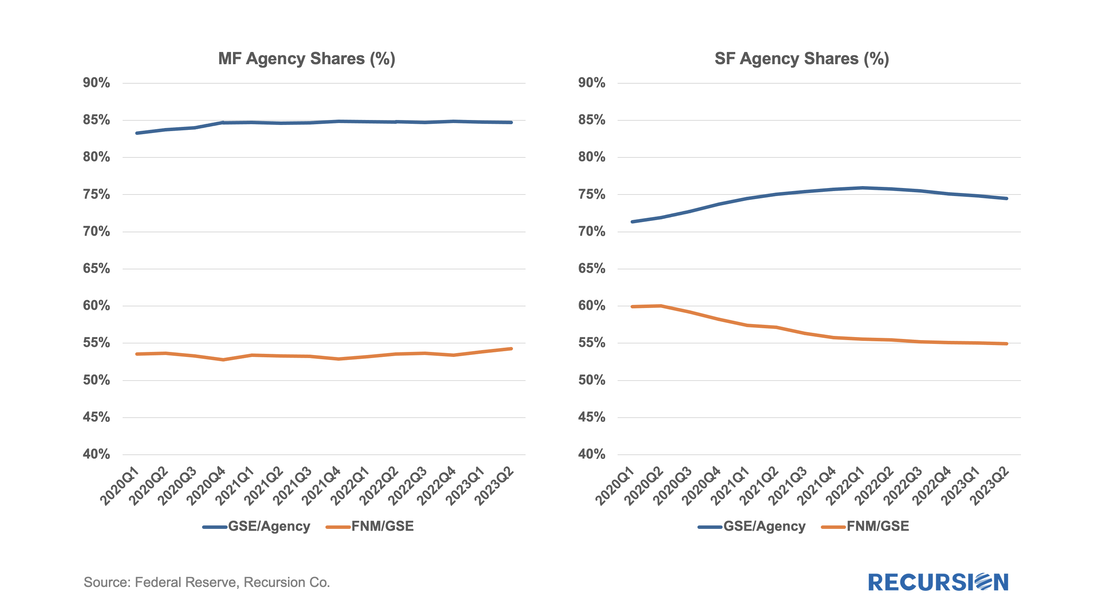 The dynamics of the loan vs. securities decision on the part of the banking sector that is a driving factor of mortgage investments for the single-family market simply does not apply in the multifamily space. Nonetheless, there are important distinctions within the multifamily Agency market to be watched, but these are based on differences between a multitude of programs rather than the Conventional-Government disparity that dominates the single-family space. More to come on this. Second, a comment on banks. Since we have this category for commercial loans, we have three markets to observe here: 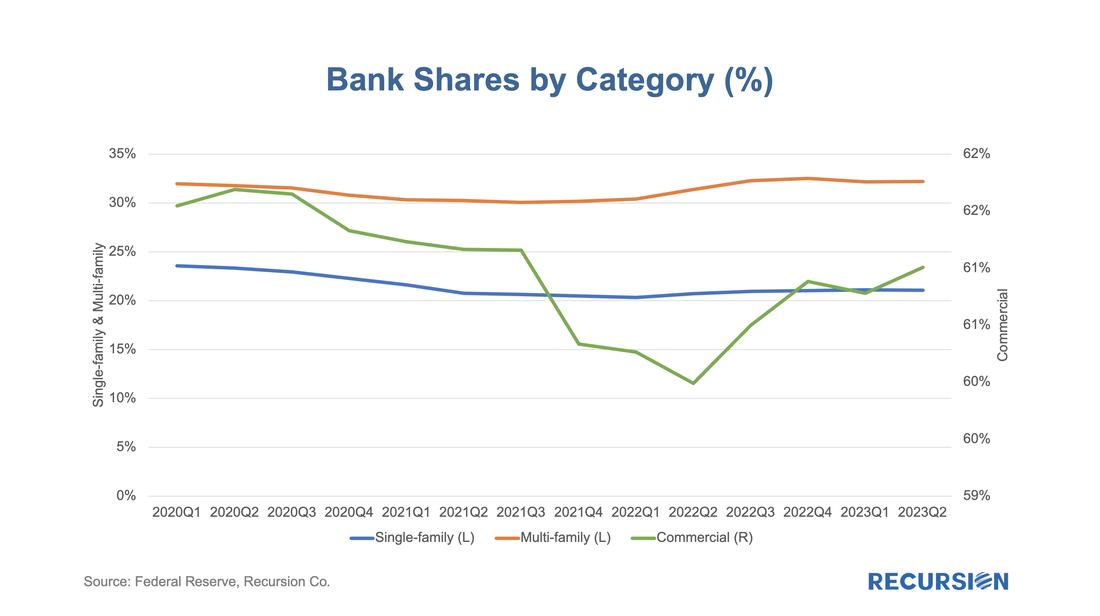 The most interesting takeaway here is that the onset of COVID-19 was associated with a sharp drop in the bank’s share of the holdings of risk in the commercial real estate market, offset somewhat by an increase in its share of Multifamily. More recently, the share in the commercial market has recovered, likely due to a sector reallocation within that market. Finally, a comment on risk. In the single-family “QM” market, a simplified but broadly accurate view of risk is that it can be broken down between credit risk, held largely by the Agencies, Banks and holders of GSE Credit Risk Transfer (CRT) obligations, and interest rate risk, held in one form or another by all categories of investors. In the case of the Agency multifamily market, credit risk is largely held by the Agencies themselves, except in risk-sharing programs such as the Freddie Mac “K-deals”. Insofar as the Agency multifamily market, to a significant extent, consists of I/O’s, and there are often barriers to refinancing, the main category of interest rate risk in this market is refinance risk. When loans mature and need to be rolled over in an environment where rates are much higher than was the case when initially originated, property owners can enter a state of financial distress. In the case of housing occupied by low-income borrowers, this situation can be particularly severe, as rent increases can be limited by regulation or the ability of tenants to pay. More on this later. |
Archives
July 2024
Tags
All
|
 RSS Feed
RECURSION |
|

Copyright © 2022 Recursion, Co. All rights reserved.