|
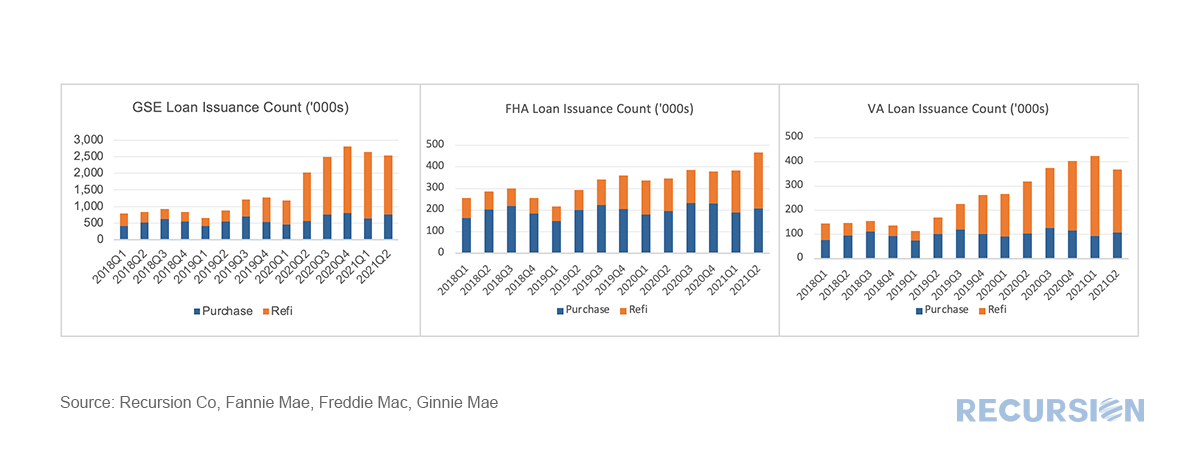
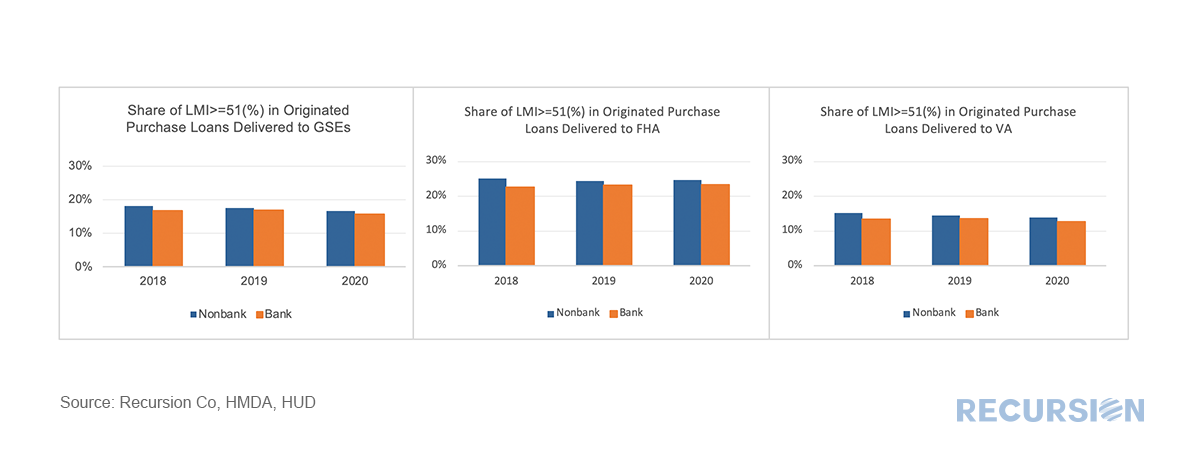
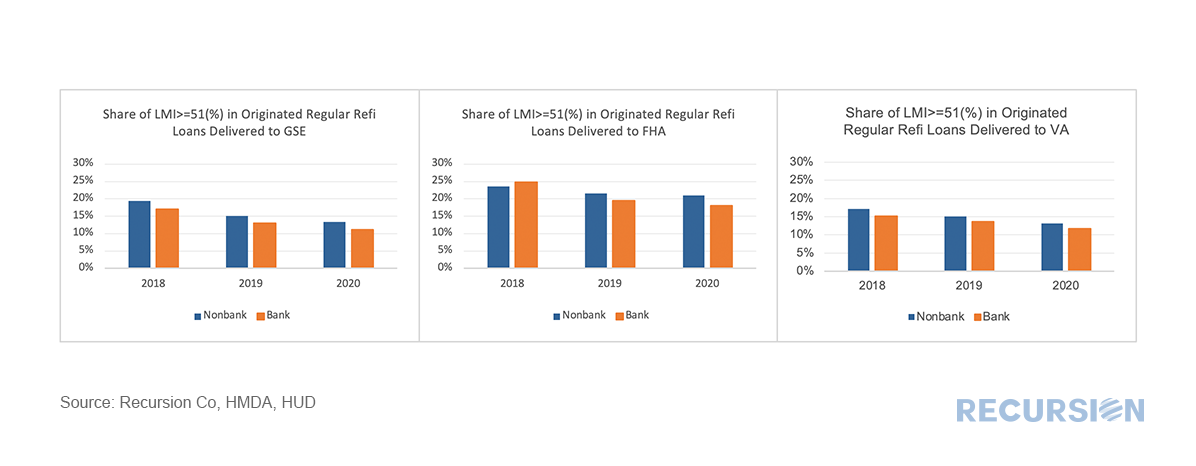
Credit provision is one of the great areas of concern addressed by the New Housing Policy. In a previous post[1], we mentioned that we have integrated HUD LMI Neighborhood information with our tools. We can view aggregate credit creation through Cohort Analyzer, and its composition through HMDA Analyzer. 2020 marked an unprecedented year for mortgage production as the pandemic sparked aggressive moves by the Federal Reserve driving mortgage rates to record lows, coupled with a flight of households away from density towards more sparsely populated areas. Trends in the major programs by loan count can be seen here: *This chart can be duplicated using the above two queries By loan count, conventional purchase loans increased modestly with the onset of the pandemic, while those for both FHA and VA programs stayed relatively steady. In the case of refinancings, these boomed for the GSEs and VA, while the increase in FHA refis was much more modest. Received wisdom here is that many FHA borrowers took advantage of soaring house prices (and associated lower LTVs) to refinance into conventional mortgages. What does this all mean for lower-income borrowers? Here is the share of the number of purchase loans in LMI areas for total purchase mortgages by program type, broken down between banks and nonbanks using HMDA[2]: Unsurprisingly, FHA has the largest share of purchase borrowers residing in high LMI areas, followed by the GSEs and VA. Across all programs, the low income shares in purchase loans for both banks and nonbanks were little changed during the pandemic. Finally, we look at regular (noncashout) refis. The story here is quite different: Once again, FHA has the largest share of refi mortgages made in LMI areas compared to the other two programs. From the time that interest rates peaked in 2018 through the end of 2020 we have seen a smaller low income shares in regular refis delivered to all three programs. However, FHA’s decline in 2020 from the previous year (nonbanks: 21.5% to 21.0%, banks: 19.5% to 18.1%) was smaller than for the GSEs (nonbanks:15.2% to 13.3%, banks: 13.0% to 11.2%) and VA (nonbanks: 15.1% to 13.2%, banks: 13.6% to 11.6%). Received wisdom here is that surging volumes of refis due to falling interest rates in the last two programs resulted in capacity constraints that led to credit rationing in favor of higher income areas. [1] https://www.recursionco.com/blog/big-data-and-the-new-housing-policy
[2] LMI information is applied to originated loans reported in HMDA at the census track level. In this analysis, we ignored the loans that do not have LMI distinctions due to unreported census track information. |
Archives
July 2024
Tags
All
|
RECURSION |
|
Copyright © 2022 Recursion, Co. All rights reserved.


 RSS Feed
