|
Mortgage lenders obtain loans through three channels 1) The retail channel through which they originate loans, 2) The wholesale channel through which they purchase loans that are originated by other financial institutions, and 3) the broker channel through which they acquire loans that are originated by the lender through an independent mortgage banker not affiliated with the originating institution. Channels from outside the selling institution are called Third Party Originations or TPO’s. Every month Fannie Mae and Freddie Mac report the selling institution of every loan delivered to them, and the channel by which the loan was obtained. Over the last couple of years there has been a notable rise in the share of the broker channel. This note looks at recent trends and looks for market segments in which these are most pronounced, with an emphasis on the broker channel. Table 1 shows the market shares of sales to the GSE’s by channel. 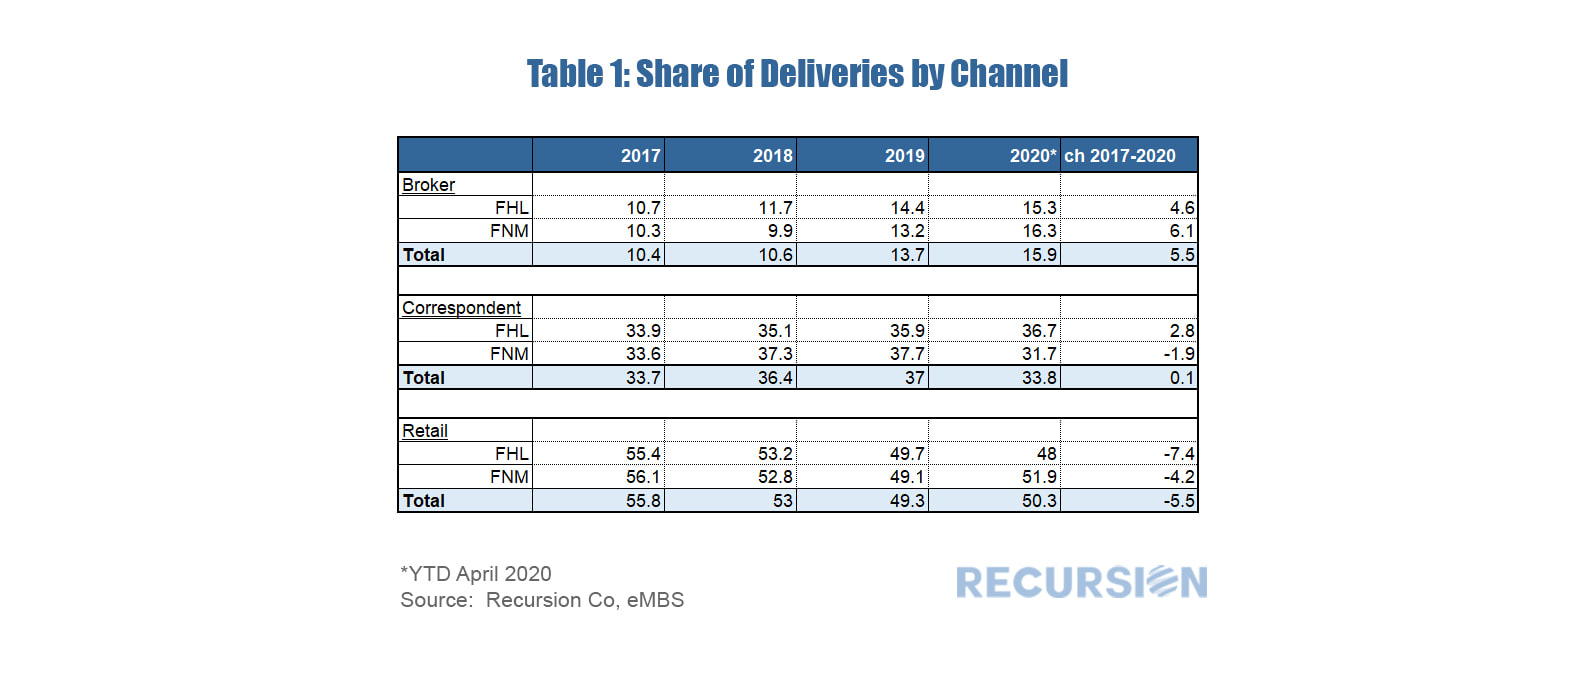 We have written extensively on the mortgage market impact of the Covid-19 crisis, most recently on the first signs of delinquencies in the loans in the reference pools of the Freddie Mac Structured Agency Credit Risk (STACR) program[1]. In that post we noted the dispersion in 30-day average loan delinquencies by state for May 2020. In this note we look at the distribution of delinquencies in the same month across each of the 28 deals issued to date. We can see a distinct increase in the rate of delinquencies from the onset of the program through 2019, before falling early this year. What can account for this pattern? In the five-year period from early 2013 to early 2019, we notice that there was a trend loosening in credit standards as measured by the share of loans in Agency securitized pools with debt-to-income ratios in excess of 45. The trend was exacerbated in 2018 due to rising mortgage rates weighing on mortgage production volumes. As rates fell back during the course of 2019, pressure to keep lending standards so loose eased, and fewer high-LTV loans were delivered to the Agencies. 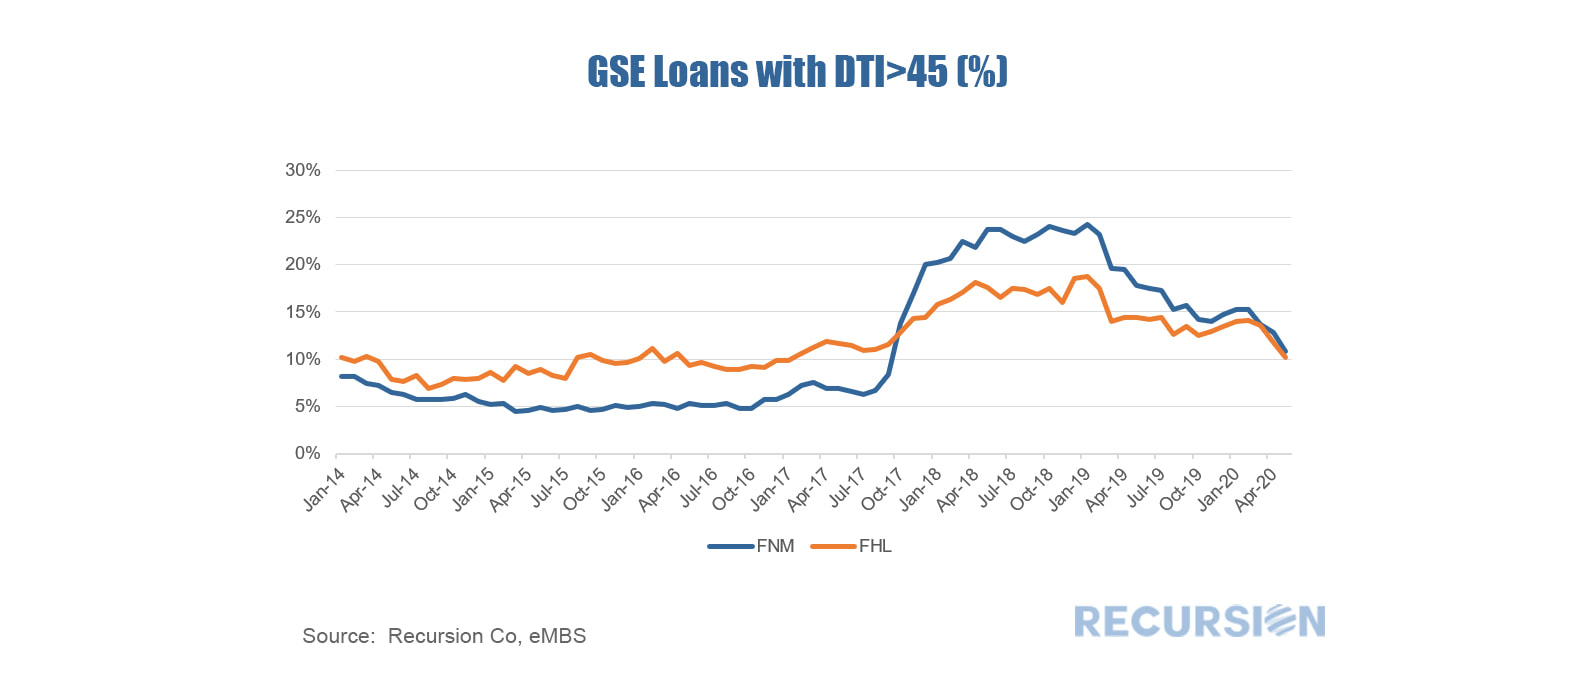 It seems natural to ask if this pattern spills over to the loans in the STACR pools. The chart below shows the share of such loans in high-LTV STACR issues since 2013, plotted against the 30-day May DQ rate for each.
|
Archives
February 2024
Tags
All
|
 RSS Feed
RECURSION |
|

Copyright © 2022 Recursion, Co. All rights reserved.