|
The recent release of pool-level buydown data led us to write a note contrasting the use of this product across Agencies, including Ginnie Mae[1]. In the process of writing this, we discovered that FHA, unlike the GSEs, also provides loan-level data for buydowns. This allowed us to run an analysis showing loan performance as measured by EPDs was better for FHA loans with buydowns than without, reflecting increased lender caution in using buydowns, which, on average, had higher credit scores than those without. The availability of loan-level data for FHA on this topic provides us with an opportunity to conduct an additional informative analysis specific to this program, which we document here. To start, let’s look at the share of the market with buydowns: 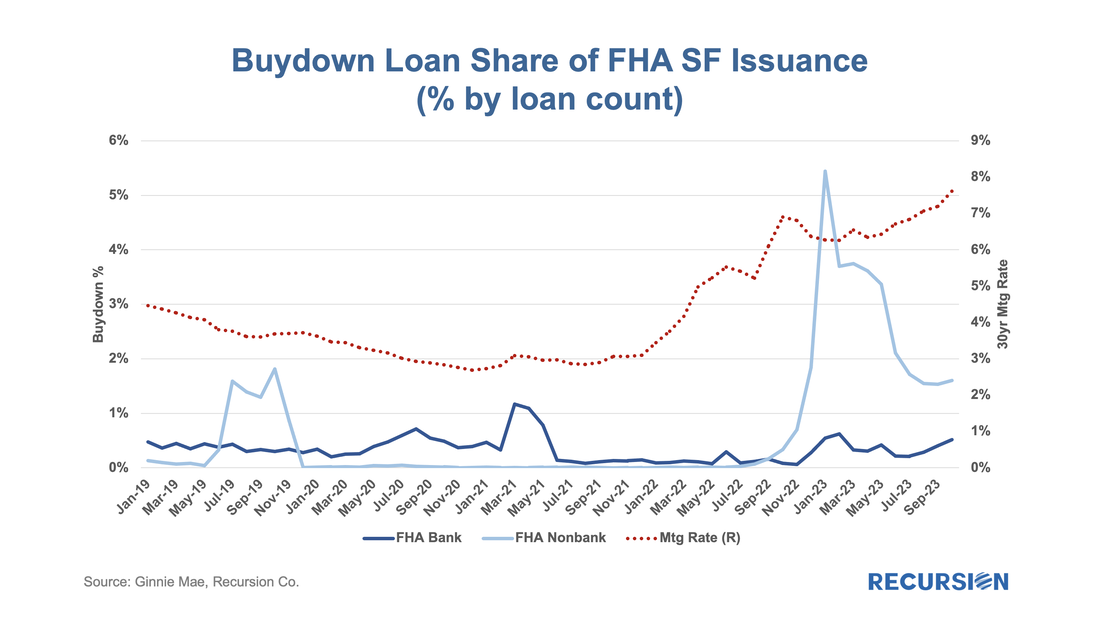 ......  ......  ......  To read the full article, please send an email to [email protected] As we head into the end of summer, we note that the housing market remains locked into “Mortgage Winter”. Refinance activities are muted as mortgage rates are at a 22-year high. Even purchase mortgage applications are at the lowest level seen since 1995 as homeowners are not willing to give up their mortgages at historical low rates. It’s not hard to imagine that in such a world we will see new behaviors as mortgage lenders struggle to remain viable. PennyMac stood out as one of the more creative lenders that was able to refinance the mortgages it services, indicated by the following chart: 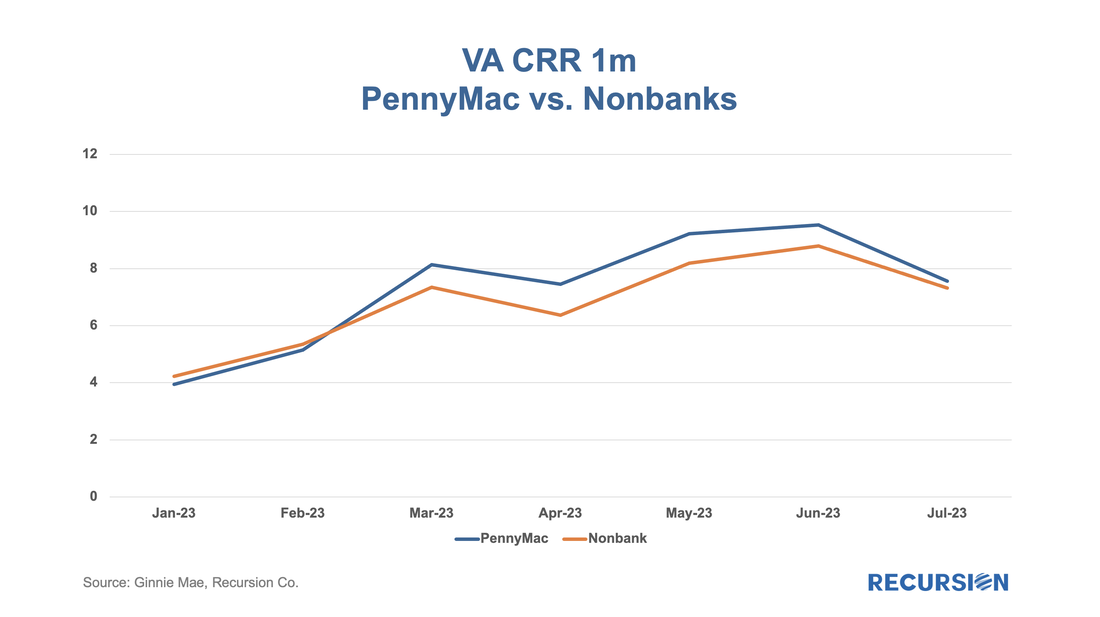 To read the full article, please send an email to [email protected]
Rising inflation and 30-year mortgage rates near 20-year highs of around 7%, coupled with historically high house prices, have sharply dampened housing demand in the US. This is particularly true for lower-income borrowers where household budgets are badly stretched. These developments have caught the attention of policymakers, who, in response, have taken it upon themselves to lower mortgage fees to partially compensate for these factors. This is an interesting moment in the formation of housing policy as we have two sets of changes taking effect close together in time. First, FHA announced on February 22, 2023, that it would cut its mortgage insurance premiums by 0.30% to 0.55% effective March 20. More recently, on March 22, GSEs implemented a rather complex set of changes in their upfront fee schedules, effective May 1: 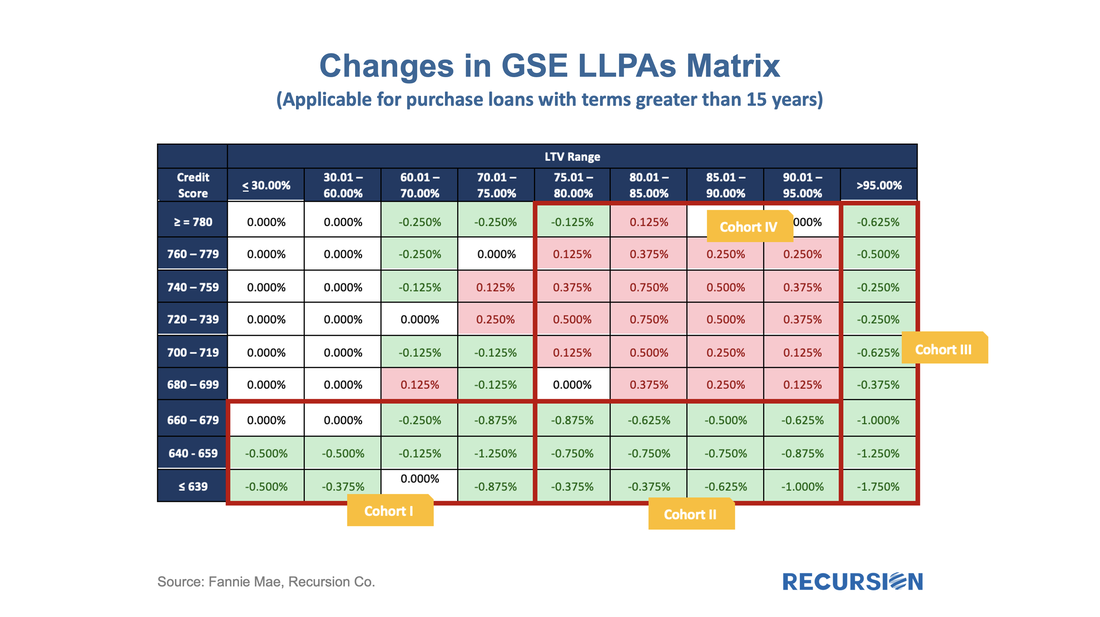 To read the full article, please send an email to [email protected]
In a previous note, we looked at mortgage trends derived from the recent release of 2022 HMDA data[1]. Of course, HMDA is a prime data source for analysts and policymakers who seek to understand how social and economic trends interact. The most discussed issue is the distribution of originations by race. Below find a bar chart for the share of originations by race annually from 2004-2022 by loan count:
With all eyes on the turmoil in the banking sector, it’s good to see that policymakers continue to innovate to help borrowers. Earlier this month, HUD published Mortgagee Letter 2023-06 “Establishment of the 40-Year Loan Modification Loss Mitigation Option”, which establishes the 40-year standalone Loan Modification into FHA’s COVID-19 Loss Mitigation policies[1]. The standalone 40-yr mod is scheduled to be implemented by May 8. This follows the establishment of a 40-yr modification with a partial claim in April 2022[2]. The introduction of standalone 40-yr mods reminded us that we haven’t focused on the progress of the 40-year mod with a partial claim identified by pool prefix “ET”. Below find a chart of issuance by program:
As policy interest rates continue to rise and economic activity begins to slow, attention in the mortgage market shifts towards concerns about the potential for borrower distress. We are early in this process as the labor market continues to add jobs, and there continue to be more job openings than people looking for work. Nonetheless, signs of strain begin to be seen, and it's worthwhile to point out early trends and consider implications. Notably, the impact of Hurricane Ian could be seen in the short-term delinquency data: 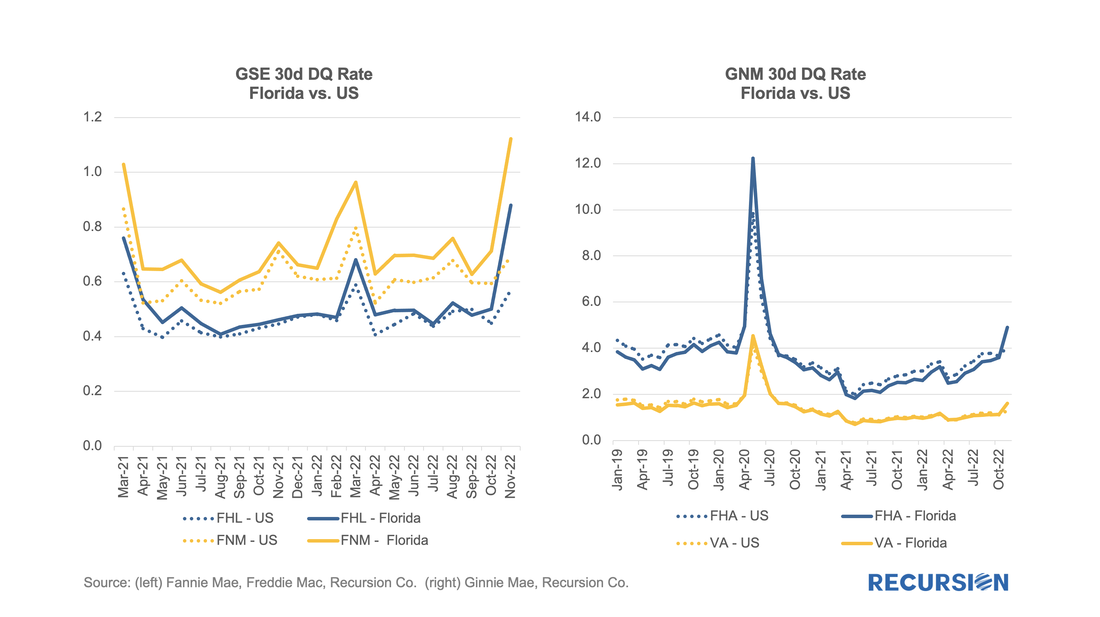 In previous posts, we discussed the trends in Ginnie Mae MBS issuance by loan purpose.[1] Recall that the decision to buy a loan out of a Ginnie pool rests with the servicer. As such, this decision is dependent in part on environmental factors that impact the profitability of this action, notably the interest rate. As loans get bought out at par, there is a greater incentive to purchase loans out of pools and get them into reperforming status when rates are low than when they are high. This relationship can be clearly seen in the following graphs: 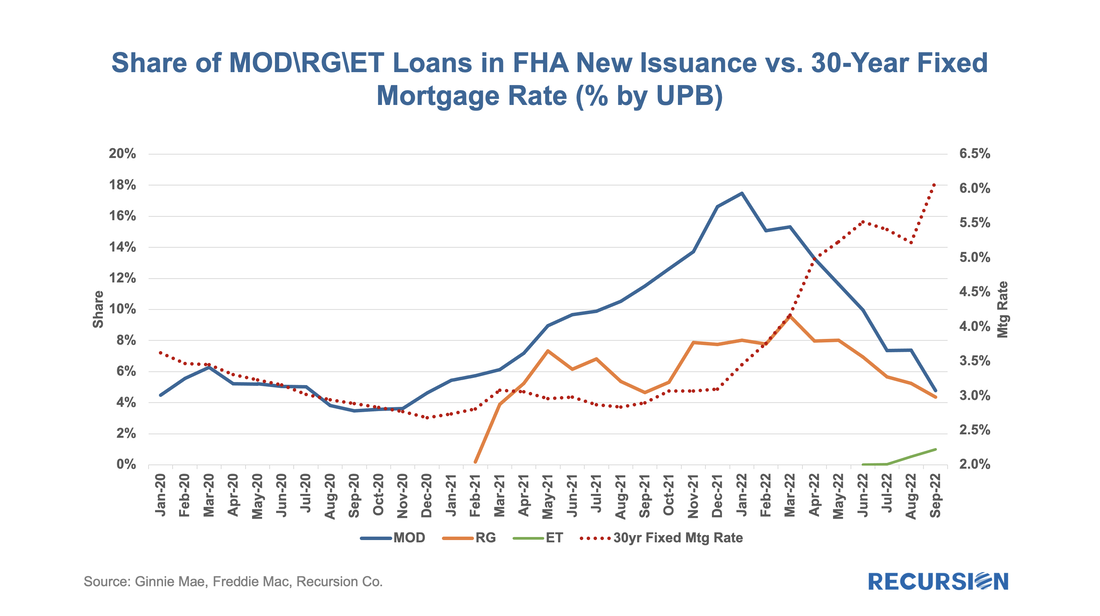 In a recent post, we discussed the utility of the FHA Performance dataset in tracking borrower stress in the housing market[1]. Here we look at other interesting market perspectives that can be obtained from this release. First, we look at property type. This breakdown is not available in the GNM loan-level disclosures, so this is a new view. Here we have 30-day DQ rates broken down over five categories: 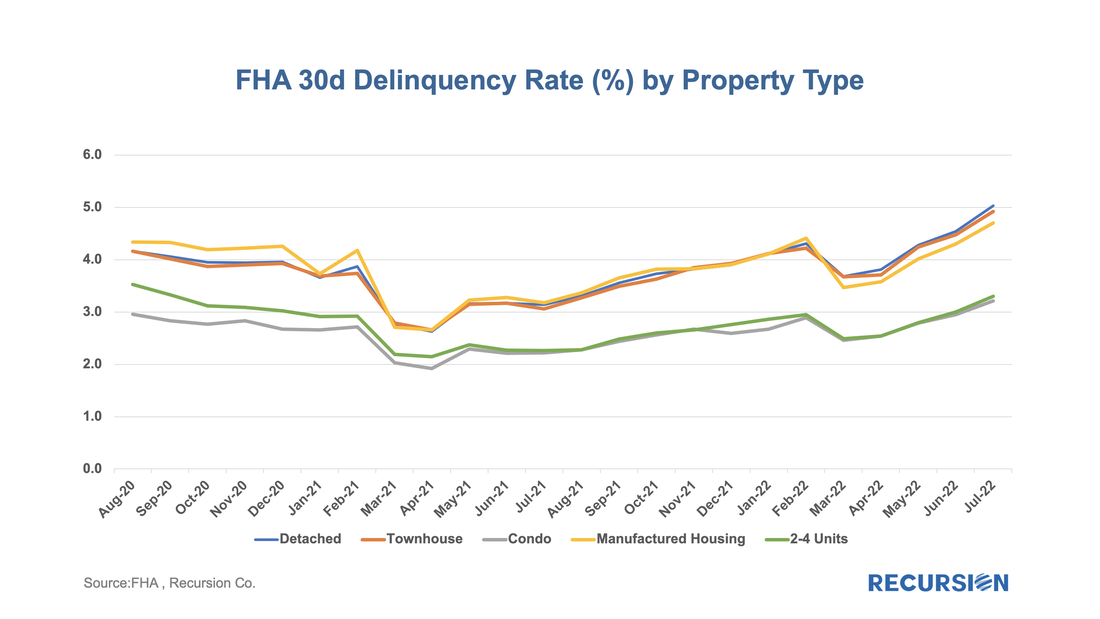 |
Archives
July 2024
Tags
All
|
 RSS Feed
RECURSION |
|

Copyright © 2022 Recursion, Co. All rights reserved.