|
In a recent post[1], we discussed findings obtained with the recent release of 2021 HMDA data. Among other things, we looked at the share of mortgage originations by income group and product type. In this note, we look at the difference in lending patterns between the banks and nonbanks. The incentive behind this approach is policy driven. There is a long history of measures taken to encourage lenders and builders to foster economic development in low-income areas via the housing market. For example, the Community Reinvestment Act (CRA) stipulates that a bank’s performance with regards to compliance of their regulatory requirements depends in part on: “the geographic distribution of loans—that is, the proportion of the bank's total loans made within its assessment area; how these loans are distributed among low-, moderate-, middle-, and upper income locations[2]” To assess this issue, we assign a flag to each of the census tracts designated by HUD as having a greater than 51% share of households with incomes in the Low-to-Moderate (LMI) range in the larger MSA the tract is part of[3], which are called LMI area by HUD, or “low income” tracts by FHFA. Below find a chart of the 10-year trend in the share of loans originated in this category by institution type for conventional and FHA loans: 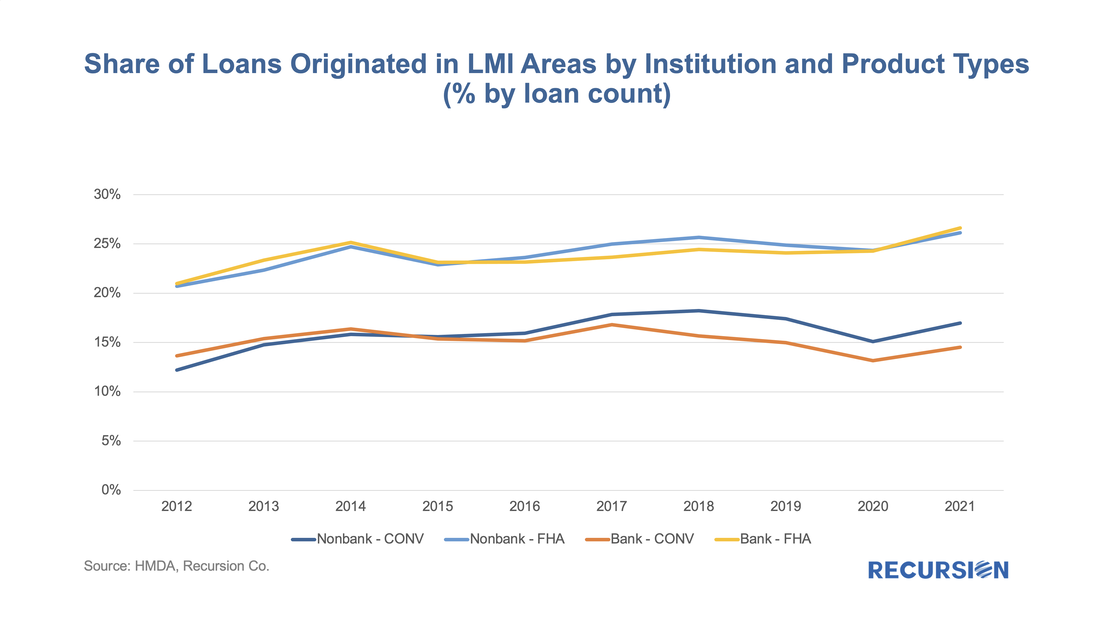 In a recent post[1], we discussed the disposition of loans that are exiting forbearance programs. In the Ginnie Mae programs, many loans bought out of pools have received modifications or other workouts, and then redelivered to Ginnie Mae pools. However, we have historically observed that there are more loans bought out than re-delivered, even considering the time needed for the workout. As it turns out, there are other market-based outlets for these loans, which is more evident at the issuer level than in aggregate. Below find a chart of buyout and securitization activities within Ginnie Mae program for Lakeview, the third-largest Ginnie Mae servicer as of April 2022. 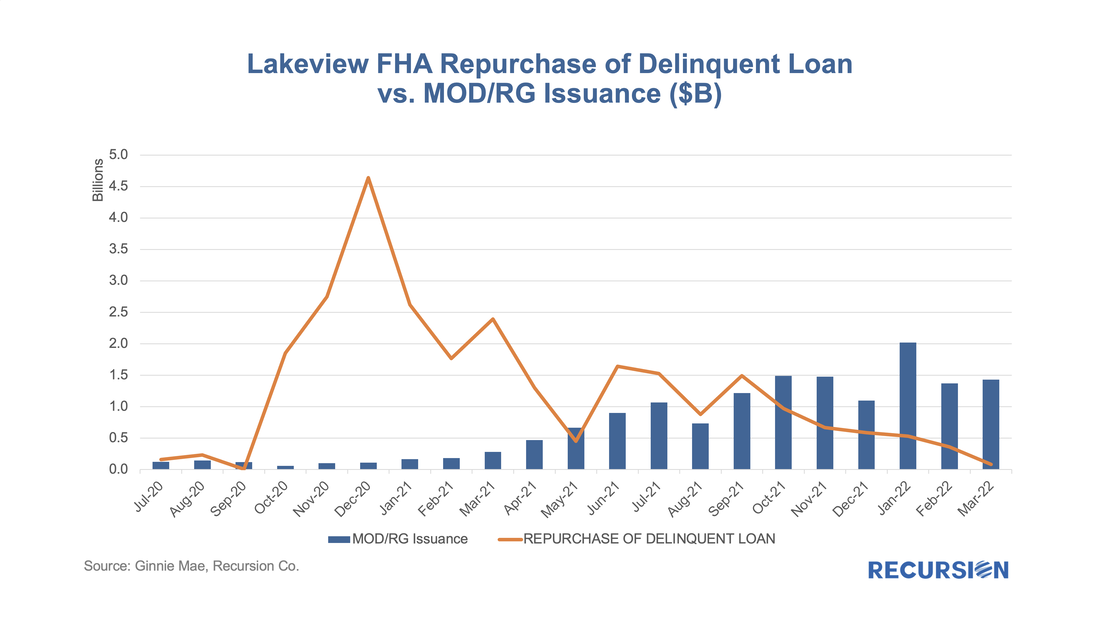 With the expiration of forbearance programs underway, there is an interesting question about how loans exiting these programs will perform once they are resecuritized. For Ginnie Mae programs, these are either loans that exit forbearance with a partial claim or receive a permanent mod under the various waterfall options in the FHA or VA programs. In our previous blogs[1], we have noted MOD and RG loans are becoming a significant portion of loans delivered to newly issued Ginnie Mae pools. 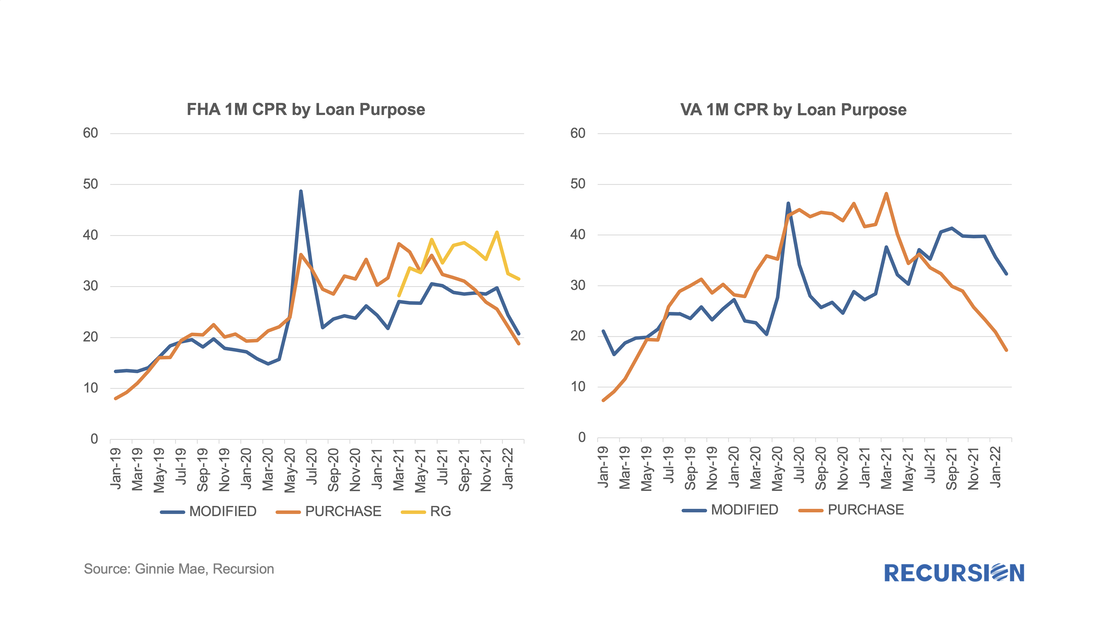 On February 15, 2022, Ginnie Mae announced it was adding a “Green Status” field to its multifamily disclosures, “giving investors information that supports their sustainable investing decisions and solutions.”[1] Specifically, “The new securities disclosure allows investors to easily identify multifamily mortgage-backed securities whose collateral meets the requirements of FHA’s Multifamily “Green” Environmental Product Programs. This will assist investors in acquiring suitable investments to meet their ESG mandates and improve the liquidity of the securities in the secondary trading to other ESG investors.” There are several broad observations that can be immediately taken from the new disclosure. First, Green loans tend to be larger than others. As of February 2022, over 12% of loans in Ginnie Mae multi-family pools by loan count contain the green flag, accounting for almost 28% of UPB. As a result, green loans stand about twice as big as those which do not fall in this category. The bulk of these units are market rate apartments meeting the Green building requirements or loans in the affordability categories accounting for less than 1% of both total outstanding loan count and UPB. 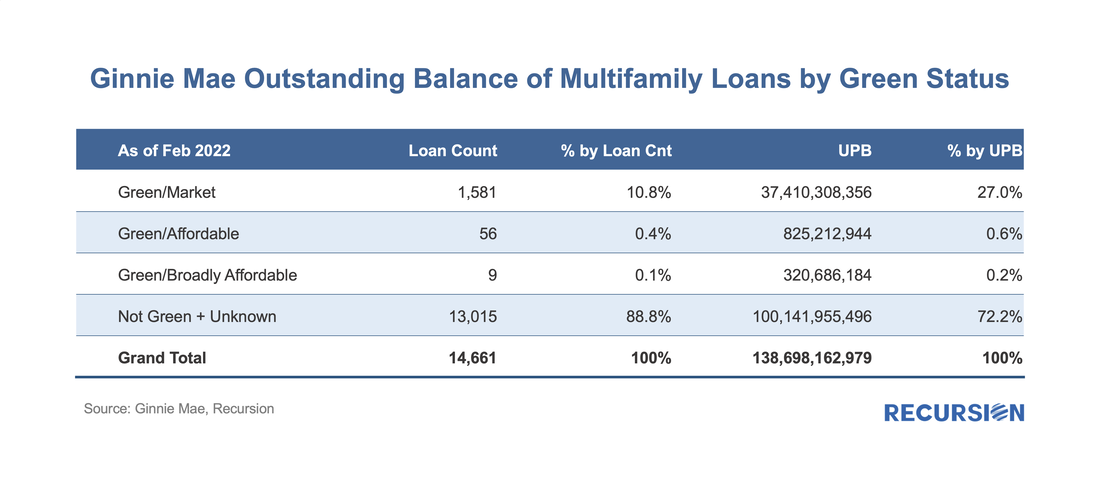 In a fine recent paper, the Federal Reserve Bank of Philadelphia “highlights the immediacy of the challenges facing mortgage servicers and policymakers” that arise from the resolution of mortgage forbearance and delinquencies[1]. As of the time of writing, the Philly Fed stated that “some 2.73 million mortgages are either in forbearance or past due; about 0.78 million of those are in Coronavirus Aid, Relief, and Economic Security (CARES) Act forbearance plans”. In addition, “about 47 percent of loans in forbearance will expire in the first quarter of 2022; another 42 percent will expire in the second quarter”. They go on to discuss recent trends and provide data on income and demographics of these borrowers.
The point of this brief article is to look at secondary market indicators to shed additional light on these issues. The note is broken into two parts, the first looks at Government programs, notably FHA and VA, while the second looks at the GSEs. Mortgage market analysis in 2022 is setting up to be very much focused on the impact of expiring forbearance programs. In this post, we look at the FHA program from this perspective. With the onset of the pandemic, FHA began to apply “Partial Claim”s, a seldom-used loss mitigation method to help its mortgage borrowers cope with financial difficulties stemming from the pandemic.[1] A Partial Claim is a no-interest junior claim consisting of missed P&I payments secured by the property that comes due when the first lien is extinguished. Ginnie Mae created a new pool type, the RG pool, mainly to take delivery of the loans received via a partial claim, after they successfully made six6 consecutive payments. Another FHA innovation is the availability of an automatic modification that allows borrowers exiting forbearance to have access to a program that reduces monthly payments by up to 25%[2] without impacting their credit. The result has been a sharp change in the composition of FHA loans delivered to Ginnie Mae program over the past year. 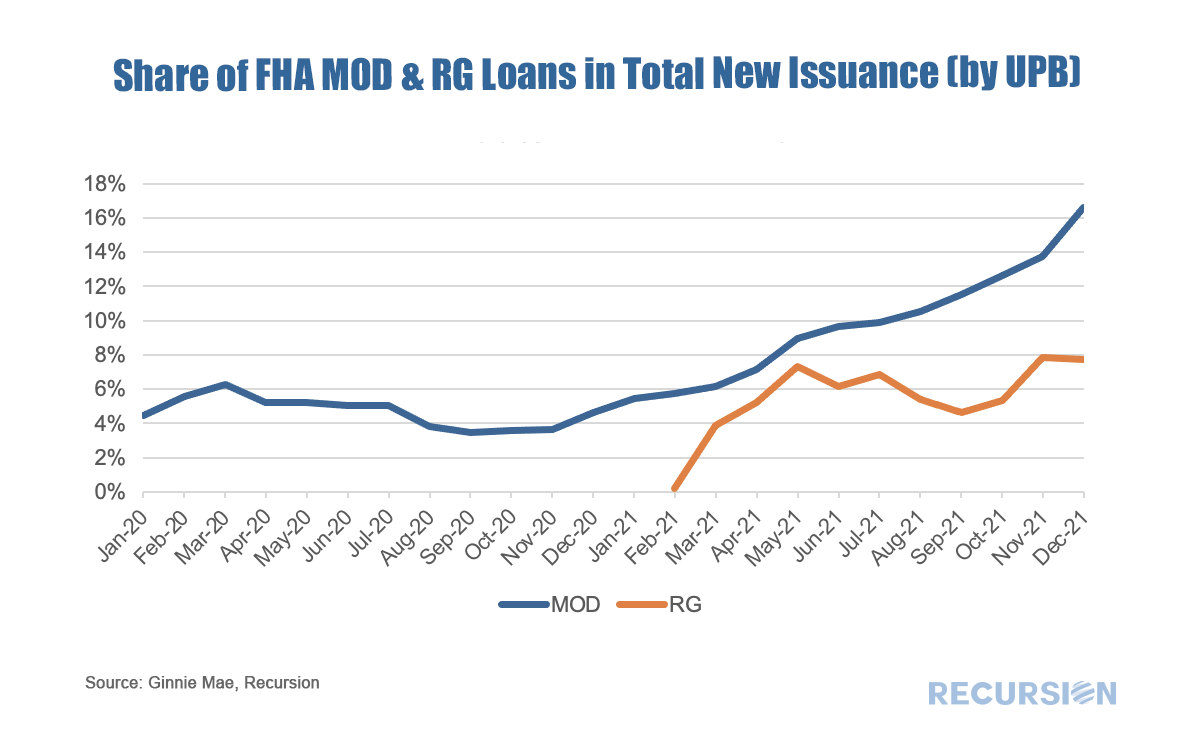 This changing composition will likely have a measurable impact on pool performance. In this regard, it’s interesting to look at the credit scores of borrowers across loan types. 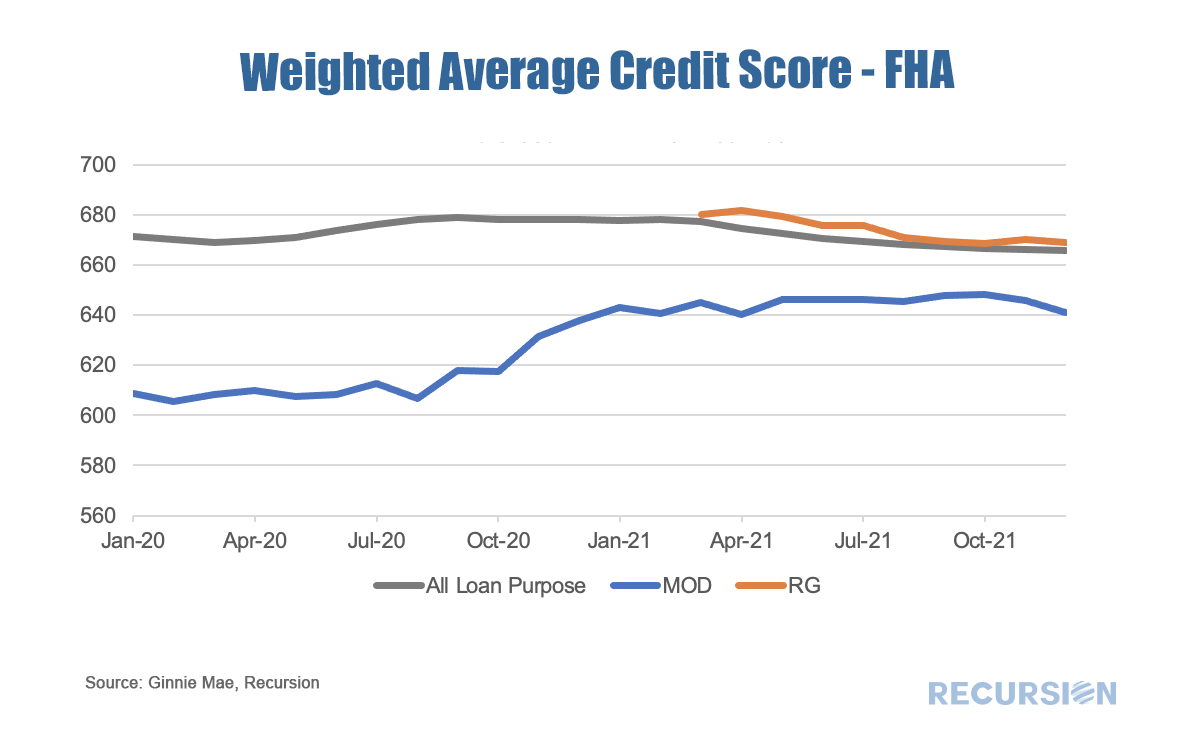 Original Credit scores for RG loans look very much like those in the overall pool. And while credit scores for modified loans remain below those overall, the gap has narrowed since the new waterfall was made available. As a result, we are once again in the situation where we can’t confidently extrapolate historical trends about the relationship of loan performance and economic factors like interest rates and unemployment as a basis for decision-making. Instead, it is the details in the policy changes designed to keep borrowers in their homes that provide the clearest view on market performance. Over the past six months, prepayment speeds of Ginnie Mae securities have notably widened against those of the GSEs. 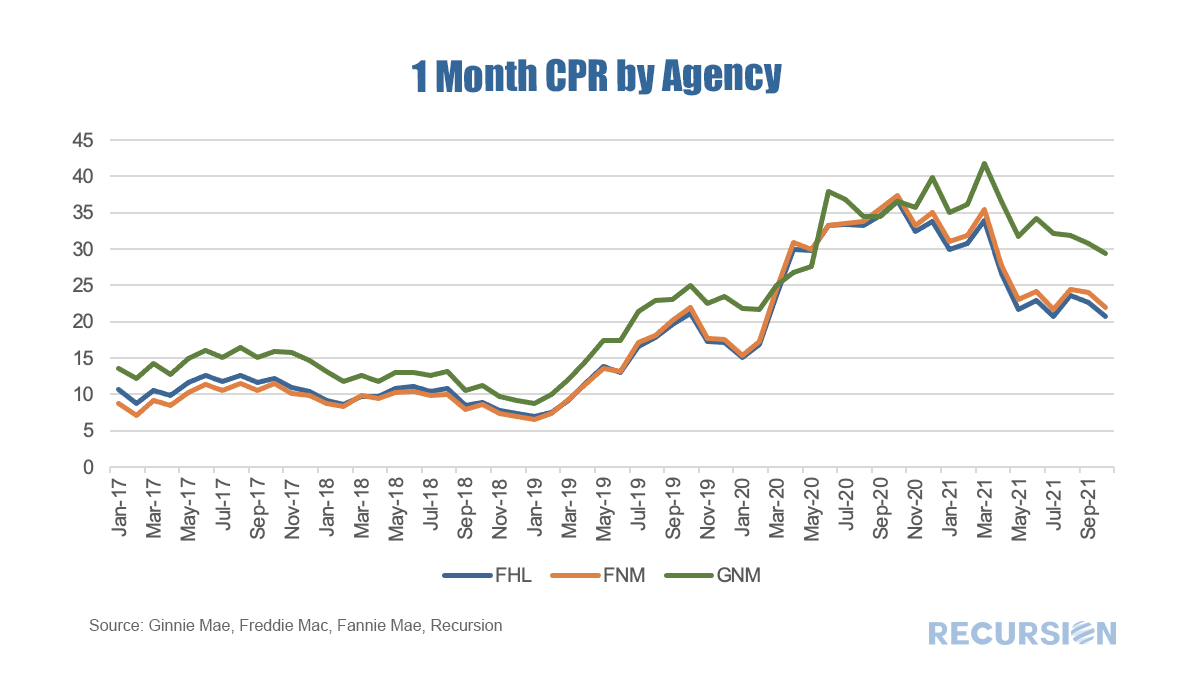 On Nov. 15, 2021, the U.S. Department of Housing and Urban Development (HUD) released its fiscal year 2021 report to Congress regarding the financial status of the Federal Housing Administration (FHA) Mutual Mortgage Insurance Fund. In the statement, HUD emphasized the critical role of FHA in the U.S. housing market and its mission of providing access to credit to expand first-time and low-and-moderate-income homeownership. Recursion data was cited several times in the report, notably with regards to first-time homeownership, the share of loans originated under $70K, and the Agency share of total market output. Recursion is proud that HUD recognizes Recursion’s powerful analytic capabilities in supporting FHA’s “essential role in advancing homeownership”.  |
Archives
February 2024
Tags
All
|
 RSS Feed
RECURSION |
|

Copyright © 2022 Recursion, Co. All rights reserved.