|
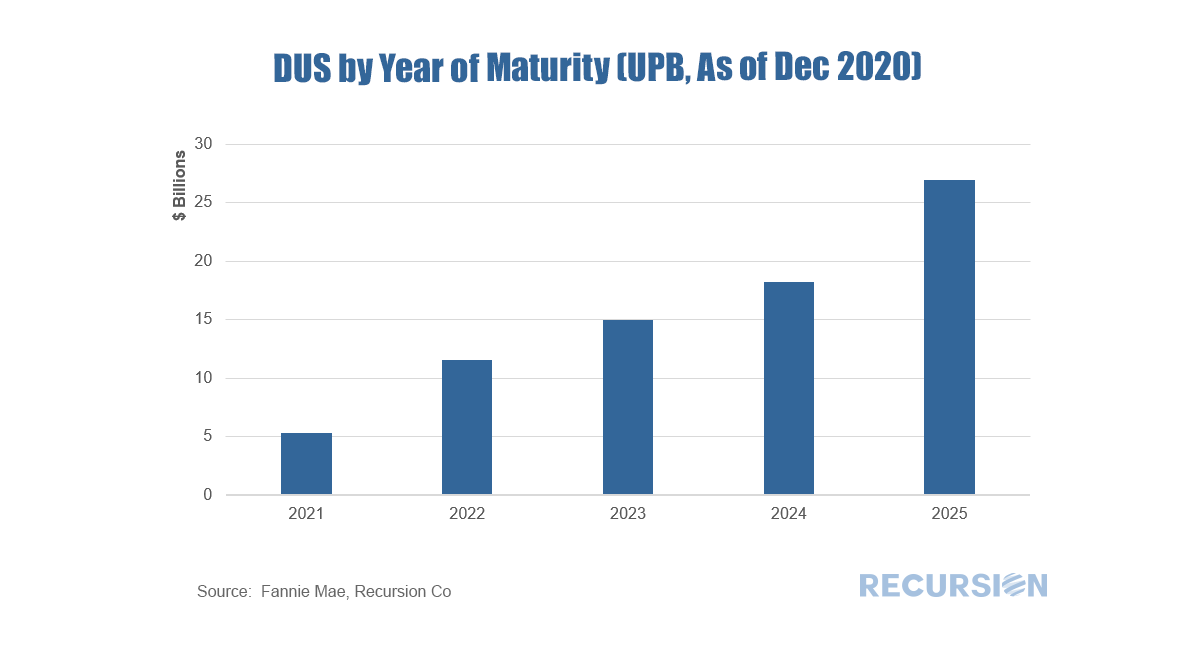
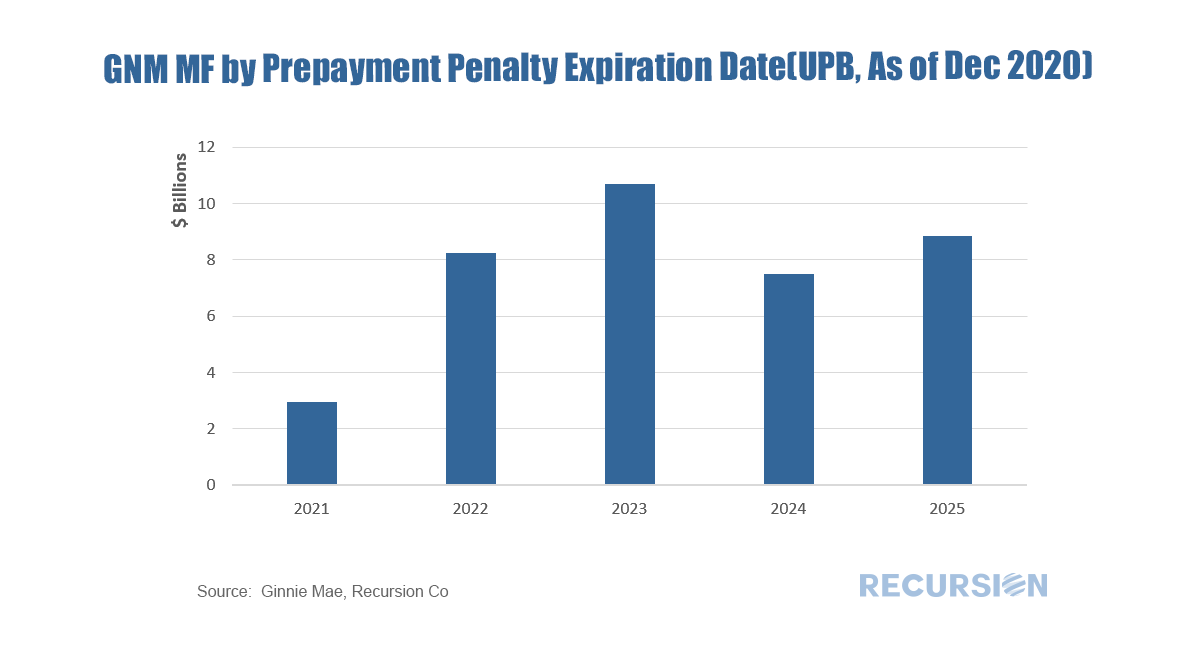
We’ve written previously that the multifamily market will be of growing interest during the course of 2021[1]. During the Global Financial Crisis, the single-family market was ravaged by foreclosures resulting from the popping of the housing bubble. The large number of households losing their homes became renters to a large degree. This time is different. Renters are fleeing congested urban areas and are buying homes in areas with more space, serving to push up house prices while rents are under downward pressure. According to the Elliman Report, the rental vacancy rate for Manhattan in November 2020 was 6.1%, compared to 1.8% a year earlier.[2] This figure will of course vary considerably from place to place. The potential for more vacancies remains once the various Federal and Local Covid-19 bans on evictions are allowed to expire. According to Trepp, the national 30+ day delinquency rate for multifamily loans in December 2020 was 2.75%, up modestly from 2.00% a year earlier[3]. The role of the Agencies in the multifamily debt market is significant, but less than the overwhelming presence seen in the single-family market[4]. Data disclosed by the agencies provides a wealth of information about the rental market but did not receive widespread attention until recently. In this post, we discuss trends in multifamily loan maturity schedule and prepayment penalty schedule. This data is of interest because unlike the single-family market, there are fewer apartment loans, but they are generally quite large. Maturities can clump, leading to periods of time when capital demands can push borrowing costs higher. On the other hand, opportunities for lenders arise when loans mature or exit the prepayment penalty window. With respect to prepayments, commercial mortgages typically come with clauses defining early payment penalties. For example, Fannie Mae Delegated Underwriting and Servicing (DUS) loans are typically 10 YR balloon loans with the prepayment penalty period matching the loan term. For Ginnie Mae Multi-Family loans, terms are typically much longer (30-40 years), while the prepayment penalty following a schedule which generally expires in 10 years. Below find two annual charts, one on year of maturity for the Fannie Mae DUS program, and the other on volumes of loans exiting the prepayment penalty window in Ginnie Mae programs. The distinction between the prepayment penalty expiration date and the maturity date is significant insofar as they bracket the dates when loans can refinance without being penalized economically, and they have to be paid off, usually by a refinance or triggering a default event (maturity date). When new capital is drawn in depends on the coupon of the debt rolling off and the spectrum of rates available in the market when it does. From a strategic point of view, the loan-level data provides the address of properties and so market participants can use this information for strategic and marketing opportunities. Please contact us if you would like more information. [1] https://www.recursionco.com/blog/the-multifamily-market-pandemic-and-policy
[2] https://www.elliman.com/resources/siteresources/commonresources/static%20pages/images/corporate-resources/q3_2020/rental11_2020.pdf [3] https://www.trepp.com/hubfs/Trepp%20December%202020%20Delinquency%20Report.pdf [4] https://www.recursionco.com/blog/big-data-and-the-multifamily-market |
Archives
July 2024
Tags
All
|
RECURSION |
|
Copyright © 2022 Recursion, Co. All rights reserved.


 RSS Feed
