|
With interest rates significantly higher than those in place at the start of the year, it’s natural that potential homebuyers look for ways to reduce borrowing costs. One of these ways is through an adjustable-rate mortgage (ARM). Now that we have complete data for July, it is a timely moment to look at recent trends in ARM issuance. As we approach the topic, it’s important to note a few institutional points. First, the ARM programs available to conventional and Government borrowers are distinct, so we break the issuance down between GSE and Ginnie pools. Second, the market underwent a significant shift with the elimination of LIBOR as a benchmark[1]. Let’s start with the conforming market. There are several product types, but in July 2022, the largest is 7-year ARMs, followed by 5-year and 10-year ARMs: 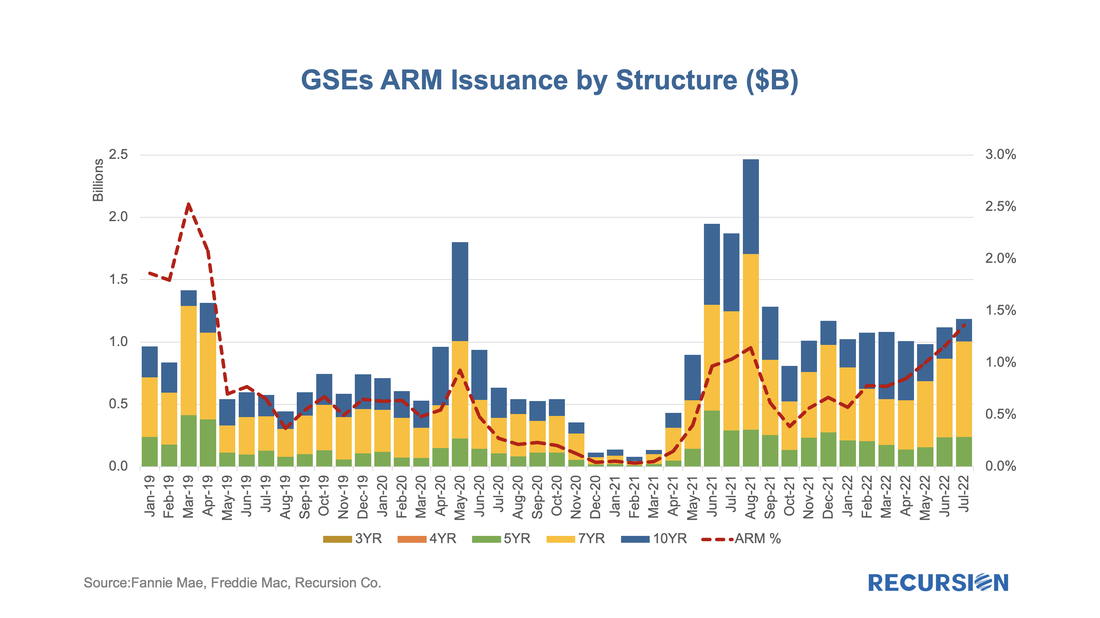 The share of ARMs of total issuance rose from 0.4% in October 2021 to 1.4% last month. For Ginnie programs, the main product is the 5-year ARM: 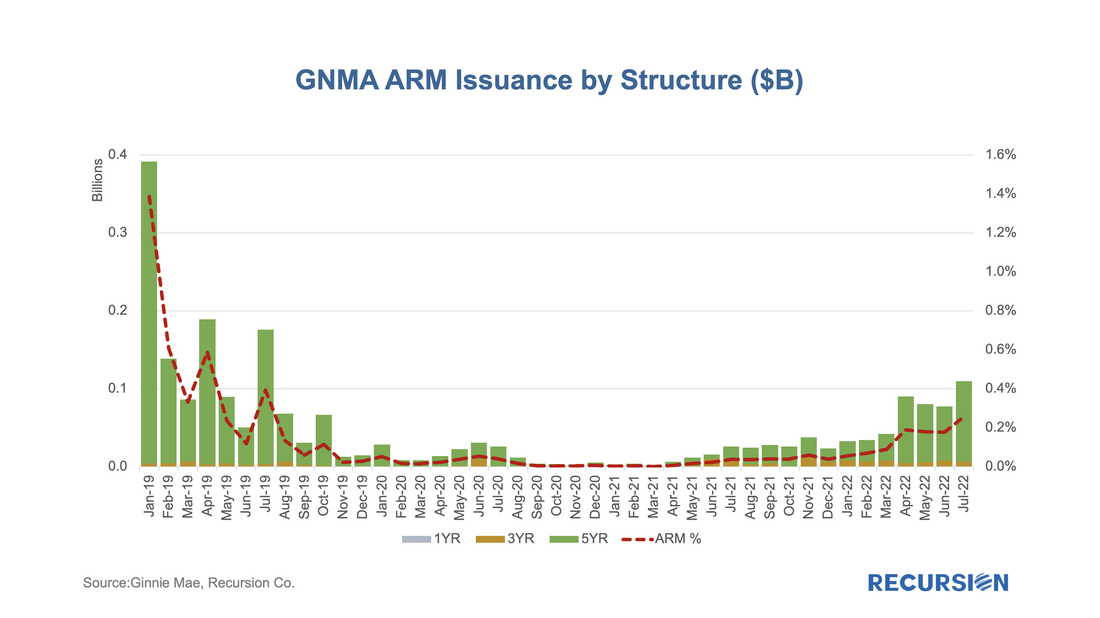 In this case, the ARM share of total issuance stood at 0.3% in July 2022, up from close to zero in early 2021. Note that GNM HECM mortgages are mainly ARM products. We will have separate discussions on HECM in future blogs. There are a couple of points that can be drawn from this chart. First, the ARM share remains well below that experienced in 2019 despite the fact that mortgage rates are near 12-year highs and that the spread between 30-yr fixed mortgage rate and 5-yr floating rate was recently as wide as 1.25%: 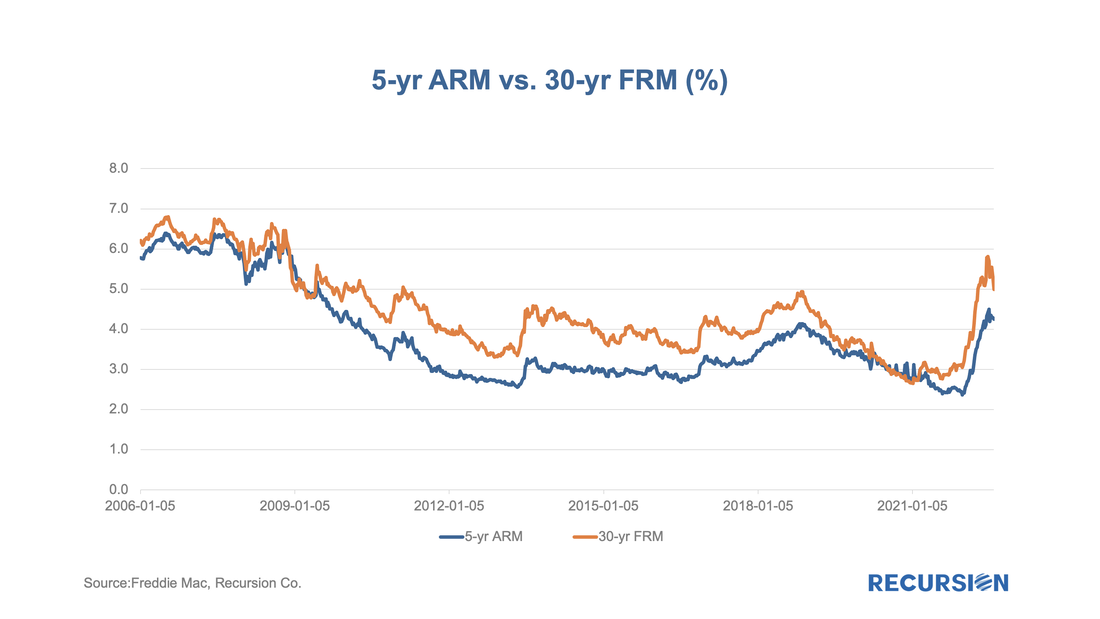 It’s possible that banks look less favorably on ARMs than they did three years ago. It may also be the case that SOFR-based ARMs are not as popular with consumers as LIBOR-based products used to be[2]. Second, according to the Mortgage Bankers Association, the ARM share of applications during the week ending July 29, 2022, was 8.4%, well above the figures reported here[3]. A number of possible explanations for this discrepancy come to mind:
While the sample size is not very large, it is useful to look at the characteristics of adjustable vs. fixed-rate loans. First, we start with the distribution of the ARM share of purchase loans by loan size: 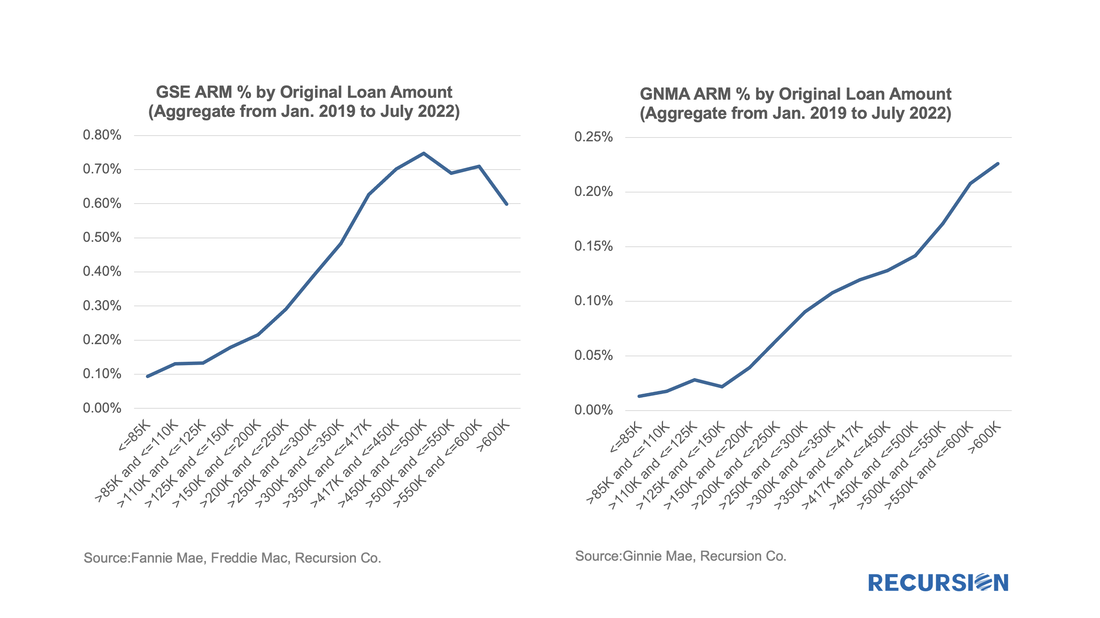 For both product types, the ARM share is highest in the larger loan size buckets. There is also the question of credit characteristics between floating and fixed rate borrowers. There are many ways of looking at this. Below find a chart looking at the share of floating rate loans broken into two categories, credit scores less than 680 and those greater to or equal to 680: 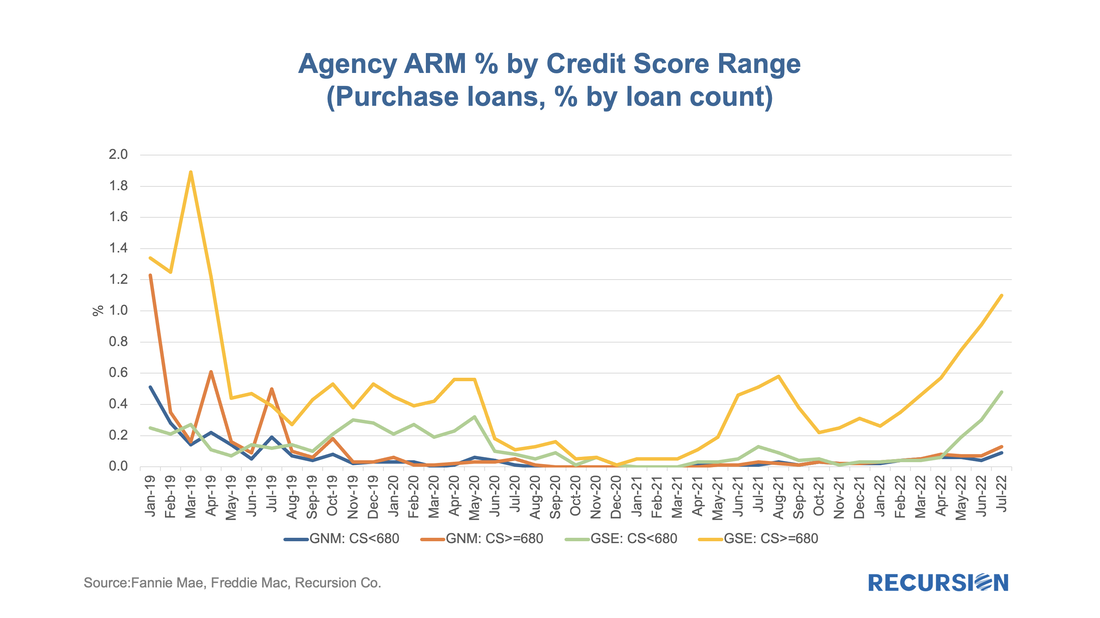 For Ginnie Mae loans, the distinction is small, but for conforming loans, the higher credit score borrowers tend to dominate. This leads to a conclusion that lenders prefer to provide floating rate credit to better-off borrowers with high credit scores. To summarize, the floating/fixed share depends on a complex mix of policy and behavioral factors. Observing the evolution of this mix as interest rates rise will lead to further insights. We note, however, that according to Freddie Mac, the 30-year fixed mortgage rate in the week of August 4 came in at 4.99%, down 0.82% in the last six weeks, which would add further complexity to the market dynamics we observe. [1] The GSE’s stopped receiving LIBOR-based ARMS on December 31, 2020. See LIBOR Transition | Federal Housing Finance Agency (fhfa.gov). Ginnie Mae stopped allowing such loans in their pools on January 1, 2021. See Microsoft Word - PUBL Ch. 26 21.07.28.docx (ginniemae.gov) [2] Libor benchmarks have both credit risk and curve risk while SOFR benchmarks have neither being an overnight sovereign rate. [3] Mortgage Applications Increase in Latest MBA Weekly Survey | MBA Recursion is a preeminent provider of data and analytics in the mortgage industry. Please contact us if you have any questions about the underlying data referenced in this article. |
Archives
July 2024
Tags
All
|
 RSS Feed
RECURSION |
|

Copyright © 2022 Recursion, Co. All rights reserved.