• HOME
  • solutions
    • RECURSION ANALYZERS
    • Mortgage Company Data
    • Recursion DataCloud
    • Customized Solutions
  • BLOG
  • CLIENT LOGIN
    • Recursion Analyzers
  • ABOUT US
    • OVERVIEW
    • OUR TEAM
    • News & Events >
      • Recursion In News
      • Recursion Data Citations
  • CONTACT
RECURSION CO
  • HOME
  • solutions
    • RECURSION ANALYZERS
    • Mortgage Company Data
    • Recursion DataCloud
    • Customized Solutions
  • BLOG
  • CLIENT LOGIN
    • Recursion Analyzers
  • ABOUT US
    • OVERVIEW
    • OUR TEAM
    • News & Events >
      • Recursion In News
      • Recursion Data Citations
  • CONTACT
BLOG

Appraisal Waivers and LMI Areas

7/21/2021

 
The matched dataset continues to pay dividends (sorry no buy-backs). This time we take a look at appraisal waivers. The very straightforward question based on the new data is to ask if there are differences in the rate of PIW take-up among eligible loans between areas with a higher share of low to moderate income people and those with a lower share. Our breakpoint is areas with LMI>=51(Low-or Moderate-Income Areas) and LMI<51 (Not Low-or Moderate-Income Areas), and we look here at just purchase loans.
​
Before we begin, as this query is focused entirely on GSE loans, we felt it necessary to put the bots into overdrive to improve the match rate between HMDA and the GSE loan tapes and for those keeping track the updated match rate is:
Picture
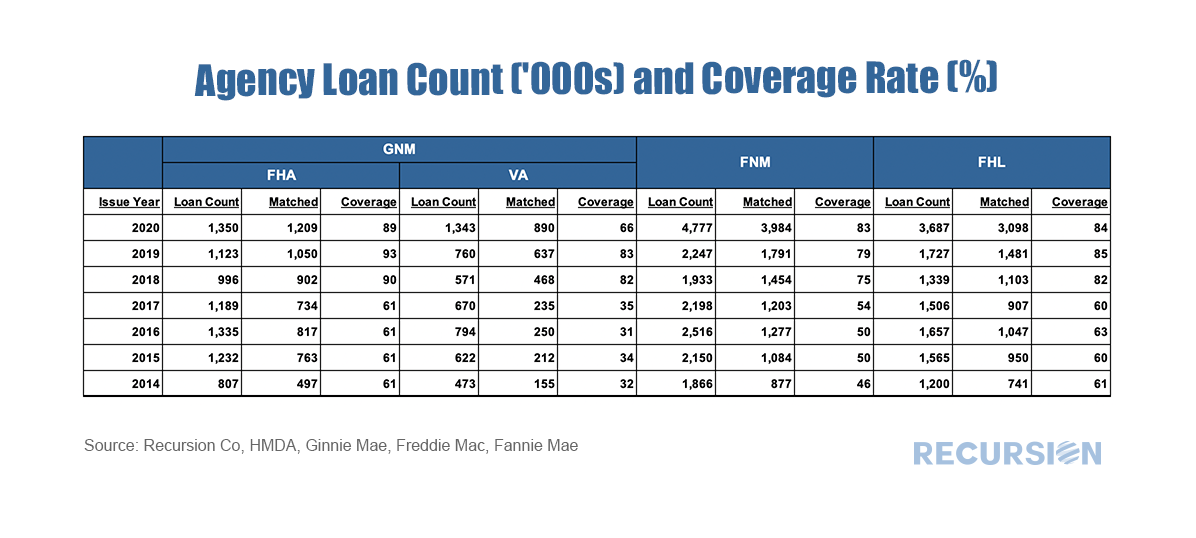
With the following results:
Picture
Run Underlying Query
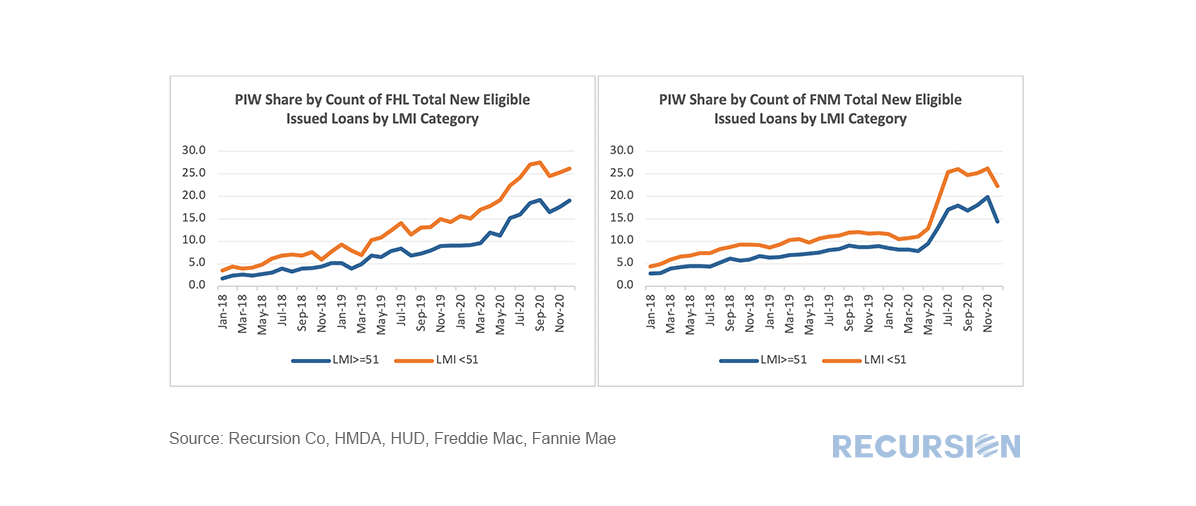
It seems so. For both Fannie Mae and Freddie Mac, lenders use waivers for property valuations in areas with less than 51% LMI individuals at a higher rate than for those greater to or less than that share. Of course, much more investigation is necessary before ascribing this distinction to any particular driving factor.
​
So, the number of paths forward here are about endless, but a natural extension is to ask if there is a distinction between bank and nonbank sellers. Below we look at this for the lower (LMI>=51) areas:
Picture
Run Underlying Query
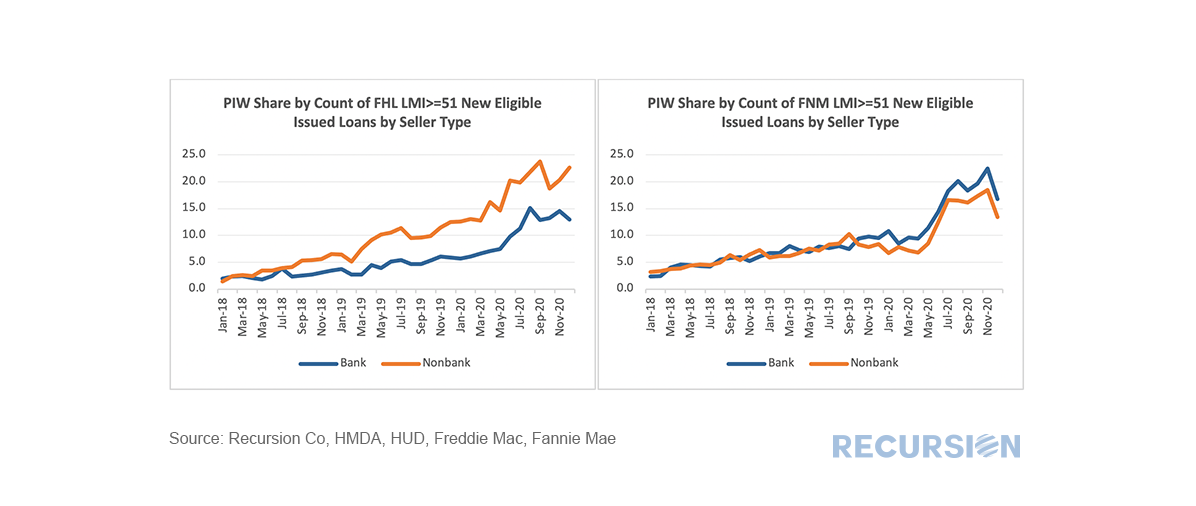
​The answer here is, sometimes. Nonbank sellers use PIW’s in lower income areas at a greater rate than banks for loans delivered to Freddie Mac, while they are much closer together for those delivered to Fannie Mae. In fact, recently banks have been modestly exceeding nonbanks in this regard for loans delivered to Fannie Mae. This is something of a surprise. Once again, there are countless possibilities to examine, but one path is to look at the same results for individual large lenders:

Nonbanks:
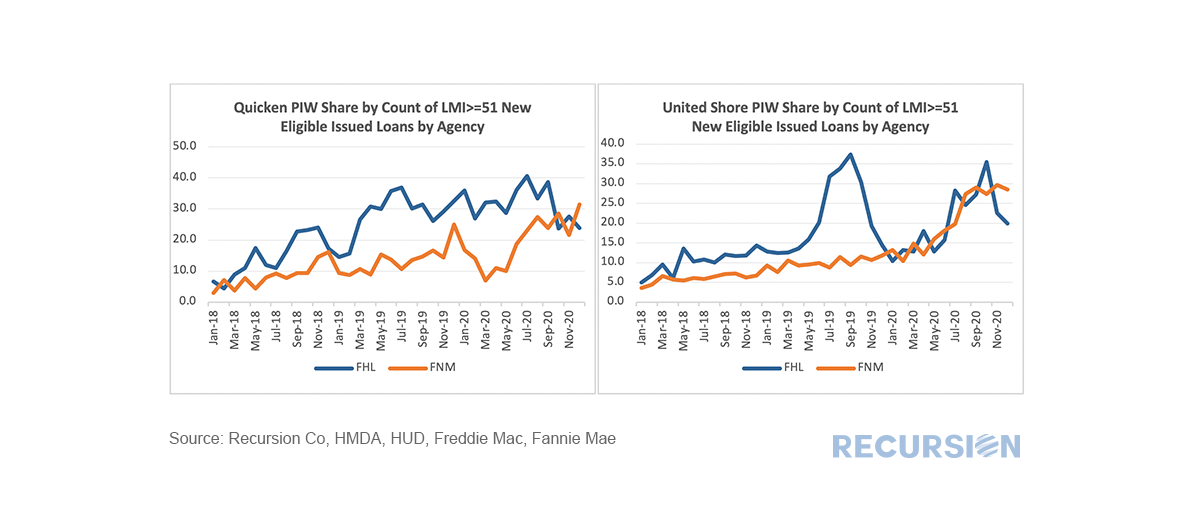
Picture
Run Underlying Query
​Banks:
Picture
Run Underlying Query
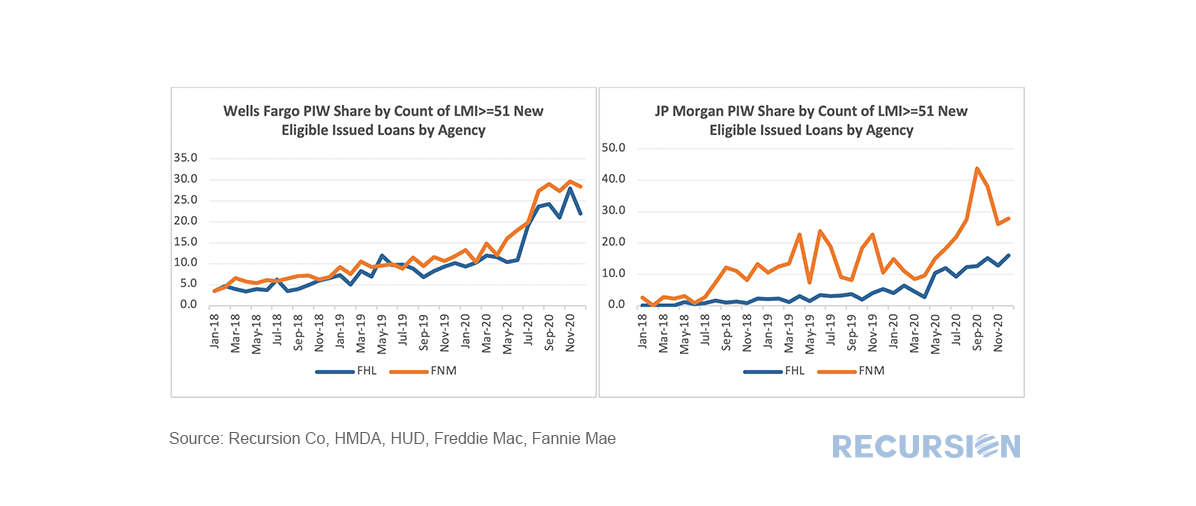
This is somewhat noisy data but based on this rather small sample it seems that both individual firm strategies and the particular policies of the GSE’s play a role here[1].
In any case, as we have previously demonstrated that prepayment speeds vary between higher and lower income areas[2] these kinds of distinctions might prove useful in both the policy and investment arenas.

[1] For Freddie Mac, the Automated Collateral Evaluation ACE system guides appraisal decisions, https://sf.freddiemac.com/content/_assets/resources/pdf/requirements/ace.pdf
While for Fannie Mae it is the Collateral Underwriter (CU)
https://singlefamily.fanniemae.com/applications-technology/collateral-underwriter
[2]  https://www.recursionco.com/blog/insights-on-prepayment-speeds-from-the-matched-dataset

    Archives

    March 2023
    February 2023
    January 2023
    December 2022
    November 2022
    October 2022
    September 2022
    August 2022
    July 2022
    June 2022
    May 2022
    April 2022
    March 2022
    February 2022
    January 2022
    December 2021
    November 2021
    October 2021
    September 2021
    August 2021
    July 2021
    June 2021
    May 2021
    April 2021
    March 2021
    February 2021
    January 2021
    December 2020
    November 2020
    October 2020
    September 2020
    August 2020
    July 2020
    June 2020
    May 2020
    April 2020
    March 2020
    February 2020
    May 2019
    March 2019
    February 2019

    Tags

    All
    Affordability
    ARM
    Bank\Nonbank
    Borrower Assistant Plan
    Cash Window
    Climate Change
    CMBS
    CMO
    Conforming Loan
    Conventional Loan
    COVID 19
    CPR\CDR\CRR\CCR
    Credit Score\DTI\LTV
    CRT\CAS\STACR
    Delinquency
    Early Buyout
    Early Payment Default
    ESG
    ET Pools
    Fannie Mae
    Fed
    FHA
    FHFA
    Forbearance
    Foreclosure
    Foreign Investor
    Freddie Mac
    Ginnie Mae
    Green Loans
    HECM
    HELOC
    HMDA
    HUD
    LMI
    Manufactured Housing
    Modified Loans
    MSR
    Multifamily
    Occupancy Type\NOO
    Partial Claim
    Payoff
    PIW
    Prepayment
    Purchase Loans
    Recursion In News
    Refi Loans
    Reperforming
    RG Pools
    Rural Housing
    Single Family
    Special Eligibility Program
    TBA Market
    TIC
    TPO
    UMBS
    US Treasury
    VA

RECURSION

SOLUTIONS ​
Recursion Analyzers
​
Mortgage Company Data
Recursion DataCloud
Customized Solutions


ABOUT US  ​
Overview
​Our team
CLIENT LOGIN   ​
Recursion Analyzers

CONTACT

224 West 30th St., Suite 303, New York, NY 10001
Contact Us

Picture
Copyright © 2022 Recursion, Co. All rights reserved.​
  • HOME
  • solutions
    • RECURSION ANALYZERS
    • Mortgage Company Data
    • Recursion DataCloud
    • Customized Solutions
  • BLOG
  • CLIENT LOGIN
    • Recursion Analyzers
  • ABOUT US
    • OVERVIEW
    • OUR TEAM
    • News & Events >
      • Recursion In News
      • Recursion Data Citations
  • CONTACT