• HOME
  • solutions
    • RECURSION ANALYZERS
    • Mortgage Company Data
    • Recursion DataCloud
    • Customized Solutions
  • BLOG
  • CLIENT LOGIN
    • Recursion Analyzers
  • ABOUT US
    • OVERVIEW
    • OUR TEAM
    • News & Events >
      • Recursion In News
      • Recursion Data Citations
  • CONTACT
RECURSION CO
  • HOME
  • solutions
    • RECURSION ANALYZERS
    • Mortgage Company Data
    • Recursion DataCloud
    • Customized Solutions
  • BLOG
  • CLIENT LOGIN
    • Recursion Analyzers
  • ABOUT US
    • OVERVIEW
    • OUR TEAM
    • News & Events >
      • Recursion In News
      • Recursion Data Citations
  • CONTACT
BLOG

Insights on Prepayment Speeds from the Matched Dataset

7/16/2021

 
​Our proprietary matching algorithm continues to chug along and our match rates between the Agency loan tapes and HMDA continue to improve. Here is an up-to-date summary table:
Picture
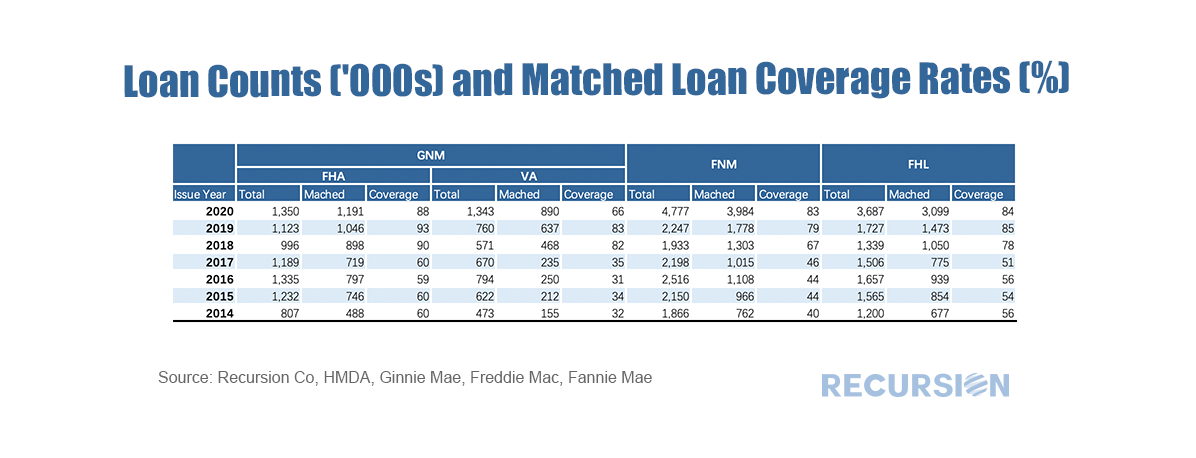
The improvement posted the last few years compared to the prior period is largely due to the broadening of reported characteristics in HMDA since 2018. There is room for improvement, particularly for the GSEs. Fortunately, the bots never stop.

So it’s time to dive into what this all means for prepayment speeds. Recall that the matched dataset provides a robust sample of millions of loans with the underwriting and performance statistics from the Agency loan tapes combined with the social and demographic data contained in HMDA. A key advancement is that HMDA reports down to the census tract level. This in turn allows us to integrate local Census data into our analysis[1].
​
A question that seems of broad interest is: are prepayment speeds slower in areas with a preponderance of low-income people? To look at this we tile the country into two segments, those areas with a majority of people with Low and Moderate Incomes (LMIs >=51%) and all other areas. We can then look at the difference in speeds between the two zones (the “gaps”) by coupon and origination year and program. In this case we look at the 1-month CPR for June 2021, first for the GSEs:
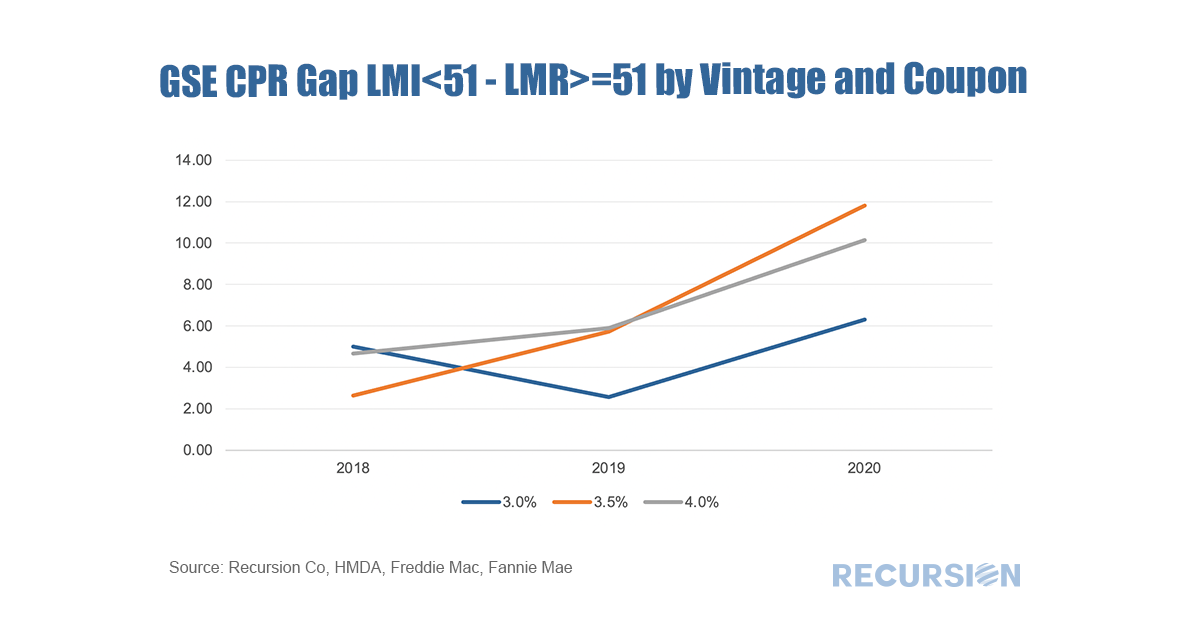
Picture
Run Underlying Query
​And then for FHA:
Picture
Run Underlying Query
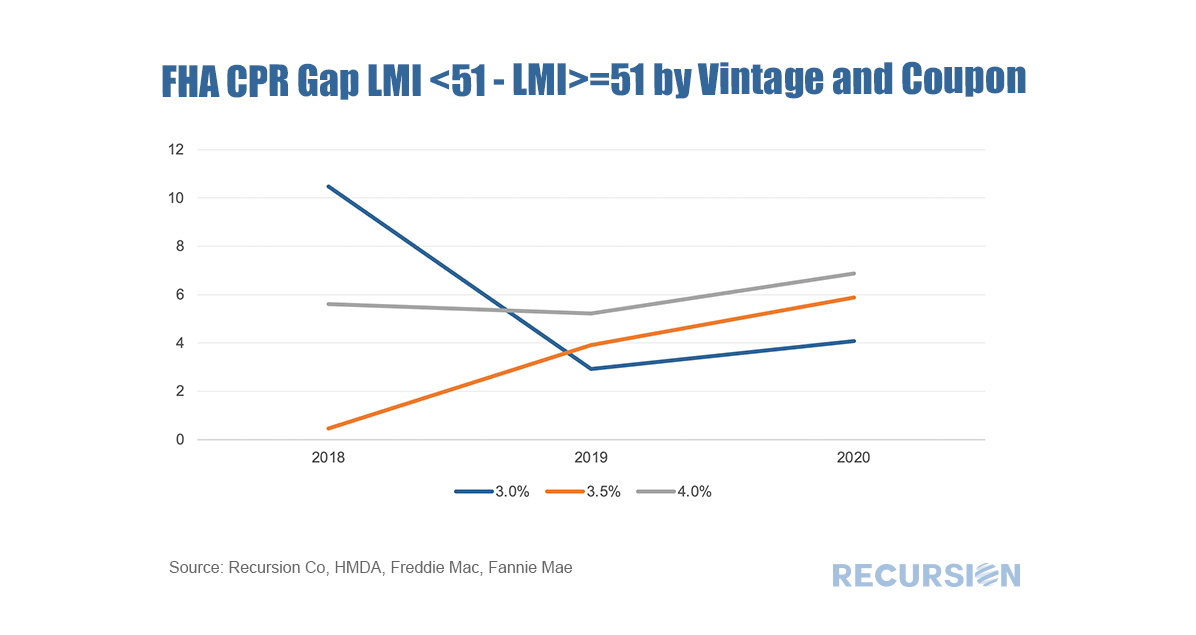
​So, at first, the answer seems to be yes. In most cases, prepayments are faster in areas with fewer than half LMI people. Of course, there are many other factors that can be driving this result. One that pops into mind is original loan size. The smaller the loan, the less incentive there is to refi. It seems natural then to try to adjust these charts for this factor. This is a complicated task as it adds an extra dimension to what we have above so what we do is to just look at a narrow slice of the whole picture by looking at the 1-month CPR in June for specific coupons for the GSEs and FHA for the 2019 vintage by loan size bucket:
Picture
Run Underlying Query 1
Run Underlying Query 2
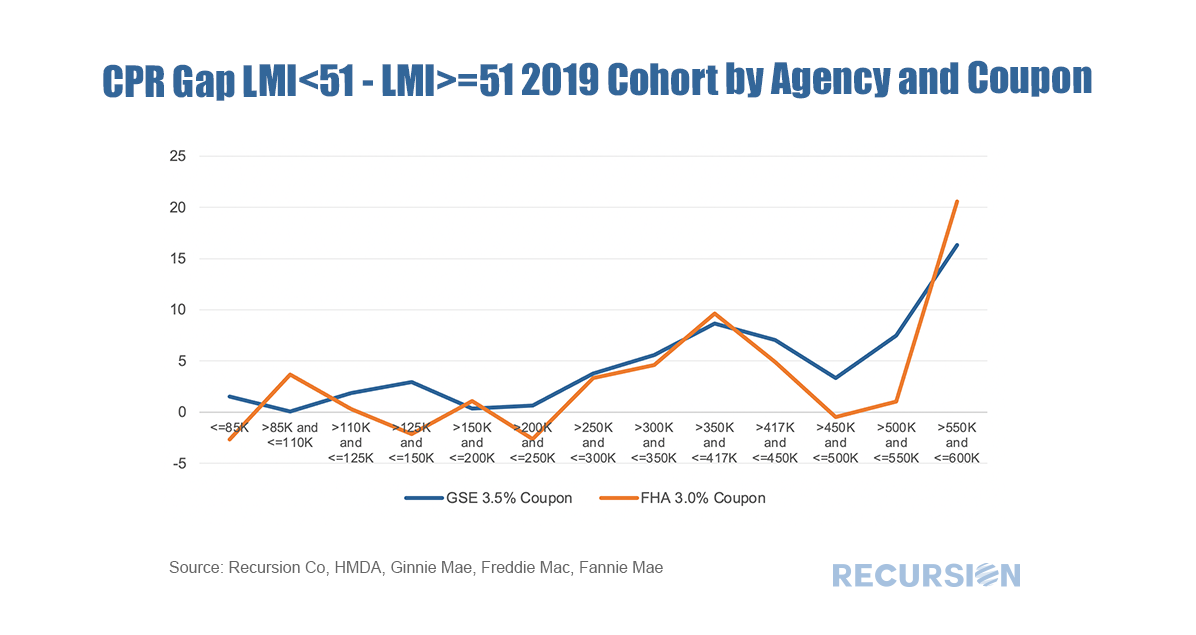
*This chart can be duplicated using the above two queries
While the data are noisy (sample sizes are declining) the trend to relatively faster prepayment speeds in areas with a lower share of LMI population for loan sizes greater than $250k is pretty clear.
​
Readers of these comments will recall that we are an analytics and not a policy or modeling shop. But we believe that our analysis is useful to both. Nothing here is definitive, but with regards to the question posed at the top we can say that you can’t rule it out.

[1] See https://www.recursionco.com/blog/big-data-and-the-new-housing-policy

    Archives

    July 2023
    June 2023
    May 2023
    April 2023
    March 2023
    February 2023
    January 2023
    December 2022
    November 2022
    October 2022
    September 2022
    August 2022
    July 2022
    June 2022
    May 2022
    April 2022
    March 2022
    February 2022
    January 2022
    December 2021
    November 2021
    October 2021
    September 2021
    August 2021
    July 2021
    June 2021
    May 2021
    April 2021
    March 2021
    February 2021
    January 2021
    December 2020
    November 2020
    October 2020
    September 2020
    August 2020
    July 2020
    June 2020
    May 2020
    April 2020
    March 2020
    February 2020
    May 2019
    March 2019
    February 2019

    Tags

    All
    Affordability
    ARM
    Bank\Nonbank
    Borrower Assistant Plan
    Cash Window
    Climate Change
    CMBS
    CMO
    Conforming Loan
    Conventional Loan
    COVID 19
    CPR\CDR\CRR\CCR
    Credit Score\DTI\LTV
    CRT\CAS\STACR
    Delinquency
    Early Buyout
    Early Payment Default
    ESG
    ET Pools
    Fannie Mae
    Fed
    FHA
    FHFA
    Forbearance
    Foreclosure
    Foreign Investor
    Freddie Mac
    Freddie Mae
    Ginnie Mae
    Green Loans
    HECM
    HELOC
    HMDA
    HUD
    LMI
    Manufactured Housing
    Modified Loans
    MSR
    Multifamily
    Occupancy Type\NOO
    Partial Claim
    Payoff
    PIW
    Prepayment
    PUD
    Purchase Loans
    Recursion In News
    Refi Loans
    Reperforming
    RG Pools
    Rural Housing
    Single Family
    Special Eligibility Program
    TBA Market
    TIC
    TPO
    UMBS
    US Treasury
    VA

    RSS Feed

RECURSION

SOLUTIONS ​
Recursion Analyzers
​
Mortgage Company Data
Recursion DataCloud
Customized Solutions


ABOUT US  ​
Overview
​Our team
CLIENT LOGIN   ​
Recursion Analyzers

CONTACT

224 West 30th St., Suite 303, New York, NY 10001
Contact Us

Picture
Copyright © 2022 Recursion, Co. All rights reserved.​
  • HOME
  • solutions
    • RECURSION ANALYZERS
    • Mortgage Company Data
    • Recursion DataCloud
    • Customized Solutions
  • BLOG
  • CLIENT LOGIN
    • Recursion Analyzers
  • ABOUT US
    • OVERVIEW
    • OUR TEAM
    • News & Events >
      • Recursion In News
      • Recursion Data Citations
  • CONTACT