|
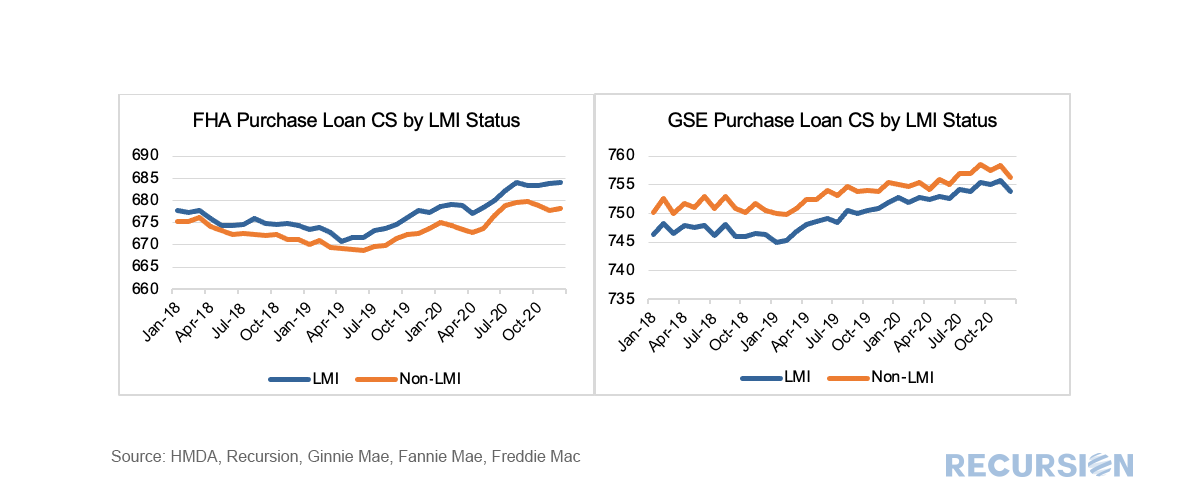
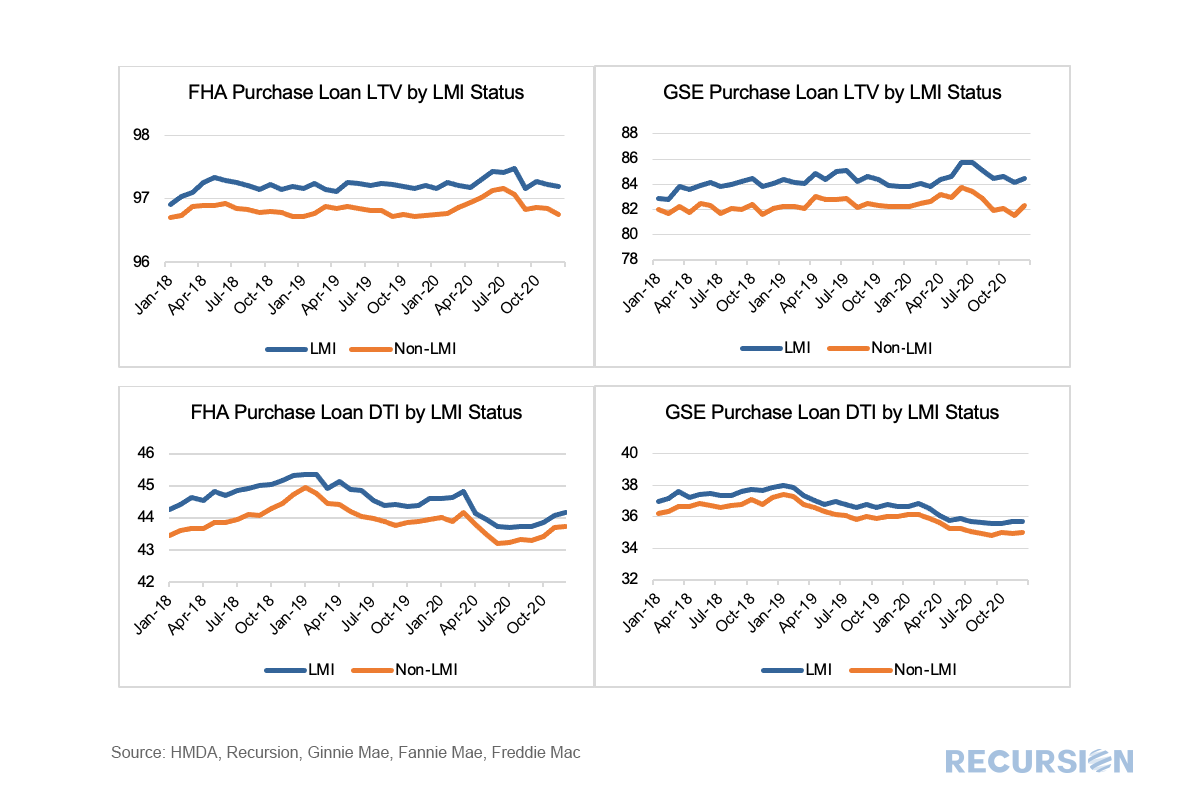
In a recent post[1] we looked at the evolution of the FHA purchase mortgage market share broken down between areas with a high percentage of Low-Moderate Income (LMI) households and those without. While the overall FHA share has generally declined since the onset of the pandemic, its share has held up in areas with a preponderance of LMI households. There are many factors behind these trends, but a natural consideration is underwriting standards. To examine this factor, we use the Recursion Matched Dataset[2], where we create a large sample of loans with characteristics from both HMDA and the Agency disclosure data. A very high share of mortgages can be matched using our proprietary algorithm over the years 2018-2020. The coverage ratio from the Matched Dataset is provided in a previous post[3]. We proceed by looking at three major underwriting characteristics for LMI and non-LMI areas for FHA and the GSE’s: Credit Score (CS), Loan-to-Value (LTV) and Debt-to-Income (DTI), Most interesting is Credit Scores: Somewhat unintuitively, credit scores for FHA purchase loans in LMI areas are above those in areas with a smaller share of low-income borrowers. The slides for LTV and DTI are more on point with LMI loans showing somewhat looser credit standards measured by these characteristics for both FHA and the GSE’s: The relationship for FHA regarding credit scores may be due to careful underwriting on the part of lenders in LMI areas, or to a relative lack of competition from the GSE’s there[4]. FHA’s Mutual Mortgage Insurance Fund capital ratio increased for the third consecutive year in the fiscal year ending September 30, 2020[5], indicating limited fallout on FHA’s financial condition through the first six months of the Covid-19 pandemic. This exercise in examining changes in the market shares between Government and Enterprise programs using big data tools opens new channels for examining the impact of housing finance policies. There will certainly be more to come. [1] https://www.recursionco.com/blog/the-fha-share-in-lmi-areas
[2] https://www.recursionco.com/blog/the-matched-data-set [3] https://www.recursionco.com/blog/appraisal-waivers-and-lmi-areas [4] In the prior blog we noted that in 2020 the FHA purchase loan share in LMI areas was about 25% by count, about 8% higher than the GSE’s that year. [5] https://www.hud.gov/sites/dfiles/Housing/documents/FHAFY2020ANNUALMGMNTRPT.pdf |
Archives
July 2024
Tags
All
|
RECURSION |
|
Copyright © 2022 Recursion, Co. All rights reserved.


 RSS Feed
