|
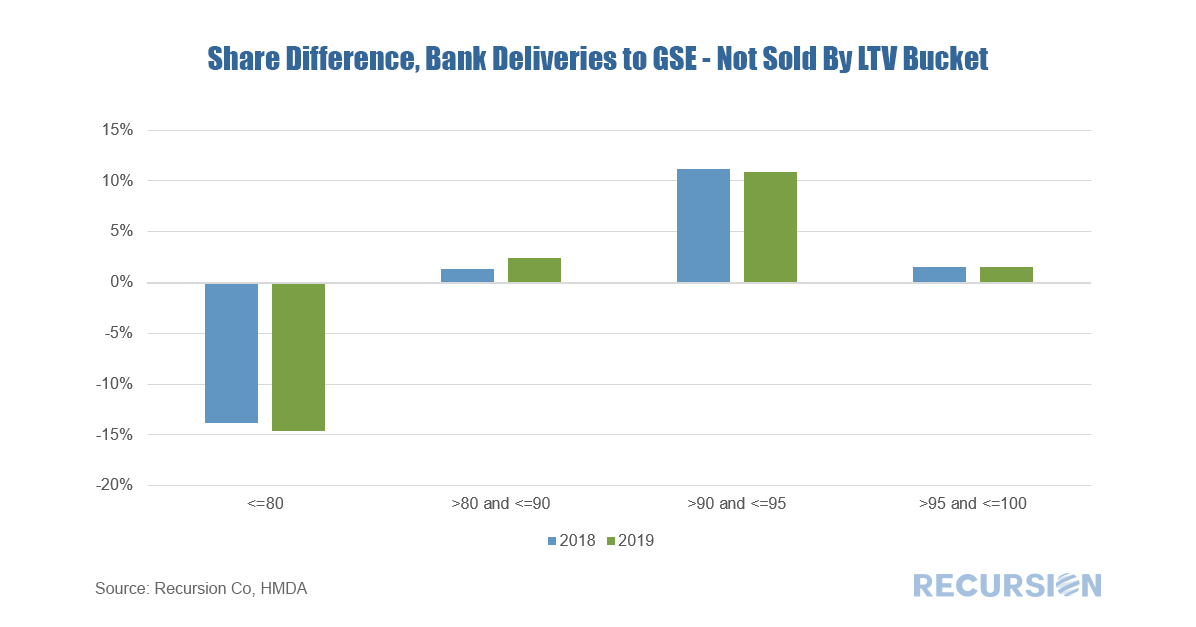
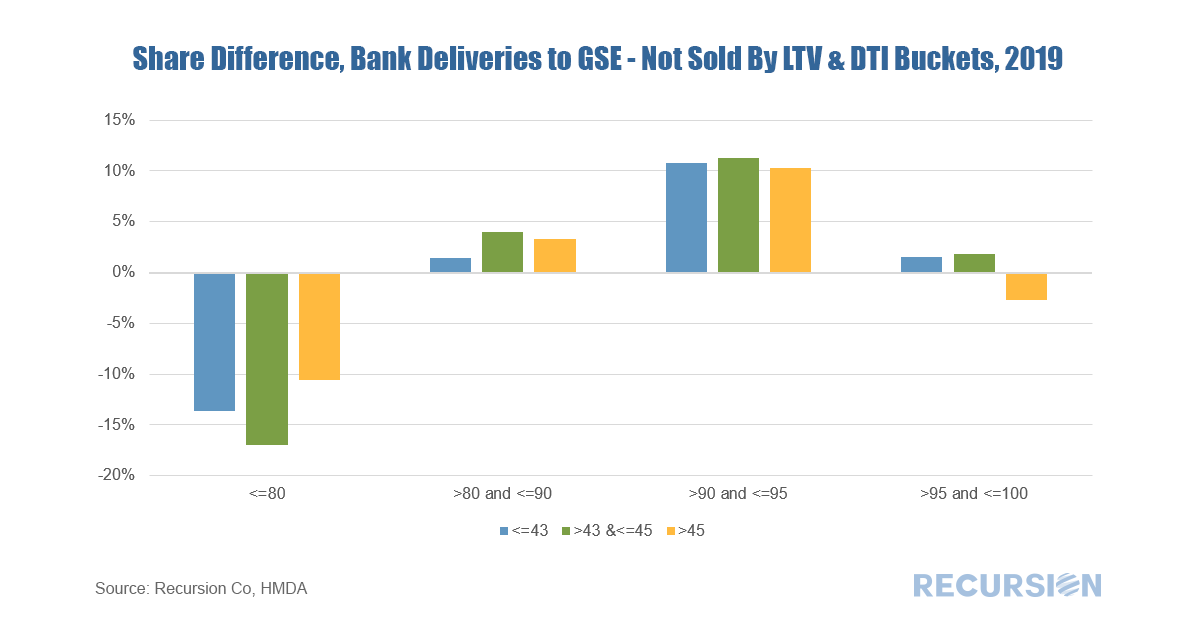
In a recent post we looked at the differences in bank underwriting characteristics between those conforming loans held on book compared to those delivered to the GSEs using data pulled from Recursion HMDA Analyzer[1]. We now extend this into another dimension via the addition of LTV. Below find the difference in share of such deliveries between sold loans and those held on book: Similar to what we found for DTI, there is a tendency for banks to keep higher quality loans (lower LTV) and to deliver lower quality loans (higher DTIs). Interestingly there is little difference seen for medium LTV (between 80 and 90) or very high LTV (over 95). We note again that such behavior cannot necessarily be tied to selection bias, as lower quality loans can be tied to such characteristics as low income that make them desirable from a regulatory perspective. Another thing to note is that there is little difference between 2018 and 2019, a distinctly different pattern than we saw for DTIs where the ratios posted change between the two years. So as a next step, let’s look at these patterns for just 2019 across DTI buckets. Some interesting patterns emerge. In the safest LTV bucket (less than 80), banks tend to keep medium risk loans from a DTI perspective. For the very riskiest LTV category (greater than 95), banks deliver slightly more loans than they keep except for the riskiest loans with DTIs greater than 45. This may be because these are outside the GSEs’ credit box, or because of the very high loan level price adjustments (LLPAs) that the GSEs would apply to such sales. Our Recursion HMDA Analyzer allows for a myriad of ways to slice and dice these loans across many characteristics, and, notably, to drill down geographically to the census tract level for individual originators. Such information is invaluable for benchmarking and strategic planning for financial institutions, and is available with just the push of a button at Recursion. |
Archives
July 2024
Tags
All
|
RECURSION |
|
Copyright © 2022 Recursion, Co. All rights reserved.


 RSS Feed
