|
In our third look at 2019 HMDA[1] characteristics we look at mortgage originations by income bracket. Lending to low- and moderate-income households is an important regulatory requirement of banks[2]. The definition of “low” and “moderate” depends on the local area in which the bank operates. HMDA data is well-suited to regulators looking to track the performance of the institutions they oversee and allows banks to benchmark their performance against their competition. If banks need to add low- to moderate-income loans to their portfolio to meet requirements, HMDA can provide direction regarding which institutions might be a source of product that meets needed characteristics. Below we present a quick high-level example. HMDA data operates down to the census tract level, but for our purposes here let’s look at two distinct states: California and Oklahoma. In 2018, median income in the two states was $70,500 and $54,400, respectively[3]. According to Zillow data[4], the median house prices in California and Oklahoma that year were $550,000 and $122,000 respectively. Clearly housing is relatively unaffordable for households at or below median income in California compared to Oklahoma. So it is not surprising that the homeownership rate in Q2 2018 for California, at 54.3%, is substantially below that of Oklahoma, at 69.1%[5]. Confirming this, the following table from 2018 and 2019 HMDA show that there is a substantially greater share of lower- and moderate- income loans available in Oklahoma than in California. Interestingly this share declined in 2019 relative to 2018, particularly for Oklahoma. It is not clear whether this is due to fundamental factors or technical issues related to an increase in the share of “N/A” responses between the two years. 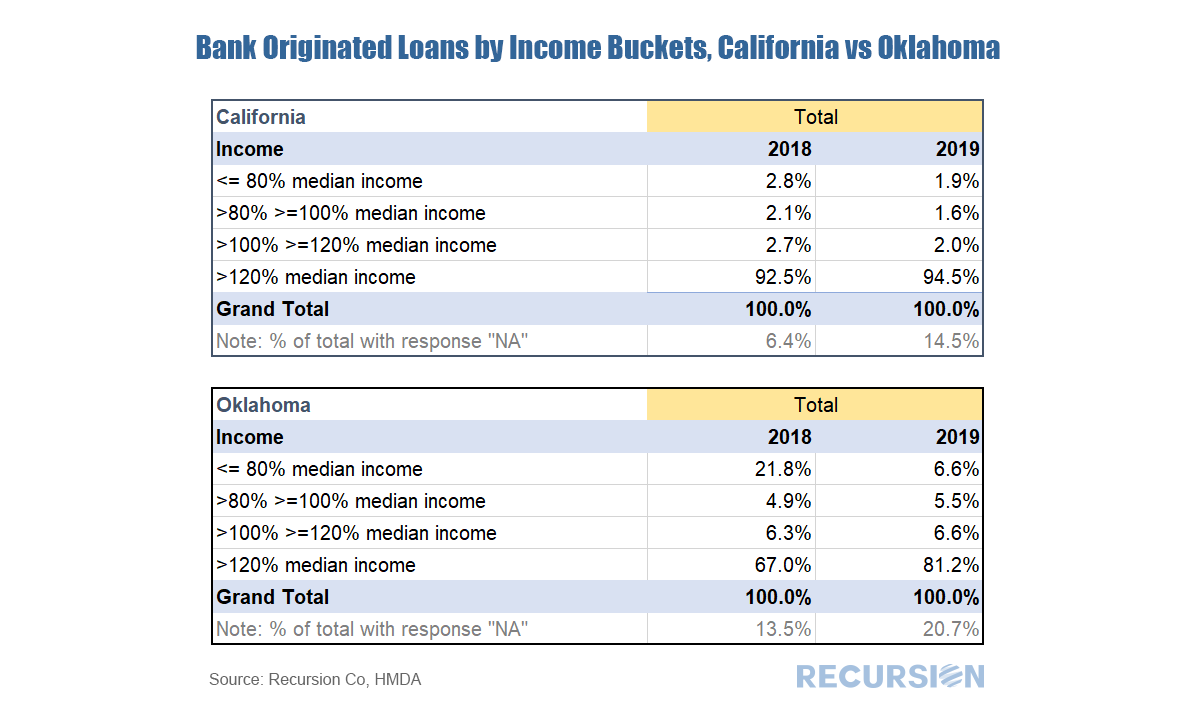 Finally, to be consistent with prior posts we look at the share of conforming loans originated by banks that are sold to the GSEs, broken down by income brackets: 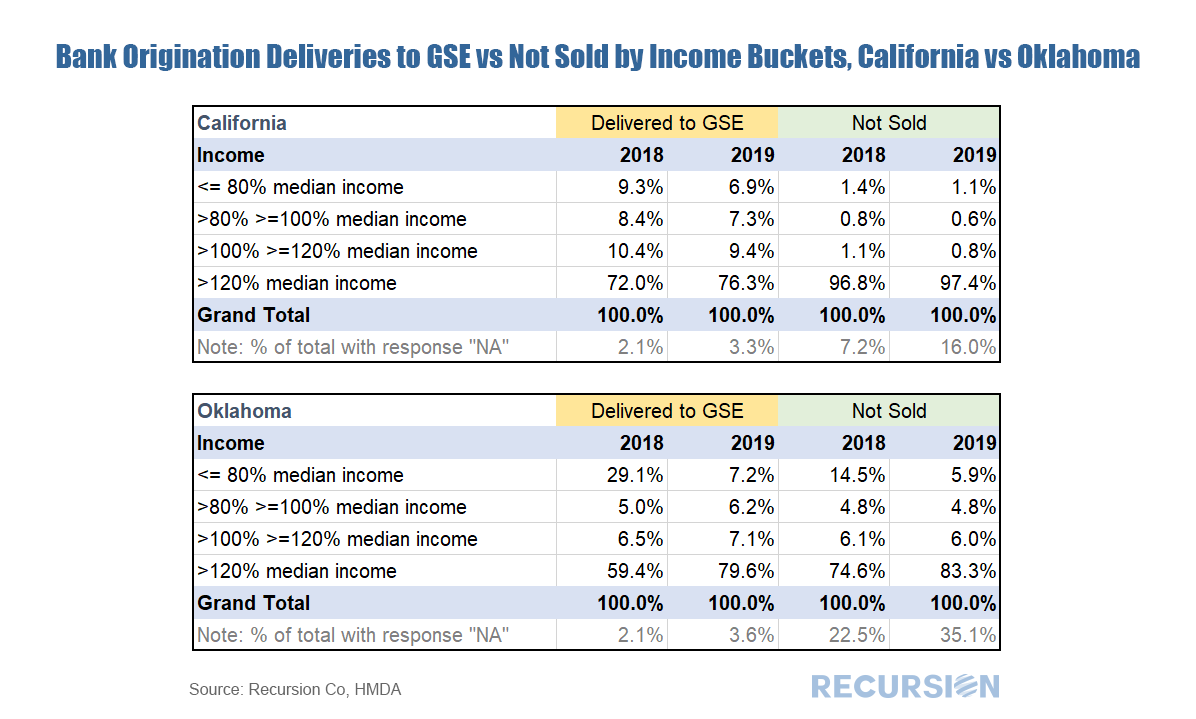 A few interesting observations pop up. First, in California the loans that banks keep on their book are almost entirely made to the highest-income households. For Oklahoma, it’s a mixture of highest income and lowest income. This suggests that policy requirements regarding serving poorer communities plays a relatively greater role in Oklahoma than California. [1] The first two 2019 HMDA blogs are available at
https://www.recursionco.com/blog/what-is-the-credit-quality-of-loans-held-on-book https://www.recursionco.com/blog/credit-quality-held-on-book-2-looking-at-ltv [2] See for example, https://www.fdic.gov/regulations/resources/director/virtual/cra.pdf [3] Data from 1984 – 2018 can be found https://www2.census.gov/programs-surveys/cps/tables/time-series/historical-income-households/h08.xls [4] Taken from June 2018 data at https://www.zillow.com/ok/home-values/ and https://www.zillow.com/ca/home-values/ [5] https://www.census.gov/housing/hvs/data/rates/tab3_state05_2020_hmr.xlsx |
Archives
July 2024
Tags
All
|
 RSS Feed
RECURSION |
|

Copyright © 2022 Recursion, Co. All rights reserved.