|
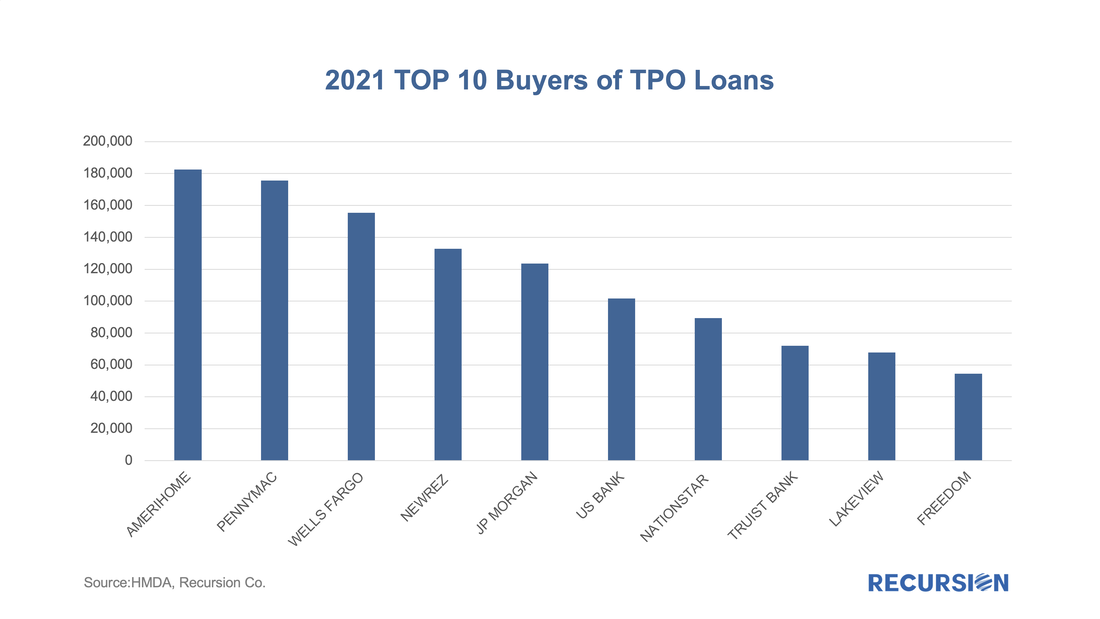
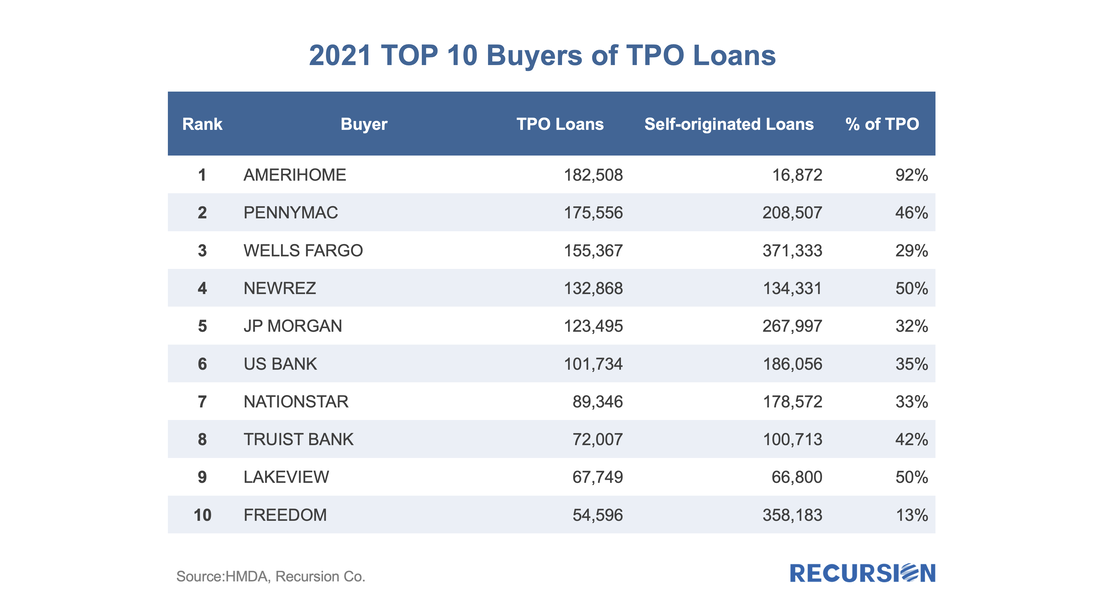
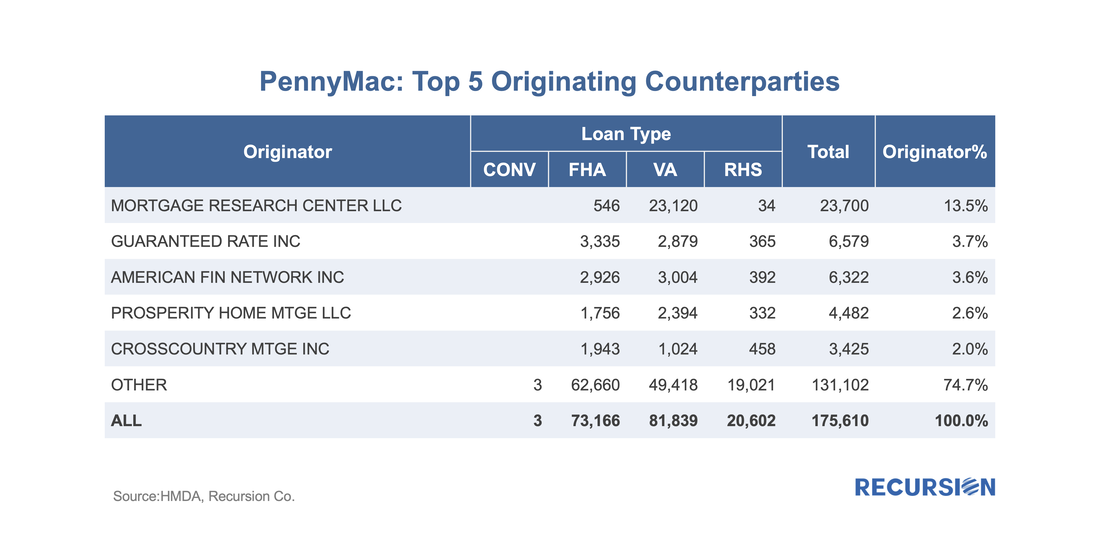
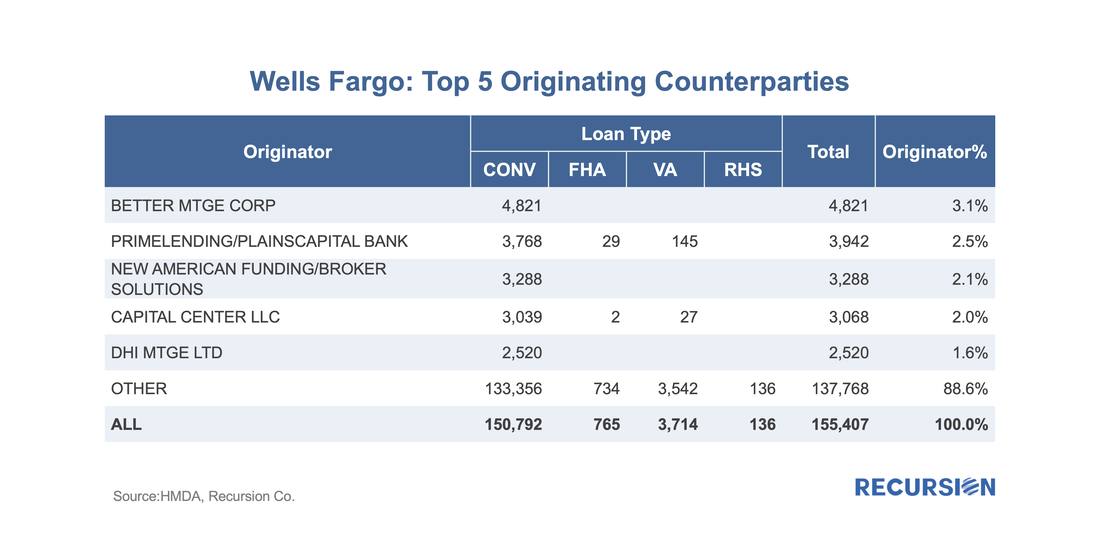
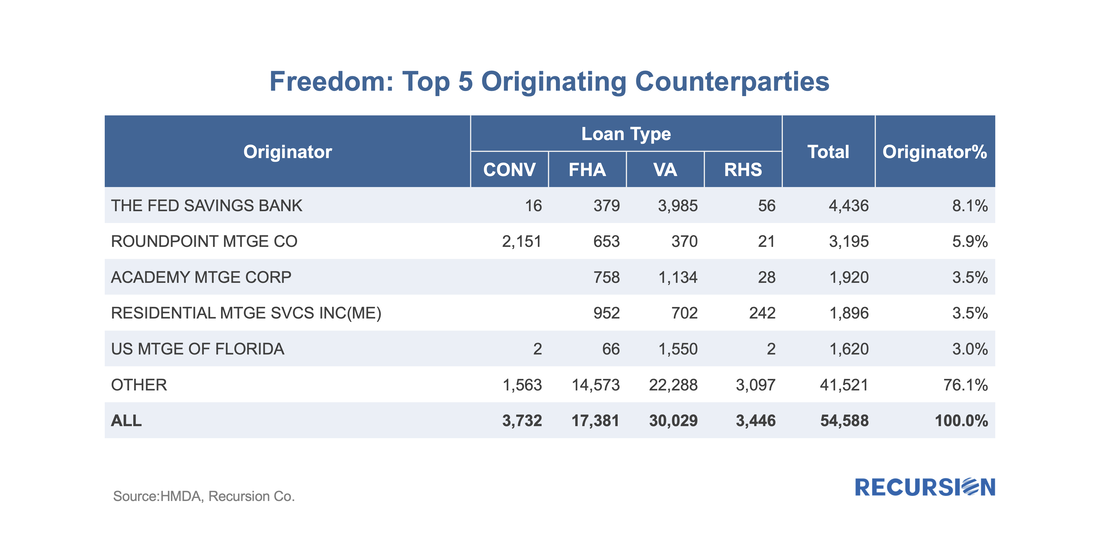
Usually, when we talk about financial institutions in our posts, we focus on sellers and/or servicers as we have a clear view from the Agency disclosures. An interesting distinction in this regard is to break down originations between those sourced through a retail channel within the lending institutions and those purchased from other lenders, known as third-party originations (TPOs). We are often asked the question in the case of TPO lending, where only sponsors of the mortgages are reported, who are the originators? This information is not reported in the agency loan-level disclosure. We can supplement this information by examining originators in the HMDA data by observing the fact a TPO (correspondent or broker) loan is often reported twice, one record reported by the originator and another reported by the sponsor. At Recursion, we conducted an exercise by matching the pairs together, and we were able to identify the counterparty pairs for about 50% of the mortgages marked as “purchased”, and also made this revealing data point to our HMDA Analyzer users. According to the 2021 HMDA preliminary release, about 2.65 million loans were purchased from other lenders that year, about 18% of all originations. Roughly half of these purchases were made by 10 institutions: In some cases, TPOs are the primary source of loans (Amerihome), while for others, the picture is more balanced (Lakeview). A further distinction of note is the share of purchases for each originator broken down between conventional and government loans. Below find a breakdown for PennyMac (Note: the loan counts represent the matched samples): Here you can see that PennyMac is almost exclusively a purchaser of Government loans and that the ratio of VA to FHA loans purchased is almost 2:1. The number one institution they purchased loans from is Mortgage Research Center (dba Veterans United Home Loans), the 23rd originator in 2021, and the vast bulk of these were VA loans. They sell almost four times as many loans to PannyMac than the Guaranteed Rate. A substantially different picture can be seen for Wells Fargo (loan counts are samples): Wells purchases conventional loans almost exclusively. While Better Mtge. Corp is the number one seller to them, it does not have a dominant role to play the way Mortgage Research Center does with PennyMac. Another interesting case is Freedom (loan counts are samples). Here we have a nonbank that purchases Like PennyMac, another nonbank, they purchase Government loans primarily, but conventional loans comprise about 7% of the total. Interestingly more than half of these come from Roundpoint Mtge Company. Within the Government bracket, the top seller is the Fed Savings Bank. As is the case with PennyMac, the top seller is primarily a VA underwriter but has a considerably smaller share than Mortgage Research Center has in that case.
Looking at the pattern of originations provides insights into the behavior of categories of originators (bank vs. nonbank) and the strategies of individual firms. Policymakers can assess the impact of new measures on the overall market based on these distinctions. Similarly, traders can look to draw inferences about how origination patterns influence loan performance. Examining correlations across different sources of data is a promising path for research across all of these applications. |
Archives
July 2024
Tags
All
|
RECURSION |
|
Copyright © 2022 Recursion, Co. All rights reserved.

 RSS Feed
