|
As we approach year-end and the beginning of the process of phasing out forbearance programs, the natural question market participants are asking is which indicators should they be watching to gain a sense of the mortgage landscape in 2022. Along these lines, there is a significant difference between the Ginnie Mae programs and the GSE’s. In particular, for conforming loans, it is the Agencies themselves that buy nonperforming loans out of pools, while for FHA and VA, this function is performed by servicers. As the timeframe for buyouts on the part of the GSE’s was extended to 24 months earlier this year, we won’t see much activity prior to April 2022 on this front[1]. So in this post, we focus on the Ginnie Mae programs. As we have written previously, it is challenging to follow the path of a loan once it has been purchased out of a pool. At the aggregate level, we can view the activity of individual lenders using the FHA Neighborhood Watch data[2]. In terms of the process, a nonperforming loan is bought out of a pool, and one of three actions can be taken. First, the borrower can be taken into foreclosure. Second, the borrower can become current and roll the unpaid balance into a second lien, in a process known as a partial claim. Third, the borrower can accept a loan modification. In terms of the scale of buyouts, after an early spurt of activity in 2020 on the part of some parties, notably banks, the involuntary prepayment rate, measured by CDR(constant default rate), has settled down in recent months. FHA nonbank servicers have been more active in this space than other categories over the past year. As forbearance plans begin to expire towards the end of the year, these numbers may start to rise. 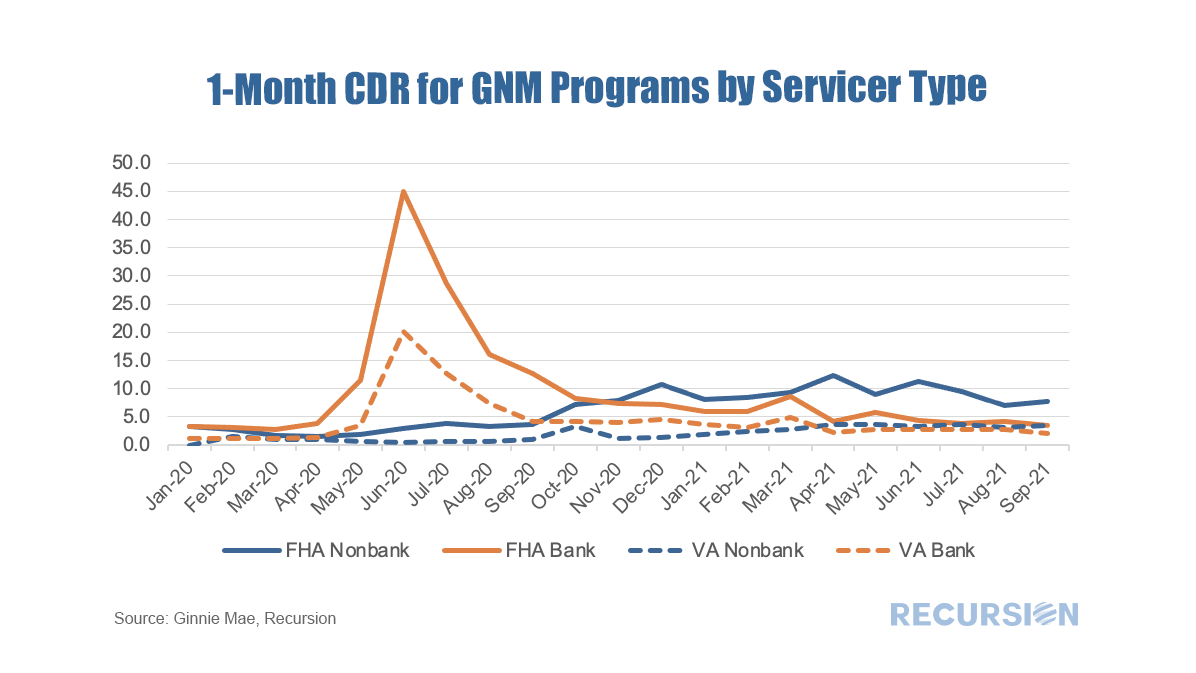 Received wisdom in the mortgage market holds that distress in the mortgage market eases as the labor market improves. While there is certainly some justification for this view, in fact there are many factors that drive performance so the direct correlation with the jobs market does not always hold. 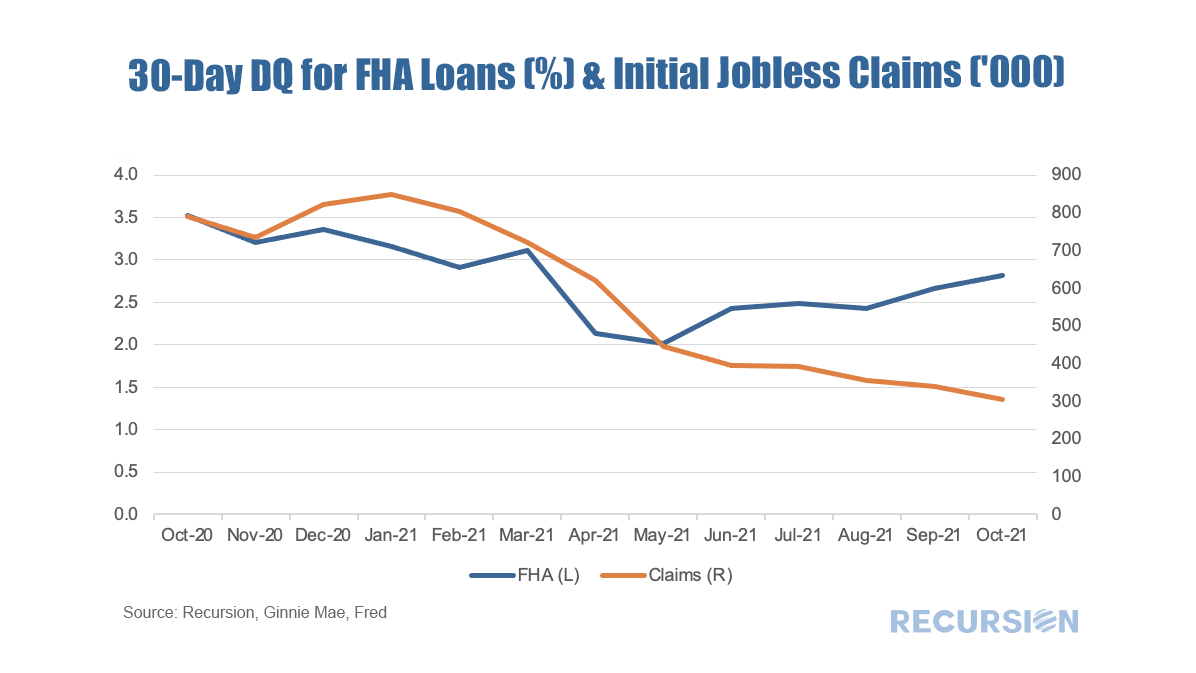 In a recent Liberty Street Economics blog post, researchers at the New York Federal Reserve discussed the background and landscape of mortgages qualifying for Covid forbearance under the CARES Act[1]. 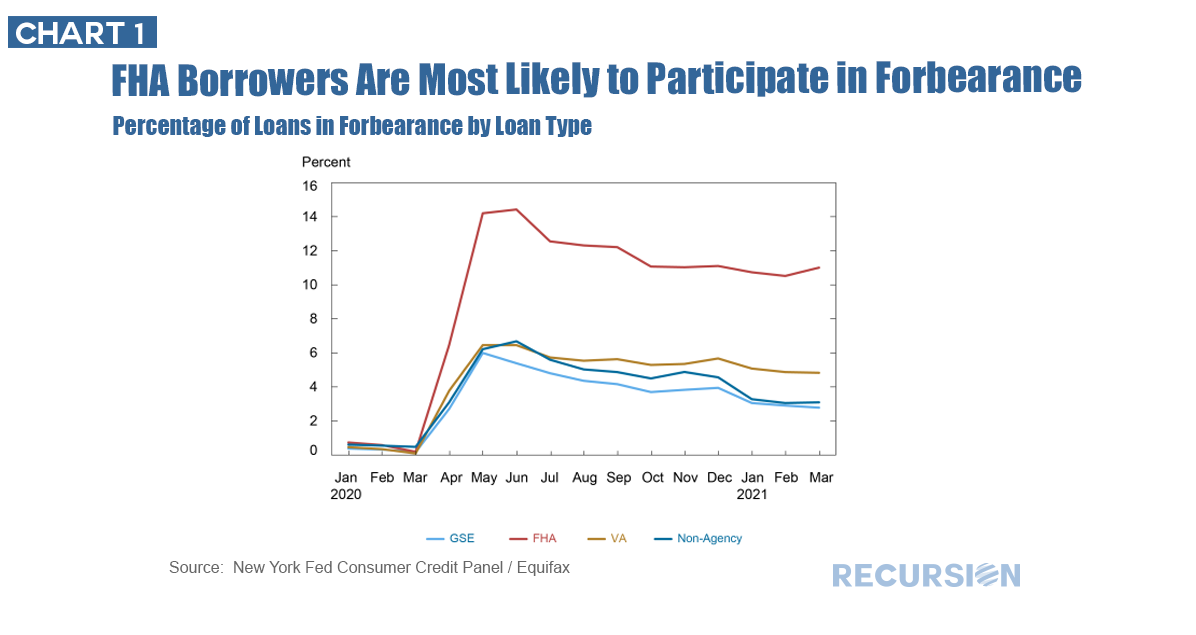 Recursion’s Chief Research Officer Richard Koss published an article in Housing Wire Magazine on agency mortgage forbearance and the capital markets. When the CARES act was originally passed on March 27, 2020, there were notable concerns that these measures would merely postpone an inevitable correction in the housing market once the programs expired. However, home price appreciation came to the rescue. But the mortgage market continues to face the prospect of involuntary buyouts of loans from agency pools. Check out the details at:
https://www.housingwire.com/articles/the-end-of-forbearance-and-the-capital-markets/ In a recent post, we commented on the drop in the number of loans in forbearance in Ginnie Mae pools[1]. Because of the different capital strictures, it’s interesting to look at the breakdown between banks and nonbanks. 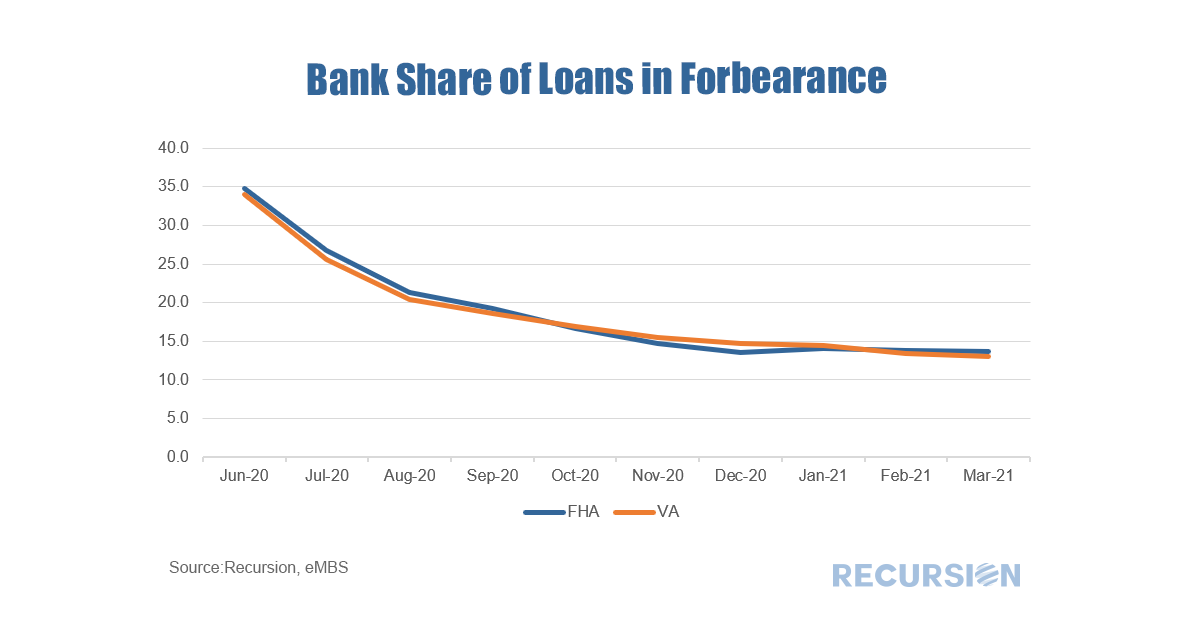 The economic news in March got off on a strong note with the release of payroll employment data showing a hike of 916,000, a seven-month high. This coincided with the first anniversary of the onset of the Covid-19 Pandemic. The Cares Act forbearance program was launched at the end of March 2020 and was originally designed to last for one year. More recently, the program was extended for six months, but borrowers need to recertify their status as economically impacted by Covid every three months from the 1-year anniversary data[1]. So naturally the end of March was a time in which many borrowers had to recertify. This was a natural time for households to reassess their financial positions, setting the stage for the possibility that they could begin repaying their mortgage obligations. In fact, they did, and we saw a sizable drop in the number of loans in Covid-related forbearance[2] in April, particularly for Ginnie Mae programs: 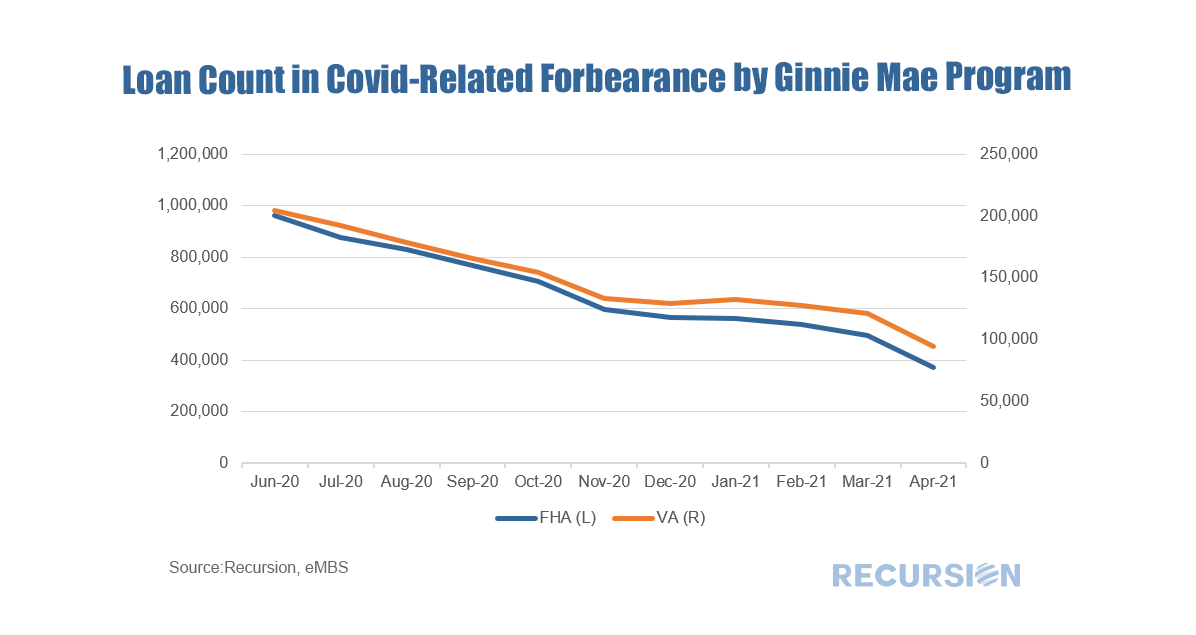 The economic fundamental driving this decline is the improvement in the labor market, and a distinct correlation can be seen between declining forbearances and unemployment: 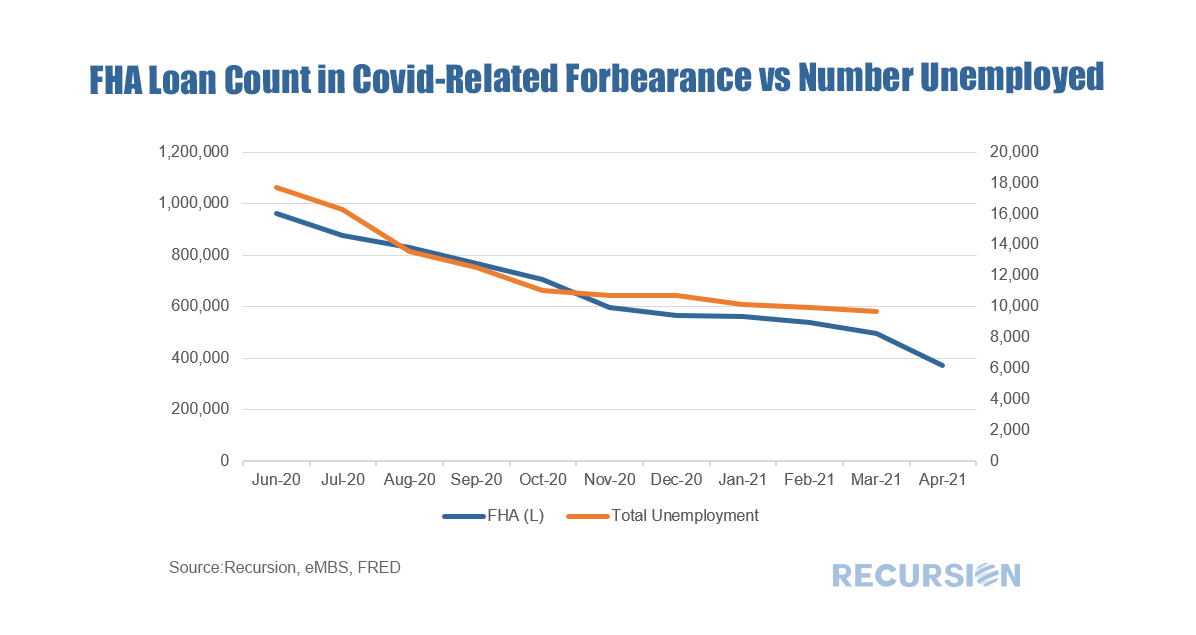 A bit more analysis is in order here. The forbearance data come from loans in agency pools, so there is always the possibility that the number of loans in forbearance decreases because some of those loans were bought out of pools by servicers. To check this, we looked at the disposition of loans in forbearance at the beginning of March that remained in pools at the beginning of April but were not in forbearance. For FHA programs the number was 111,153 loans compared to the one-month decline in the number of loans in forbearance of 125,202. For VA the similar statistic is 27,247 compared with a 26,810 decline in the number of loans in forbearance. It seems clear that improving labor market fundamentals are the primary driver of the decline in the number of loans in forbearance in these programs. To test the idea that the 12-month renewal period played an important role in this process, below we look at the loan age of those mortgages that left forbearance but stayed in pools in April. For FHA programs, the number with loan age of one month was 79,212 or 71% of the total, while for VA it was 17,863 or 66%. The next important date will be June before the program is scheduled to end at the end of September. 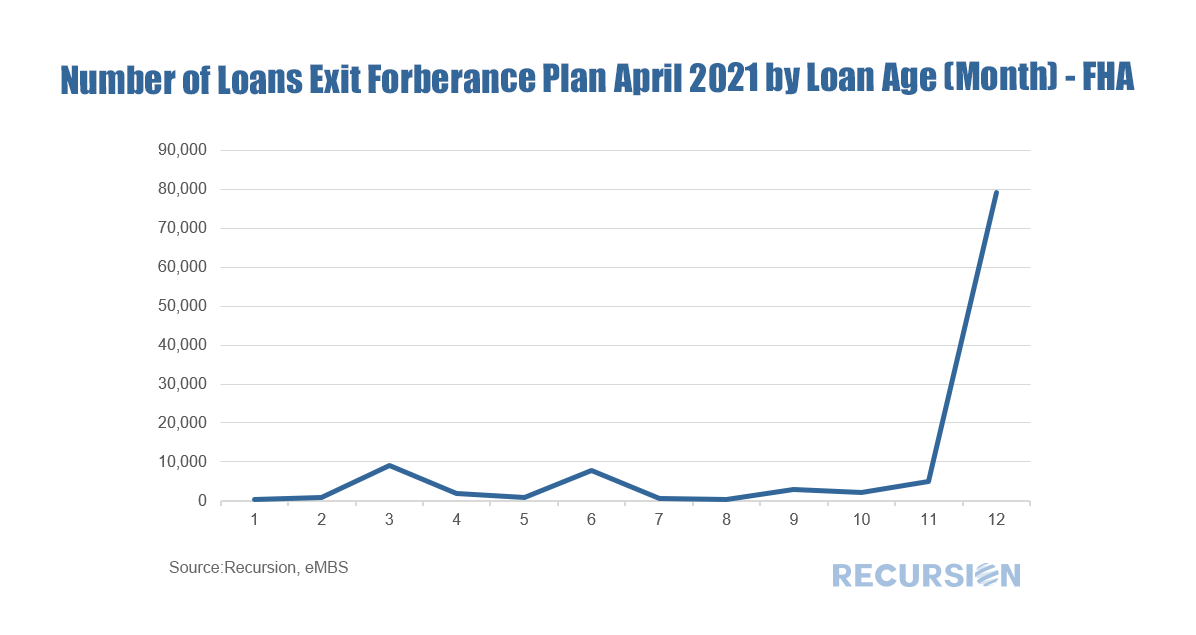 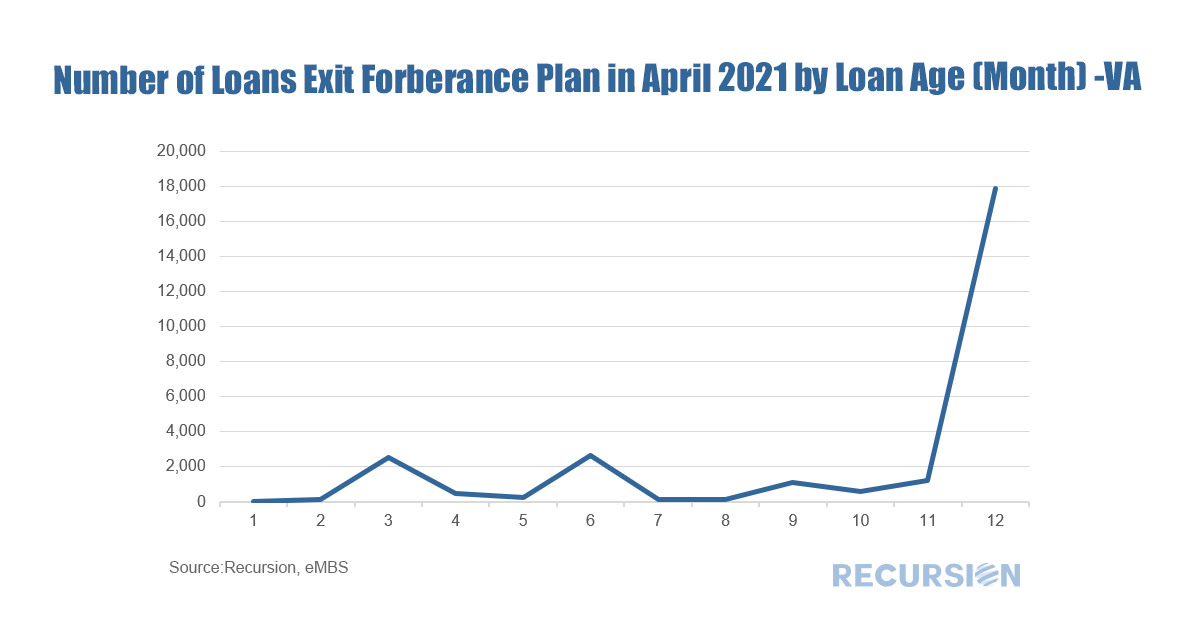 As can be seen from the above table, the vast majority of the number of loans that were recorded as in forbearance in March but not in April did not exit due to buyouts. The data do not precisely add up because other outcomes are possible, including FHA – conventional refis or sales of homes, for which we have no tracking mechanism. But the close match between cures and the declines in forbearance across programs is evidence that the main impetus is improving fundamentals. [1] https://www.consumerfinance.gov/coronavirus/mortgage-and-housing-assistance/help-for-homeowners/extend-forbearance/
[2] In this blog, we only analyze Covid-related forbearance Sometimes, future trends can be seen in the weeds. In this case it’s the 12 FHA and 1 VA mortgages (out of tens of millions) that were securitized this month in Ginnie Mae pool G2 CA8080, the very first RG pool, issued by PNC Bank, delivered to the GNMII20C program. This pool type was first announced by Ginnie Mae last December 4[1], and consists entirely of loans that were bought out of pools and cured with partial claims. These are eligible for resecuritization after 6 months without a missed payment. A previous announcement was made by Ginnie Mae last June that prohibited loans in forbearance from being bought out of pools and resecuritized into any existing pool type[2]. This rule was enacted after large banks purchased a massive number of loans in forbearance and resecuritized them immediately, leading to concerns on the part of investors[3]. Is there anything interesting about these loans? 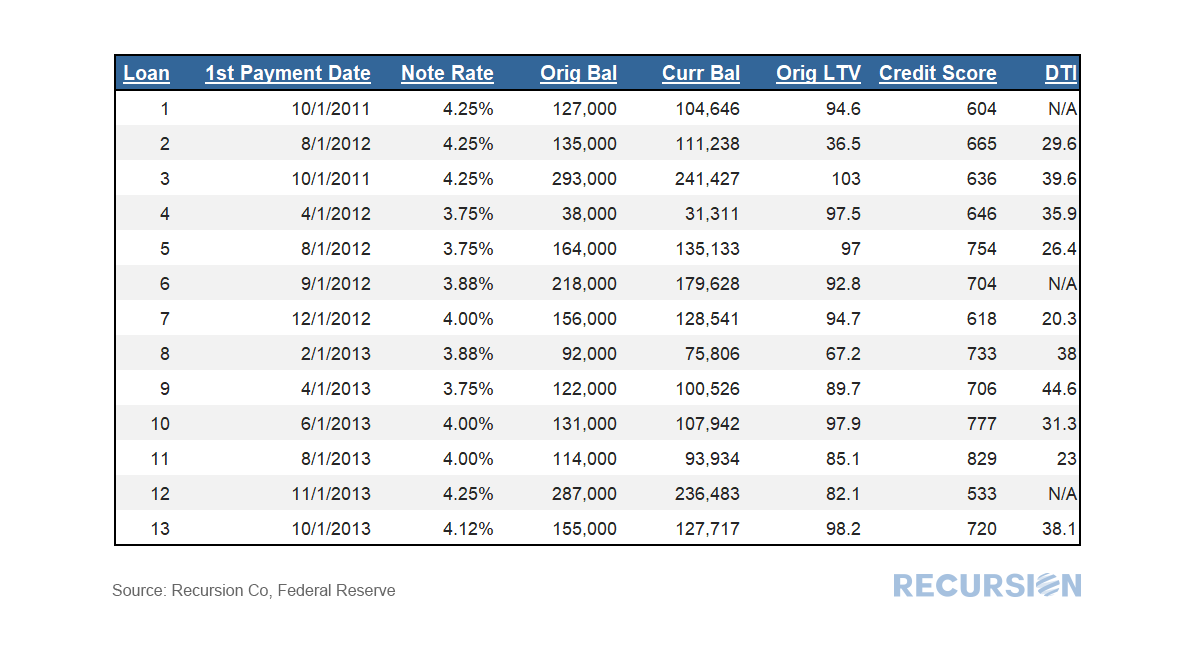 The loans were all originated in 2011-2013, so they are pretty seasoned. Note rates range from 3.75% - 4.25%. Underwriting characteristics vary considerably, with credit scores ranging from 533 to 829, for example. While original LTV’s are generally high (8/13 greater than 90) home price appreciation over the last 8-10 years likely implies that borrowers have considerable equity. More of this to come as forbearance programs begin to run out later this year. Recursion data was quoted in the January 27th, 2021 Debtwire article on the growing volume of distressed residential loans. The author used Recursion data to observe that the supply of GNM Early Buyouts (EBOs) among non-banks has been rising for months, which indicates that the supply of non-performing loans may be expected to rise when the forbearance program ends. 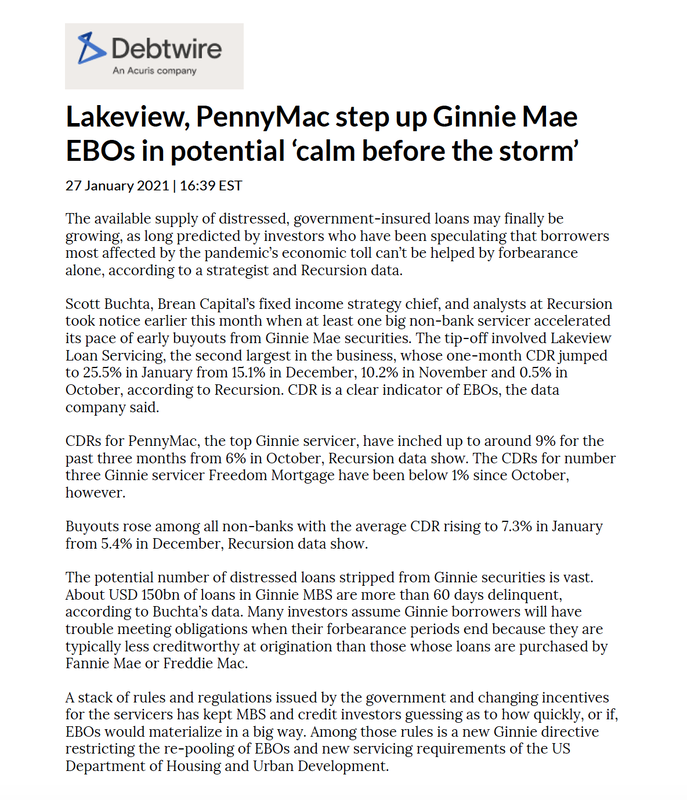 |
Archives
February 2024
Tags
All
|
 RSS Feed
RECURSION |
|

Copyright © 2022 Recursion, Co. All rights reserved.