|
So once again we look at the theme of 2021 as a transition year. A lot of the year will be spent peering at the data to tease out emerging trends as we head towards the new normal. The discernment of new trends requires the use of new data, and new tools. We have recently brought into the Recursion data set FHA Neighborhood Watch data, which was discussed previously in the context of partial claims[1]. These are the suspended mortgage payments for loans in forbearance that are rolled into a second lien, repaid only when the loan is extinguished. This is particularly useful for tracking the financial burden of forbearance by servicer. To accomplish this in a comprehensive manner, FHA releases this data for all endorsed loans. Using this data, we can examine trends in all loans vs those securitized in Ginnie Mae pools. Our data for the FHA Neighborhood Watch extends back only to April 2020, but the last eight months have been an interesting period in mortgage markets. 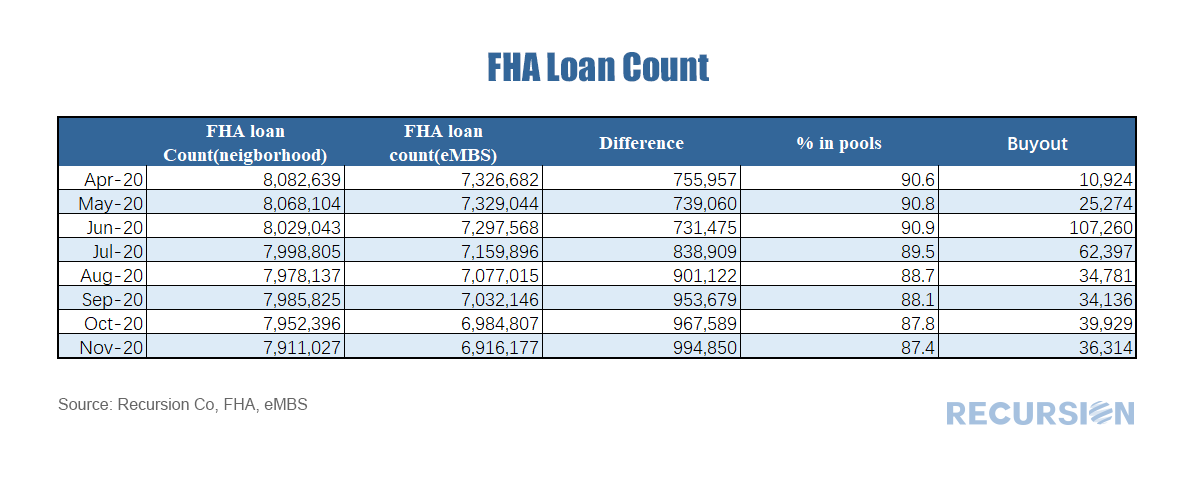 In prior posts, we have pointed out the tight relationship between unemployment and mortgage delinquency[1]. This note extends this analysis by looking at this relationship at particular durations. Every month, the Bureau of Labor Statistics releases data on the “Duration of Unemployment”[2]. For example, below find a table containing data for the number of unemployed people in before, during and after the shock associated with the onset of the Covid-19 crisis by how long they have been unemployed. 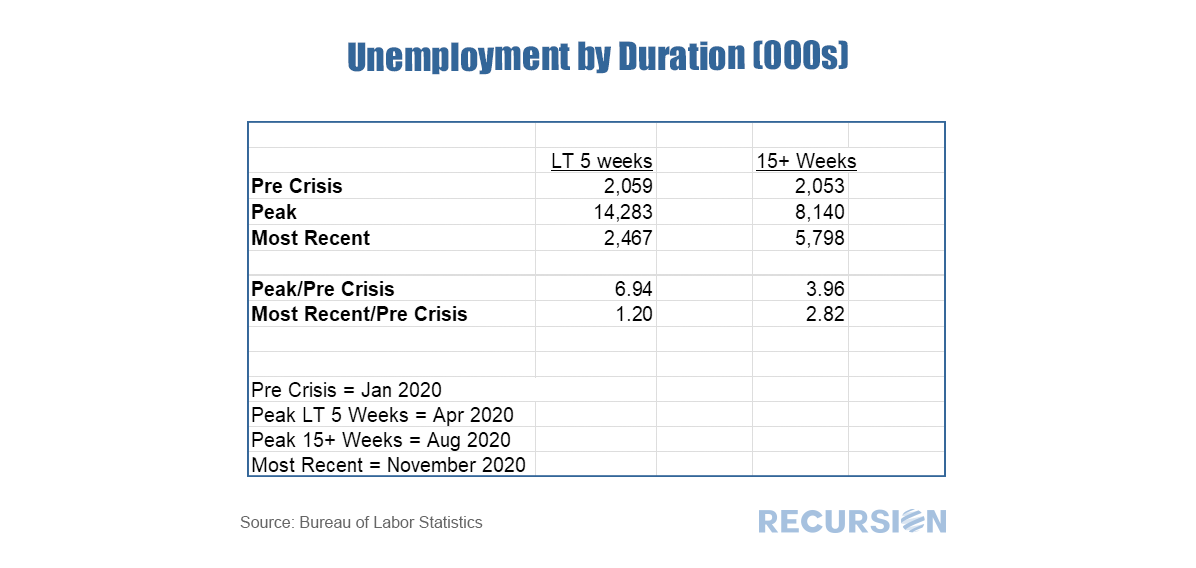 For some time, we have been talking about the key driver of mortgage performance is policy rather than fundamentals. This theme is certainly evident with the release of agency prepayment data for November[1]. The chart below chart displays the gap between the 1M prepayment speeds between Ginnie Mae and GSE securities: 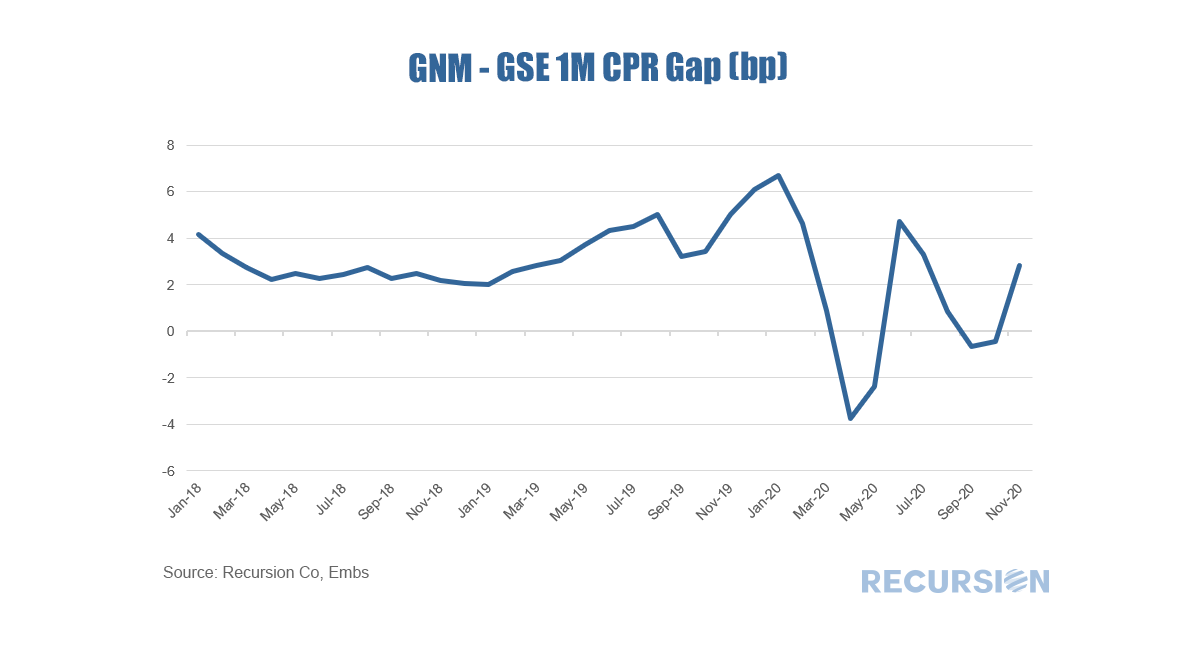 As we head into 2021, an ongoing issue is the disposition of loans in forbearance. The Cares Act allows for borrowers negatively impacted by the Covid-19 pandemic to obtain forbearance up to 1 year[1]. This will begin to expire in Spring 2021, although an extension is possible as the new Administration takes over in January. A key point is that forbearance is not forgiveness. The mortgage agencies have provided options for borrowers who become current after forbearance, so they don’t have to make a lump-sum payment for missed principle and interest.
FHA has designated its policy regarding the disposition of suspended payment amounts as COVID-19 National Emergency Standalone Partial Claims[2](COVID Partial Claim). “The COVID Partial Claim puts all suspended mortgage payment amounts owed into a junior lien, which is only repaid when the homeowner sells the home, refinances the mortgage, or the mortgage is otherwise extinguished.” Unlike the situation during the Global Financial Crisis, imbalances in the housing market are not the root cause of the Covid-19 economic downturn. Instead, housing is helping to pull the economy out of its pandemic-induced swoon. House price rises have accelerated, due both to low interest rates, as well as to household relocations away from high-density areas. This is leading to increased construction, and improved household balance sheets. Moreover, a surge in refinances improves household cash flow. How long can this trend continue? The answer to this question depends crucially on many varied policy settings that influence lender and borrower behavior. The chart below shows 1-month CPR for 30-yr MBS securities broken down between the 30-Year GSEs and 30-Year FHA for the 2017cohort. A number of fundamental and policy factors come into play. 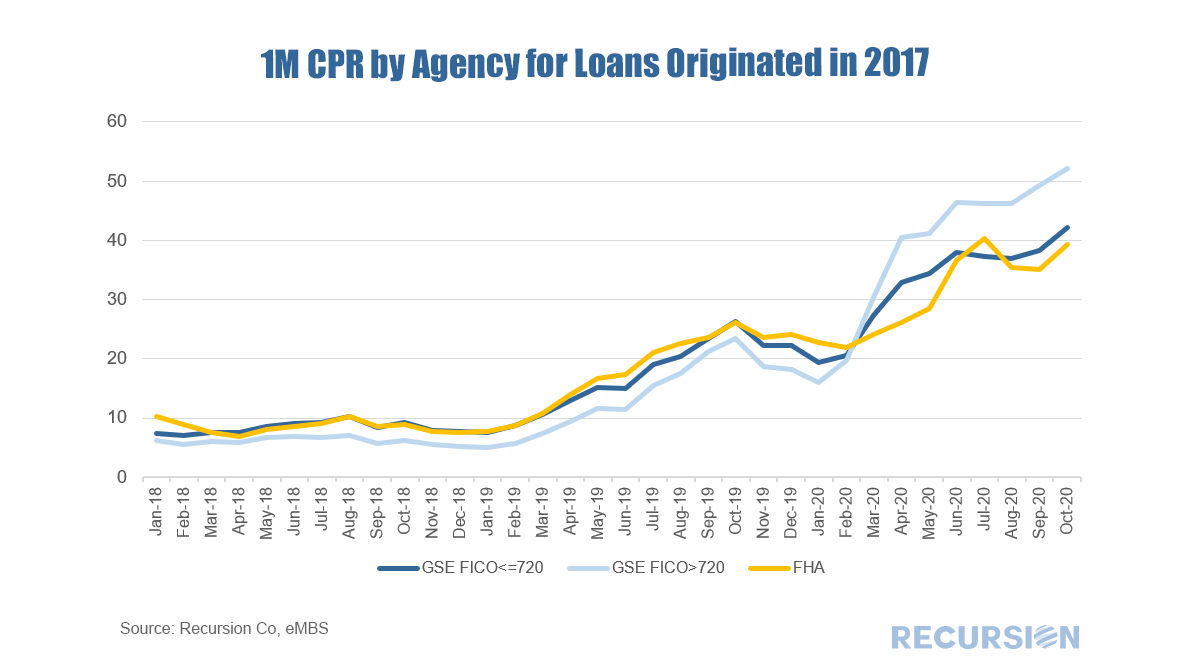 As we careen towards 2021, it’s getting to be time to look down from the top of the roller coaster towards the abyss below. The view is extremely hazy, but fortunately we have big data tools at our disposal to help clarify things. In mortgage space the single main question is what’s going to happen when forbearance expires. This program was designed to run out after a year, and that will be coming up starting next spring. If you are in forbearance and your time runs out, you have three choices:
Like all things related to mortgages, this is far more complicated than it appears. According to the Mortgage Bankers Association, 5.9% of mortgages are in a forbearance program[1]. The NY Fed tells us that outstanding mortgages amount to about $10 trillion.[2] So large numbers are involved. The main market focus is on the distribution of outcomes when forbearance ends. This depends on a number of factors including the strength of the economy and the effectiveness of public health policy, as well as the financial condition of mortgage lenders and servicers. None of these are easy to predict. One ongoing theme from these notes is that the COVID-19 crisis is resulting in policy actions that impact behaviors across the MBS production pipeline. One of these has to do with a change in the loan buyout policy from pools issued by the GSEs. Previously, general policy was to purchase loans out of pools that had become four months delinquent[1]. However, with the onset of the crisis, delinquent loans in forbearance programs remain in pools as long as this status is maintained[2]. Consequently, last week’s release of pool data by Freddie Mac gives us the opportunity to look at the share of loans that are 120D+DQ (as April was the first month in which the impact of COVID-19 became significant). 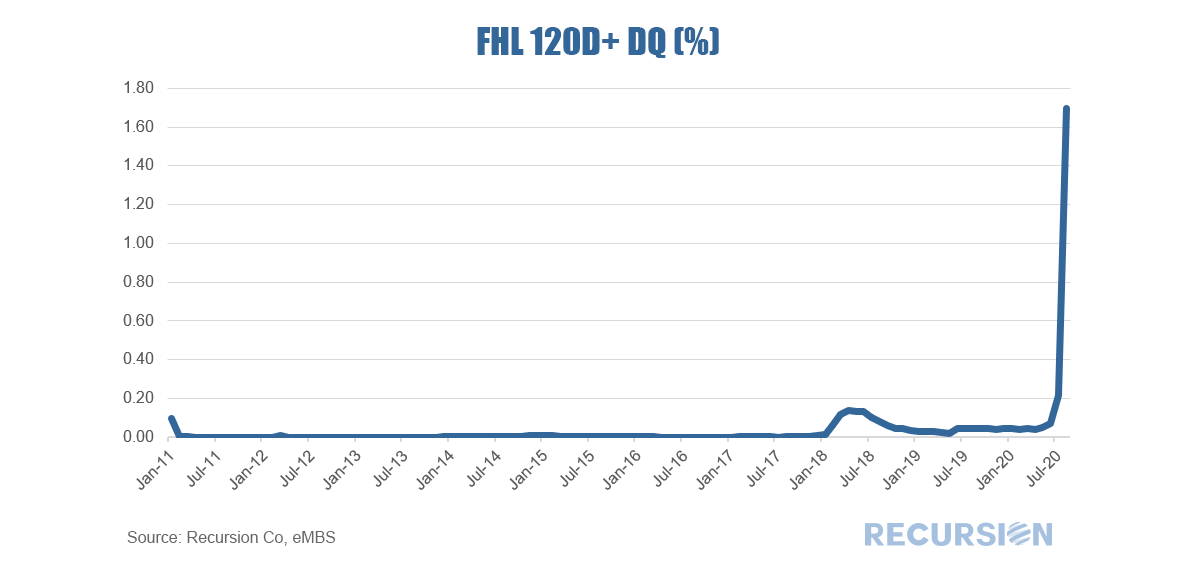 Besides allowing us to track the magnitude of loans that have been delinquent for an extended period, this data allows us to make inferences about shifts in the composition of the burden of covering P&I costs between sectors for loans in forbearance. As we have written previously[3], this cost burden shifts from the servicers to the GSEs after four months of missed payments. Consequently, starting next month servicers will see costs related to loans that have missed payments for such a period move off their plates and onto those of Fannie Mae and Freddie Mac. Insofar as the volume of loans beginning to miss payments is less than those which have missed more than four months payments, the aggregate cost burden on servicers may fall. Consequently, upward pressure on the mortgage spread over Treasuries may have scope to ease. Of course, these costs don’t disappear; they merely get transferred to the taxpayers. Another potential flashpoint in our volatile age. [1] See, for example, Appendix D, p. 3 http://www.freddiemac.com/mbs/docs/single_security_update.pdf
[2] See p. 8 http://www.freddiemac.com/mbs/docs/single_security_update.pdf [3] https://www.recursionco.com/blog/can-mortgage-rates-fall-below-3 Freddie Mac started to release forbearance data on its STACR CRT program in the July reporting cycle. Previously, the GSEs disclosed only pool-level delinquency and forbearance information [1]. As the loans in the STACR program have a UPB representing over 50% of total deliveries to FHL balances with no obvious state level bias, they would serve as a representative sample in calculating GSE state level delinquency [2]. Similarly, the new STACR data is helpful in assessing the impact of the COVID-19 crisis on forbearance at loan level. From the July STACR data release, we can see a clear correlation between total delinquency rates and forbearance rates at state level. States with higher delinquency rates, such as New York, New Jersey, Hawaii, and Nevada, also have higher forbearance rates. 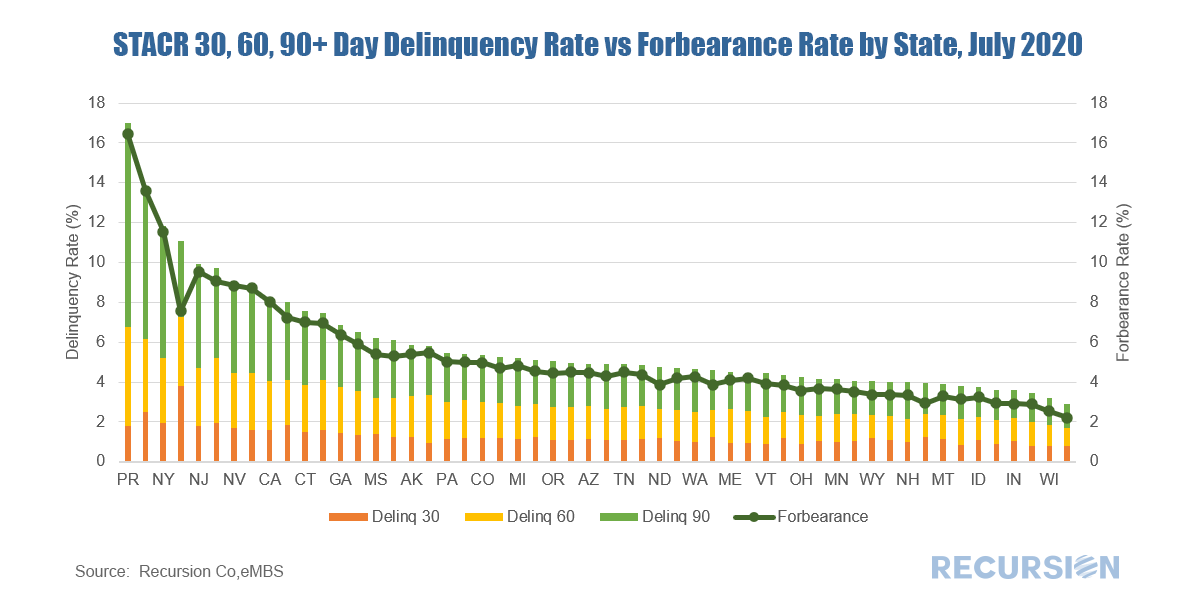 *The Chart can be duplicated using the above two queries This is not a surprise as we noted in an earlier post that Freddie Mac servicers are not required to report loans in forbearance if loans are current [3]. In fact, for STACR data, only 0.95% of current loans are in a forbearance plan, but the forbearance rate for loans in 30 day delinquency, 60 day delinquency, and 90+day delinquency are 30.64%, 92.98%, and 92.12 % respectively. 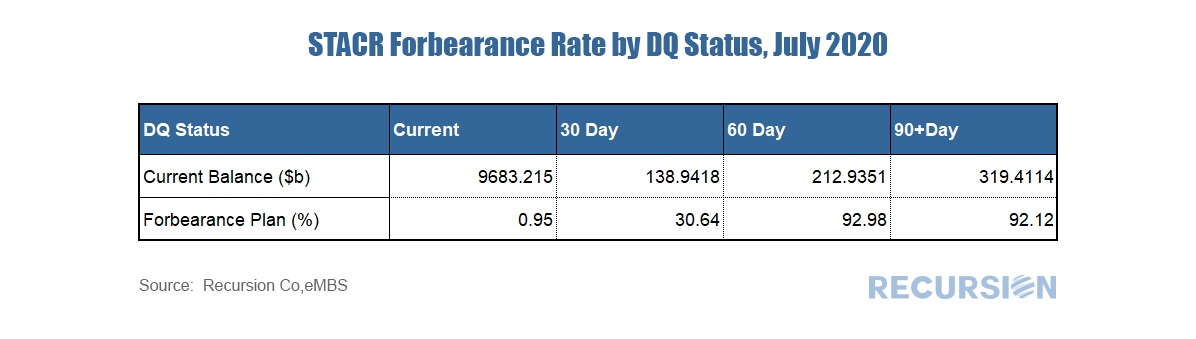 |
Archives
February 2024
Tags
All
|
 RSS Feed
RECURSION |
|

Copyright © 2022 Recursion, Co. All rights reserved.