|
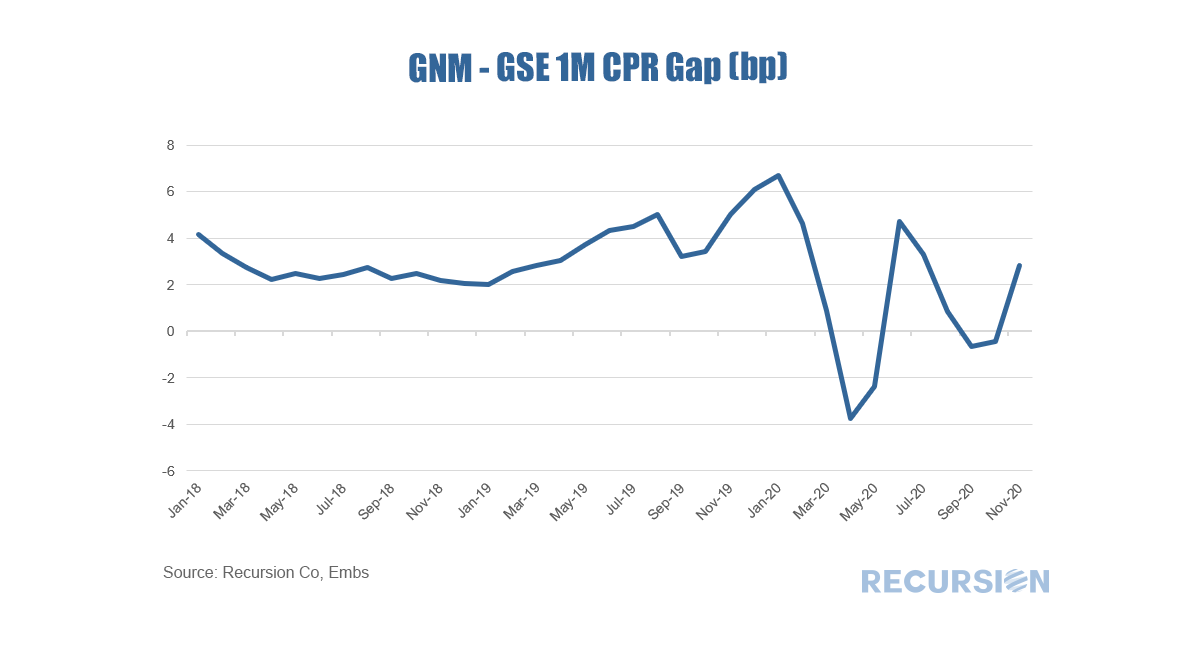
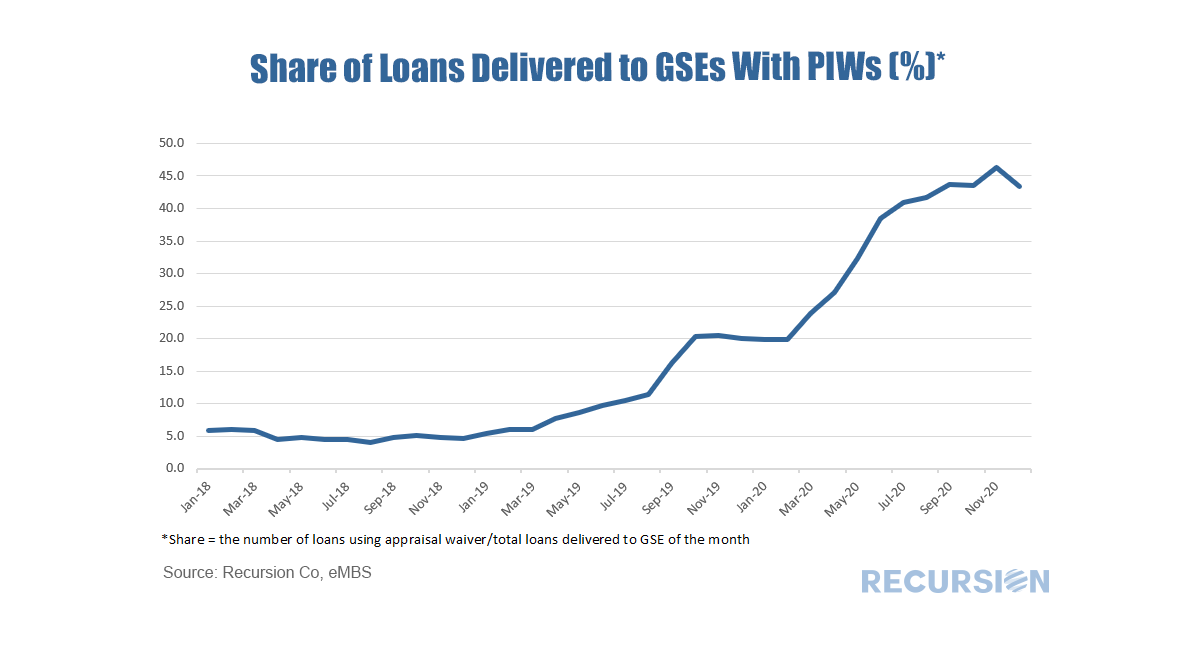
For some time, we have been talking about the key driver of mortgage performance is policy rather than fundamentals. This theme is certainly evident with the release of agency prepayment data for November[1]. The chart below chart displays the gap between the 1M prepayment speeds between Ginnie Mae and GSE securities: What stands out the most in this chart is the sudden burst of volatility in this figure which began at the start of 2020. A key factor behind the pickup in conforming speeds relative to Government programs at the beginning of the year was the growing popularity of property inspection wavers: Use of these waivers accelerated starting in March as the onset of the Covid-19 pandemic dissuaded the use of on-site property inspections. There are, however, distinct policy actions that have had an impact of prepayments:
Interestingly, the speed gap in November at 3 bps is very much in the center of the range in evidence for much of 2018 and 2019, so the roller coaster has returned to its home base. Looking out to 2021, there is ample scope for another ride given the potential for volatility around such issues as GSE reform and the disposition of loans once forbearance expires. |
Archives
July 2024
Tags
All
|
RECURSION |
|
Copyright © 2022 Recursion, Co. All rights reserved.


 RSS Feed
