|
Two data releases Monday night paint a picture of hyper-kinetic refinancing activity and new deterioration in GSE credit performance. First, all three agencies released prepayment data for June showing record refinancings, led by Ginnie Mae programs which skyrocketed by over 10 CPR to 37! This is a much greater increase than experienced by both Fannie Mae (+3.4 to 30.9), and Freddie Mac (+3.2 to 32.0). A significant portion of GNM CPR’s increase could derive from elevated involuntary prepays (CDR), quite possibly driven by the very recent change made to GNM pooling rules regarding reperforming loans[1]. 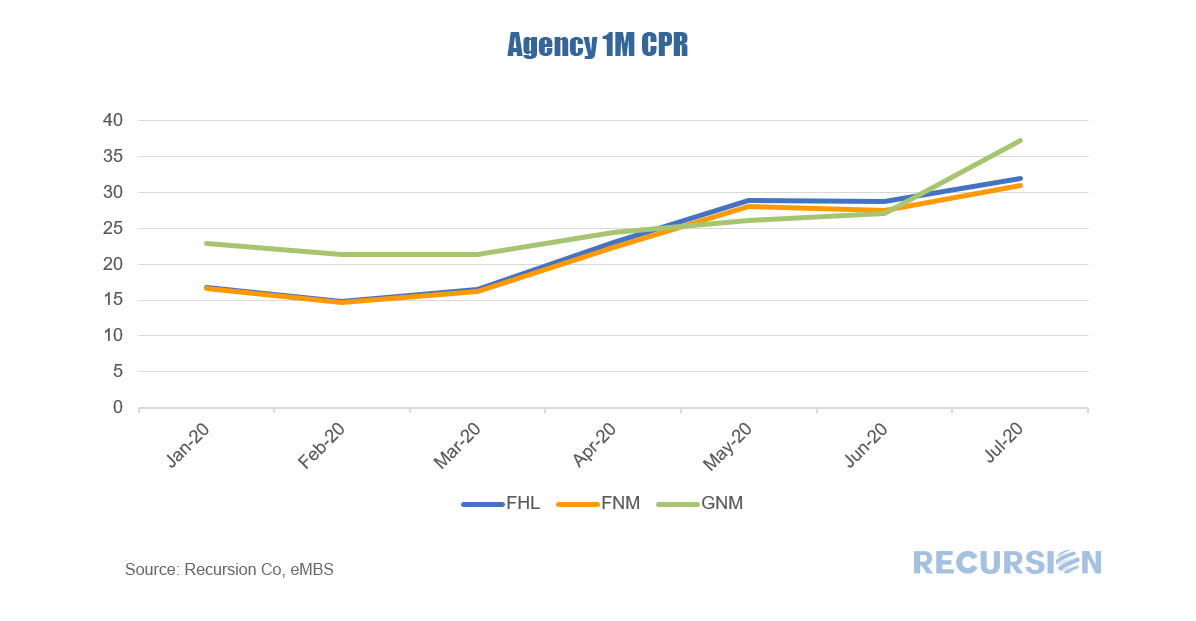 Earlier this month we discussed the new pool-level forbearance and delinquency data released by the GSE’s[1]. At that time, we noted that the delinquency data looked reasonable for May, but that the forbearance data fell short of other reported measures, particularly for Freddie Mac. 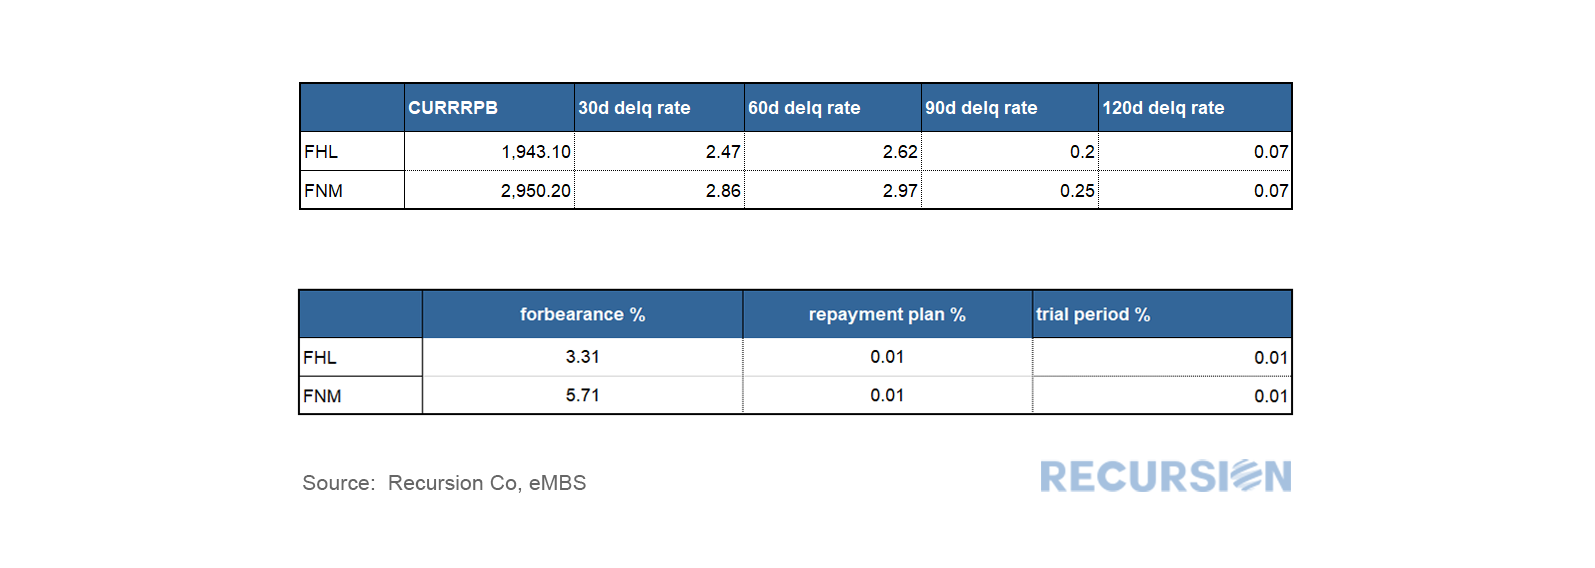 The release of the Ginnie Mae loan-level forbearance data[1] earlier this week enabled us to see the impact of the Covid-19 crisis on forbearance. An immediate question is how this data relates to delinquency. We have commented previously that forbearance and delinquency are distinct concepts as borrowers may choose to enroll in a forbearance program as an option to stop paying their mortgage on short notice in the future[2]. The pool level data released earlier this month by the GSE’s is not of high quality and showed forbearance rates less than those released from other sources. The Ginnie Mae loan level data appears to be very accurate, and in synch with other reports. Within the category of forbearance loans, 27.9% of Covid related are still paying. The portion for not Covid related is 15.5%[3]. This result provides confirmation that a significant portion of borrowers have availed themselves of the option to stop paying without exercising it yet. 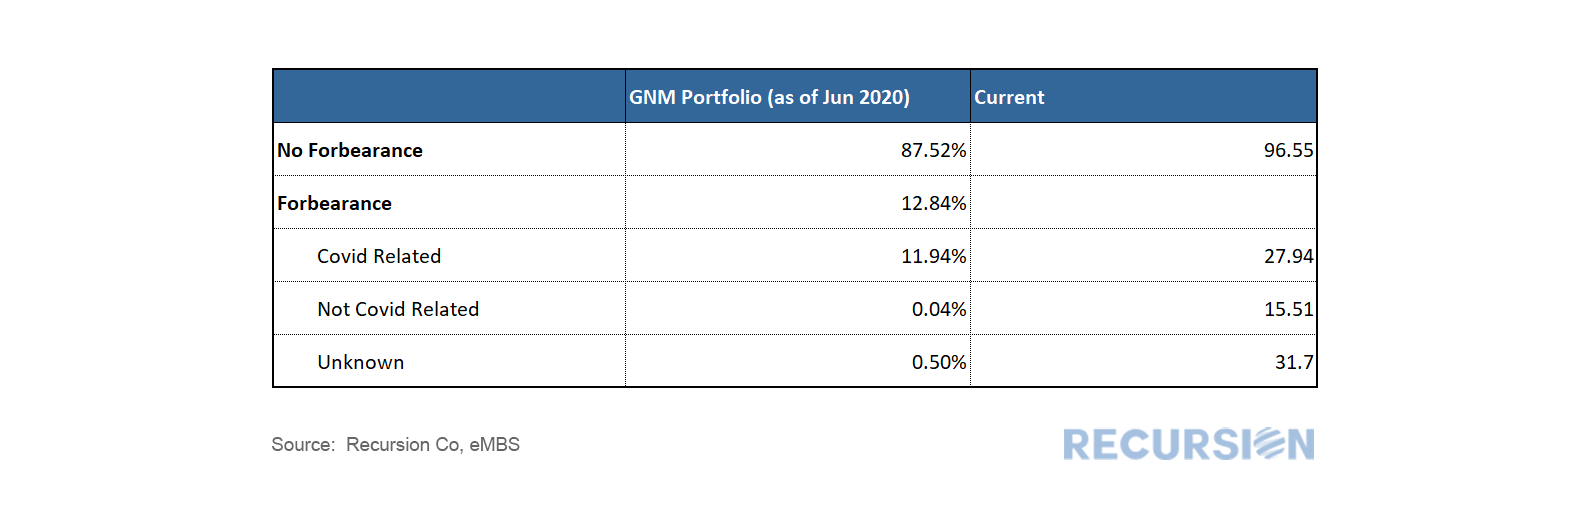 We received loan-level forbearance data from Ginnie Mae for May earlier today. The data are of high quality and appear to be broadly in line with the data reported by the Mortgage Bankers Association for the month of a little over 11% (no breakdown by program is given). The data appear to be a much better representation of market conditions than the pool-level data released by the GSE’s earlier in the month[1]. As this data is on the loan level, we can look at the relationship between this and delinquency data by state level geography and other characteristics such as bank/nonbank and underwriting characteristics and we will provide some analysis of this sort in upcoming posts. 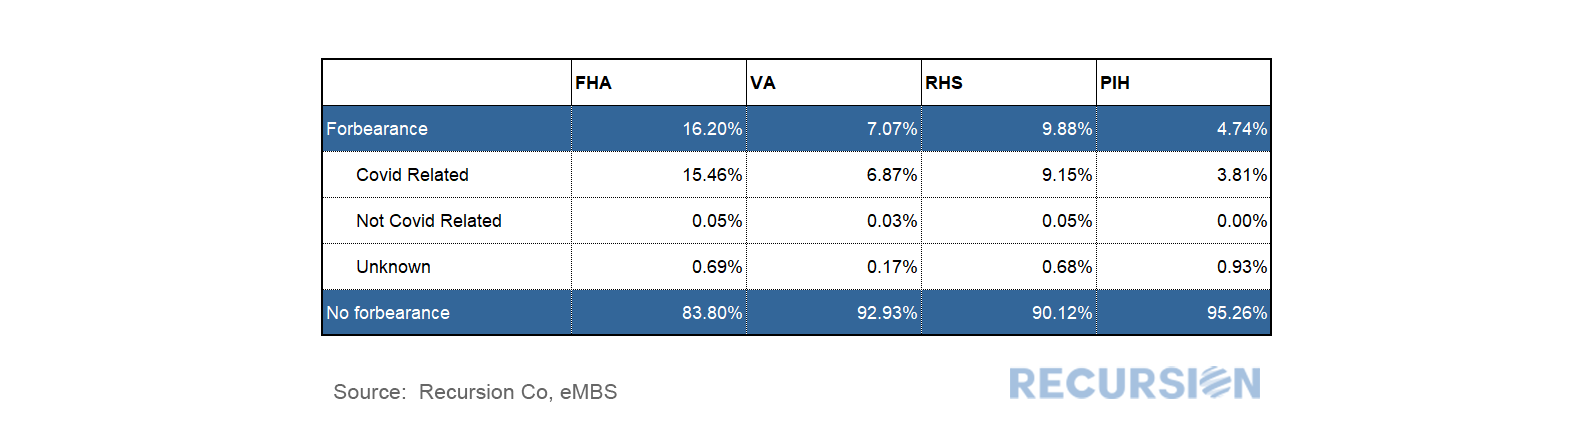 With the release of the GSE delivery data for May late last week we can start to see the impact of the Covid-19 crisis on the spectrum of loans delivered to Freddie Mac and Fannie Mae. First, deliveries of purchase mortgages have so far held up, with May deliveries up 3.5% from a year earlier. The notable development, however is the discrepancy between bank and nonbank deliveries, with Nonbank lenders in May delivering 30% more loans compared to a year earlier, while banks delivered 24% less. 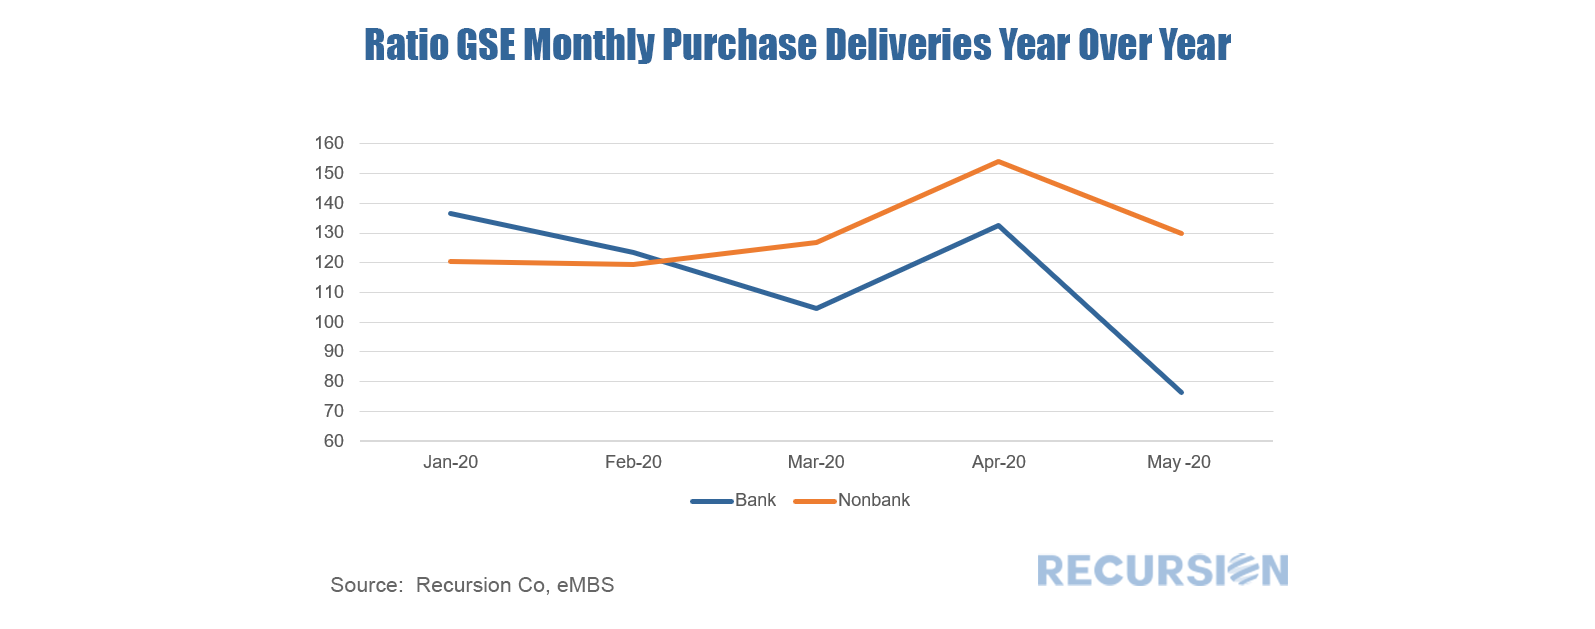 In general, mortgage production has held up because mortgage rates are at record lows in the face of the economic crisis. The question is why they hold up better for nonbanks than banks. The bank data are more complicated to analyze than nonbank because banks have the option of holding loans on their balance sheets so a decline in deliveries may be due to an increase in loans retained rather than a drop in originations. Such a decline seems unlikely at present because banks have an incentive to sell loans that might go into forbearance because the two agencies charge the lenders substantially for such purchases[1]. We have commented previously that banks are reducing loan balances but adding MBS to their balance sheets to reduce these risks[2]. Another possibility is that banks are tightening lending standards due to concerns about rep and warrant issues if loans become delinquent. It is also possible that the virus has accelerated the trend to fintech lending, much like it has online shopping. There leaves many paths to investigate in future posts. We received delinquency and forbearance information for the GSE pools late last night. By balance, the pools with such information cover over 99% of FHL and 92% of FNM pools, which is satisfactory. In terms of delinquency, Fannie Mae reported higher delinquency rate than Freddie Mac, which is in line with the relatively higher DTI’s seen in FNM deliveries in recent years. Freddie’s 30d delinquency rate reported in May was 2.47%, about 0.4% below the same figure for Fannie Mae . 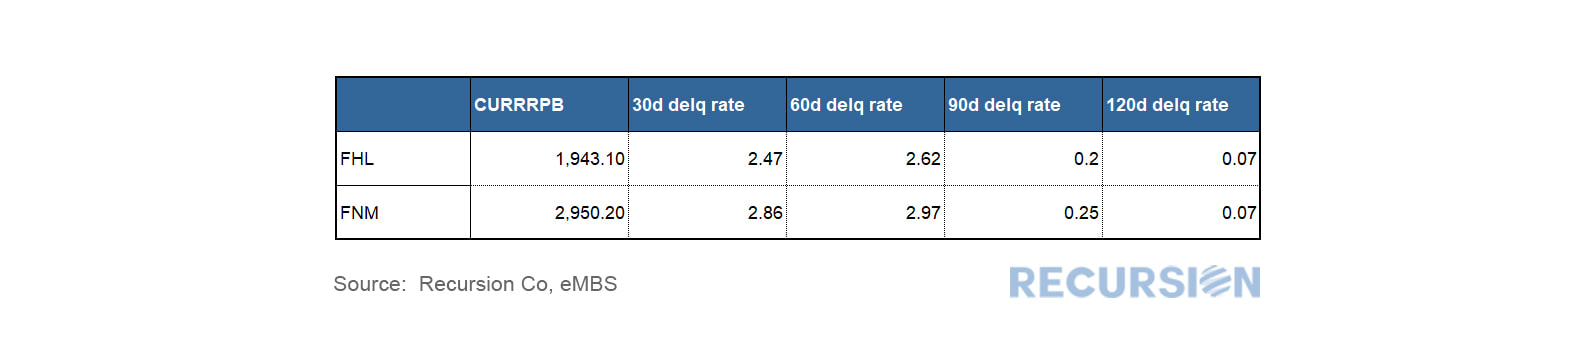  The loan-level data releases we receive early each month contain delinquency data for Government programs such as FHA and VA, but no such information is provided by the GSE’s. However, late in the month data is provided for the reference loans in the Credit Risk Sharing (CRT) programs. However, data for the most recent month is only provided by the Freddie Mac Structured Agency Credit Risk (STACR) program as the comparable Fannie Mae data is released with a 1-month lag. The latest STACR data shows the 30day delinquency rate for Freddie CRT pools went up from 0.76% in April to 4.20% this month. The states with the highest delinquency rates are: 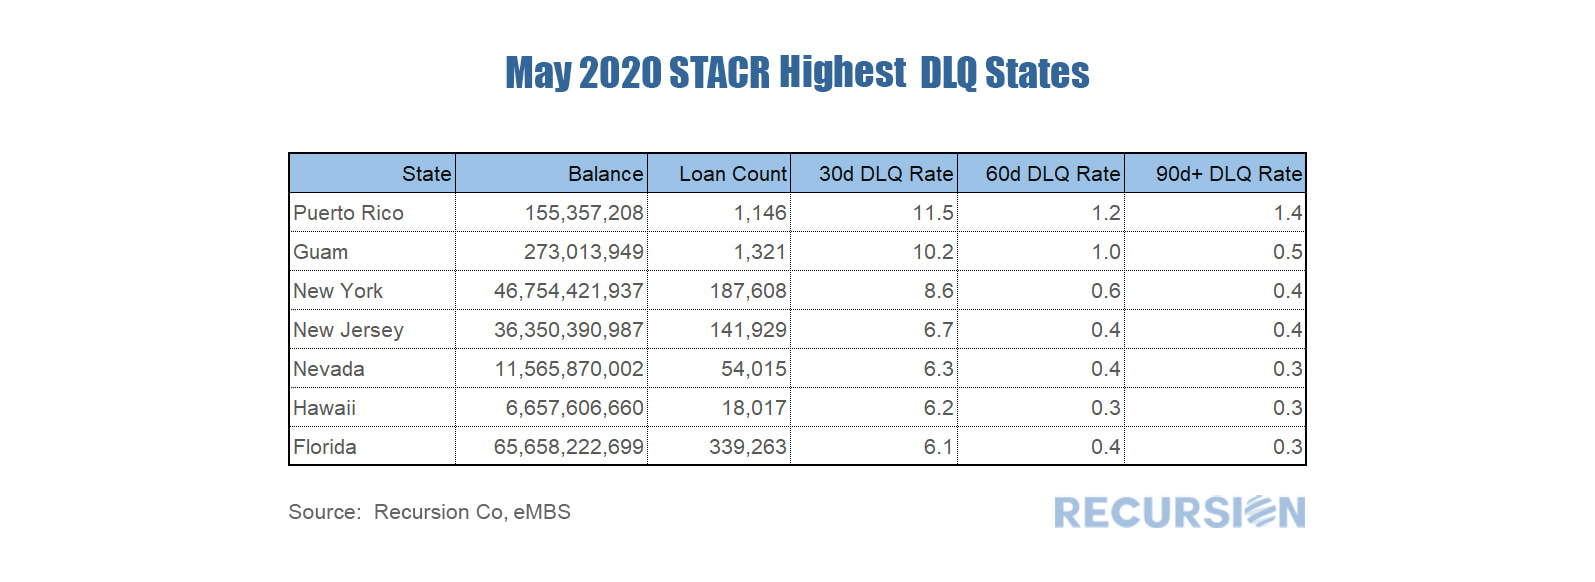 And the states with the lowest delinquency rates are: 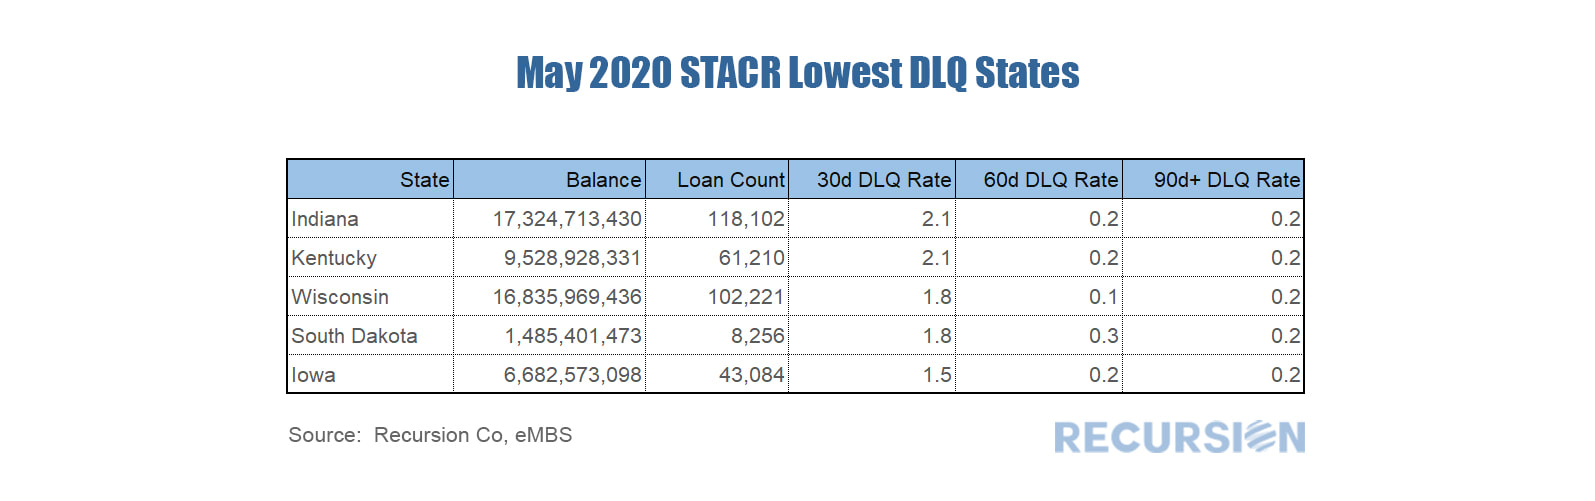 The state rankings are broadly in line with those observed in the Government data. For example, the top three states in terms of 30-day dq’s for the FHA program are New York (14.4%), NJ (13.9%) and Puerto Rico (13.2%). In general, DQ’s for FHA are higher than those for the GSE’s due to the broader credit criteria available in Government programs.
Delinquencies are important in the CRT program because they have the potential to turn into losses shared with private investors. The forbearance programs will delay but not completely prevent this transmission. The ultimate extent of investor losses depends on the duration of the Covid-19 crisis, and ensuing policy actions. There is a lot of confusion in the market regarding the interpretation of new data released by the two GSE’s, the delinquency distribution and forbearance distribution for some new pools. The data available so far are very limited, but we can draw some tentative conclusions from what we have. As of this morning we found 11 pools with both a delinquency distribution and a forbearance distribution from the eMBS data feed. For 6 of them, forbearance numbers are the same as 30d delinquency numbers. For 5 of them, forbearance numbers are bigger than the delinquency numbers, and often by a significant margin. 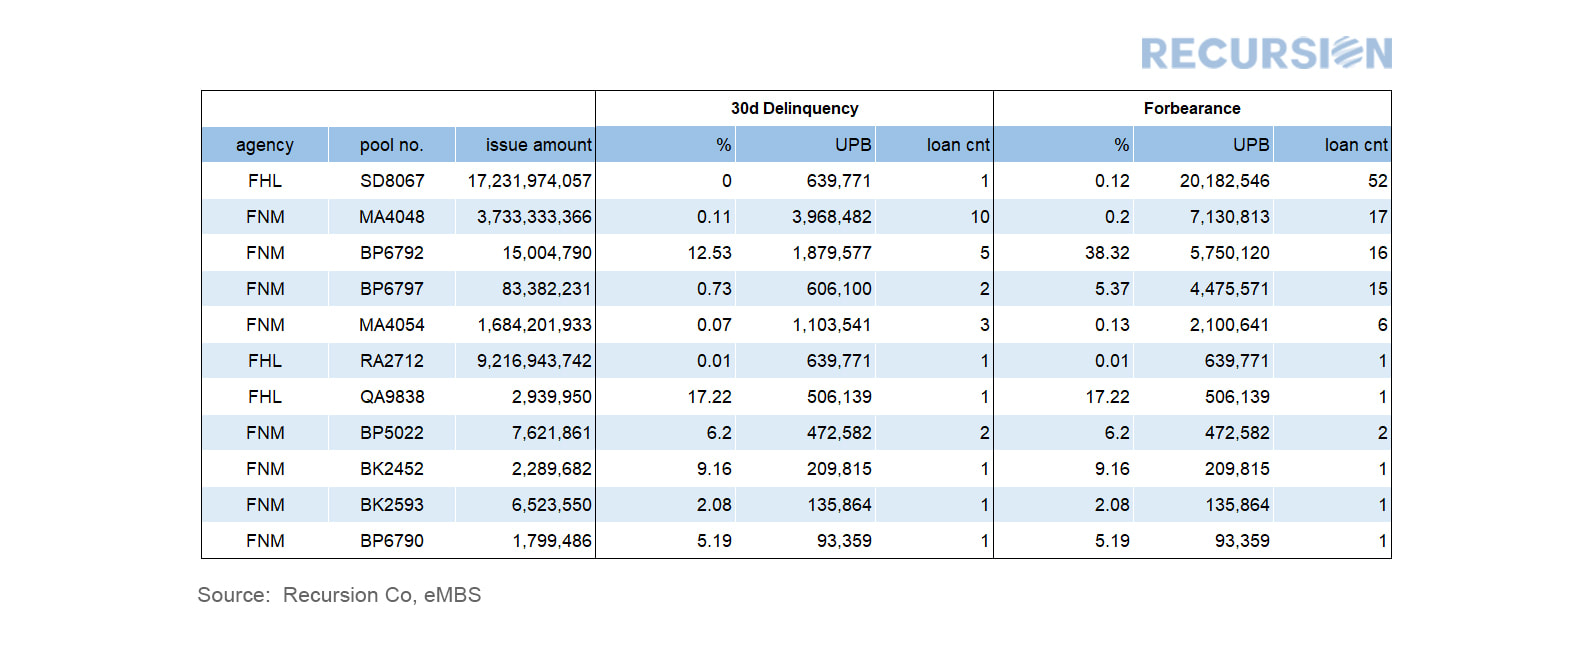 |
Archives
February 2024
Tags
All
|
 RSS Feed
RECURSION |
|

Copyright © 2022 Recursion, Co. All rights reserved.